| 1 Severe necrotising enterocolitis (stage II‐III) Show forest plot | 20 | 5529 | Risk Ratio (M‐H, Fixed, 95% CI) | 0.43 [0.33, 0.56] |
|
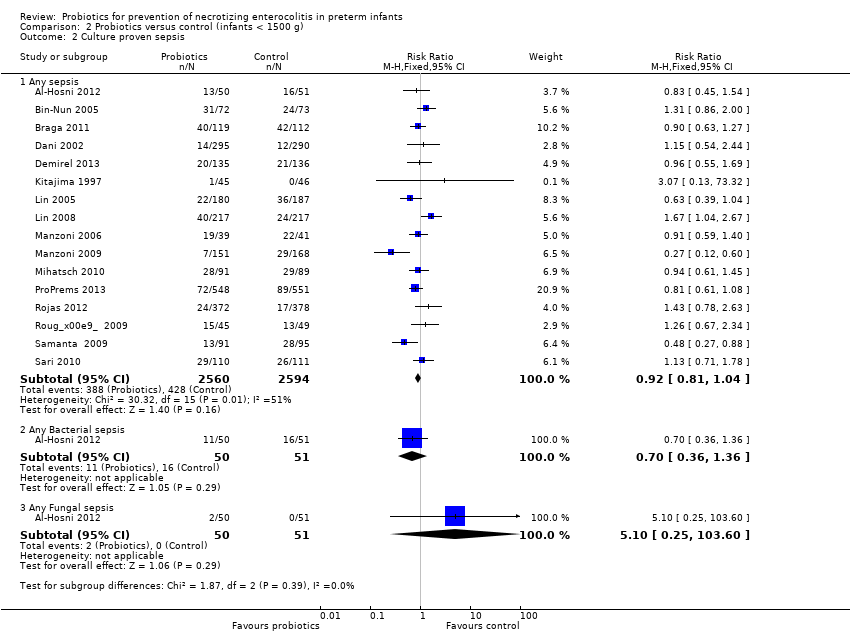
| 2 Culture proven sepsis Show forest plot | 19 | | Risk Ratio (M‐H, Fixed, 95% CI) | Subtotals only |
|
| 2.1 Any sepsis | 19 | 5338 | Risk Ratio (M‐H, Fixed, 95% CI) | 0.91 [0.80, 1.03] |
| 2.2 Any Bacterial sepsis | 1 | 101 | Risk Ratio (M‐H, Fixed, 95% CI) | 0.70 [0.36, 1.36] |
| 2.3 Any Fungal sepsis | 1 | 101 | Risk Ratio (M‐H, Fixed, 95% CI) | 5.10 [0.25, 103.60] |
| 3 Mortality Show forest plot | 18 | | Risk Ratio (M‐H, Fixed, 95% CI) | Subtotals only |
|
| 3.1 All causes of neonatal mortality | 17 | 5112 | Risk Ratio (M‐H, Fixed, 95% CI) | 0.65 [0.52, 0.81] |
| 3.2 NEC related mortality | 7 | 2755 | Risk Ratio (M‐H, Fixed, 95% CI) | 0.39 [0.18, 0.82] |
| 4 Parenteral nutrition duration (days) Show forest plot | 7 | 2804 | Mean Difference (IV, Fixed, 95% CI) | ‐0.25 [‐0.52, 0.03] |
|
| 5 Hospitalization duration (days) Show forest plot | 11 | 3713 | Mean Difference (IV, Fixed, 95% CI) | ‐3.71 [‐4.32, ‐3.11] |
|
| 6 Weight gain Show forest plot | 5 | | Mean Difference (IV, Fixed, 95% CI) | Subtotals only |
|
| 6.1 g/week | 1 | 87 | Mean Difference (IV, Fixed, 95% CI) | 7.20 [‐0.06, 14.46] |
| 6.2 g/day | 2 | 131 | Mean Difference (IV, Fixed, 95% CI) | 2.14 [0.01, 4.27] |
| 6.3 g/kg/day | 2 | 241 | Mean Difference (IV, Fixed, 95% CI) | 0.28 [‐0.93, 1.49] |
| 7 Time to full enteral feeds Show forest plot | 8 | 2657 | Mean Difference (IV, Fixed, 95% CI) | ‐1.32 [‐1.48, ‐1.17] |
|
| 8 Death or severe NEC or sepsis Show forest plot | 1 | 367 | Risk Ratio (M‐H, Fixed, 95% CI) | 0.54 [0.37, 0.79] |
|
| 9 Long‐term outcomes Show forest plot | 1 | | Risk Ratio (M‐H, Fixed, 95% CI) | Subtotals only |
|
| 9.1 Mental retardation and Cerebral palsy | 1 | 85 | Risk Ratio (M‐H, Fixed, 95% CI) | 1.02 [0.15, 6.94] |