Tratamiento con inhibidores de la bomba de protones iniciado antes del diagnóstico endoscópico en la hemorragia digestiva alta
Information
- DOI:
- https://doi.org/10.1002/14651858.CD005415.pub4Copy DOI

- Database:
-
- Cochrane Database of Systematic Reviews
- Version published:
-
- 07 January 2022see what's new
- Type:
-
- Intervention
- Stage:
-
- Review
- Cochrane Editorial Group:
-
Cochrane Gut Group
- Copyright:
-
- Copyright © 2022 The Cochrane Collaboration. Published by John Wiley & Sons, Ltd.
Article metrics
Altmetric:
Cited by:
Authors
Contributions of authors
T. Kanno: reviewed the methods and approved minor changes, performed the updated literature search and eligibility assessments (selection) of the search results, re‐extracted data and conducted risk of bias assessments, conducted certainty of evidence assessments with the GRADE approach. Drafted the first version of the manuscript. Provided critical feedback, edited the review and gave final approval.
Y. Yuan: performed the updated literature search and eligibility assessments (selection) of the search results, re‐extracted data, conducted risk of bias assessments, conducted certainty of evidence assessments with the GRADE approach. Drafted the first version of the manuscript. Provided critical feedback, edited the review and gave final approval.
F. Tse: acted as an arbiter for the assessment of risk of bias assessments and certainty of evidence assessments. Provided critical feedback, edited the review and gave final approval.
C. Howden (CWH): provided critical feedback, edited the review and gave final approval.
P. Moayyedi (PM): provided critical feedback, edited the review and gave final approval.
G. Leontiadis: performed an independent literature search and eligibility assessment (selection), acted as a third reviewer to double‐check data extractions, risk of bias assessments, and certainty of evidence assessments.
All review authors of the previous versions of the review (including GL, CWH and PM) were responsible for protocol design and conception and design of the review.
Sources of support
Internal sources
-
No sources of support, Other
No sources of support
External sources
-
New Source of support, Other
No sources of support
Declarations of interest
Conflicts of interest are declared for the period since April 2015 (i.e. three years prior to the decision to update this review).
T. Kanno: none known
Y. Yuan: none known
F. Tse: none known
C. Howden: has consulted and spoken for RedHill Biopharma, manufacturers of Talicia ‐ a combination product containing omeprazole which is approved in the USA for treatment of H pylori infection; is acting as an expert witness for Takeda, manufacturers of lansoprazole and dexlansoprazole, in litigation.
P. Moayyedi: none known
G. Leontiadis: none known
Acknowledgements
The authors would like to thank Professor Morris Gordon (Coordinating Editor/Contact Editor) and Ghazaleh Aali (Managing Editor) at Cochrane Gut Group's UK editorial team at the University of Central Lancashire, and Rachel Richardson (Associate Editor) at Cochrane Abdomen and Endocrine Network, for their support in completing this review.
We acknowledge Stephanie Dorward, David Forman and Aravamuthan Sreedharan for their contributions to the 2005 protocol and 2006 and 2010 versions of this review; Janet Martin for her contributions to the 2006 and 2010 versions of this review; and Iris Gordon, Trial Search Coordinator for Cochrane Upper Gastrointestinal and Pancreatic Disease Group, for conducting the initial literature searches.
We acknowledge Racquel Simpson, Trial Search Coordinator for Cochrane Upper Gastrointestinal and Pancreatic Disease Group, for conducting the updated literature searches in October 2008.
We thank Jan Lilleyman and Cathy Bennett for coordinating the 2006 update of this review and for administrative and logistical support for the 2010 update.
The authors acknowledge the support from the University of Leeds and the NHS R & D Health Technology Assessment Programme (Project 03/12/03), UK, for the first publication of this review in 2006.
With regards to the current review, the authors would like to thank the following editors and peer referees who provided feedback to improve the review: Morris Gordon (Co‐ordinating Editor), Ghazaleh Aali (Managing Editor), Ebbe Langholz and Xavier Calvet (Peer Reviewers). Yuhong Yuan (Information Specialist, Cochrane Gut) designed and ran the search strategies.
The authors also would like to thank Faith Armitage (Copy Editor) and the Wiley Copy Editor team for providing copy editing comments.
Version history
| Published | Title | Stage | Authors | Version |
| 2022 Jan 07 | Proton pump inhibitor treatment initiated prior to endoscopic diagnosis in upper gastrointestinal bleeding | Review | Takeshi Kanno, Yuhong Yuan, Frances Tse, Colin W Howden, Paul Moayyedi, Grigorios I Leontiadis | |
| 2010 Jul 07 | Proton pump inhibitor treatment initiated prior to endoscopic diagnosis in upper gastrointestinal bleeding | Review | Aravamuthan Sreedharan, Janet Martin, Grigorios I Leontiadis, Stephanie Dorward, Colin W Howden, David Forman, Paul Moayyedi | |
| 2006 Oct 18 | Proton pump inhibitor treatment initiated prior to endoscopic diagnosis in upper gastrointestinal bleeding | Review | Aravamuthan Sreedharan, Janet Martin, Grigorios I Leontiadis, Stephanie Dorward, Colin W Howden, David Forman, Paul Moayyedi | |
| 2005 Jul 20 | Proton Pump Inhibitors (before endoscopic diagnosis) in upper gastrointestinal bleeding | Protocol | Stephanie Dorward, David Forman, Colin W Howden, Grigoris I Leontiadis, Aravamuthan Sreedharan | |
Differences between protocol and review
In the previous versions, a post hoc decision was made to include a third author to independently extract data. Two post hoc analyses were conducted: concerning blood transfusion requirements and proportion of participants with presence of blood in the stomach.
In the current version, we made the following changes.
-
We changed the wording of the objectives to adhere to the standard Cochrane format.
-
We changed the definition of an outcome: time to discharge instead of length of stay.
-
We used the updated risk of bias tool.
-
We assessed the certainty of evidence as per GRADE and prepared summary of findings tables.
-
We used a random‐effects model for all analyses, and a fixed‐effect model as sensitivity analysis.
-
We deleted the previously done sensitivity analyses for all outcomes by excluding one study at a time.
-
The three post hoc analyses added in the previous versions of the review are now incorporated as sensitivity analyses: number of participants requiring blood transfusion; active bleeding at index endoscopy; blood in stomach at index endoscopy.
-
We clarified the criteria for selective outcome reporting.
-
We clarified that cluster‐randomised and cross‐over trials were not intended to be included.
Notes
The initial protocol was published as 'Proton Pump Inhibitors (before endoscopic diagnosis) in upper gastrointestinal bleeding'. Dorward S, Forman D, Howden CW, Leontiadis GI, Sreedharan A The Cochrane Database of Systematic Reviews Published in Issue 2, 2006. Copyright © 2005 The Cochrane Collaboration. Published by John Wiley & Sons, Ltd.
Keywords
MeSH
Medical Subject Headings (MeSH) Keywords
Medical Subject Headings Check Words
Humans;
PICOs
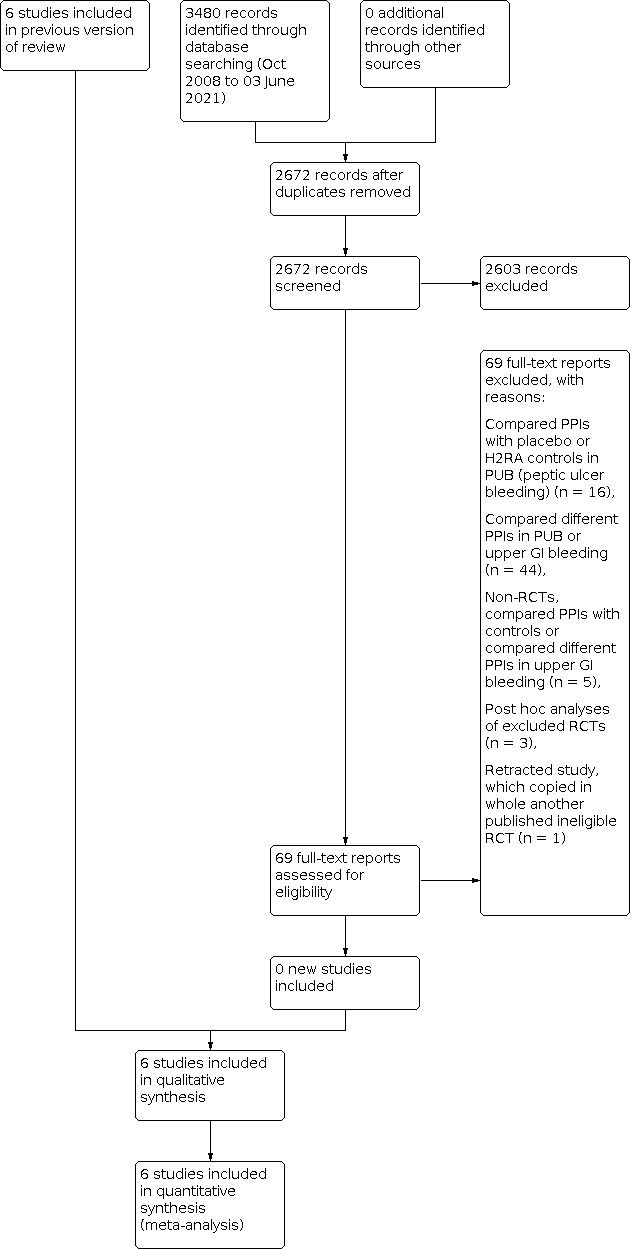
Study flow diagram: review update 03 June 2021

Risk of bias graph: review authors' judgements about each risk of bias item presented as percentages across all included studies

Risk of bias summary: review authors' judgements about each risk of bias item for each included study
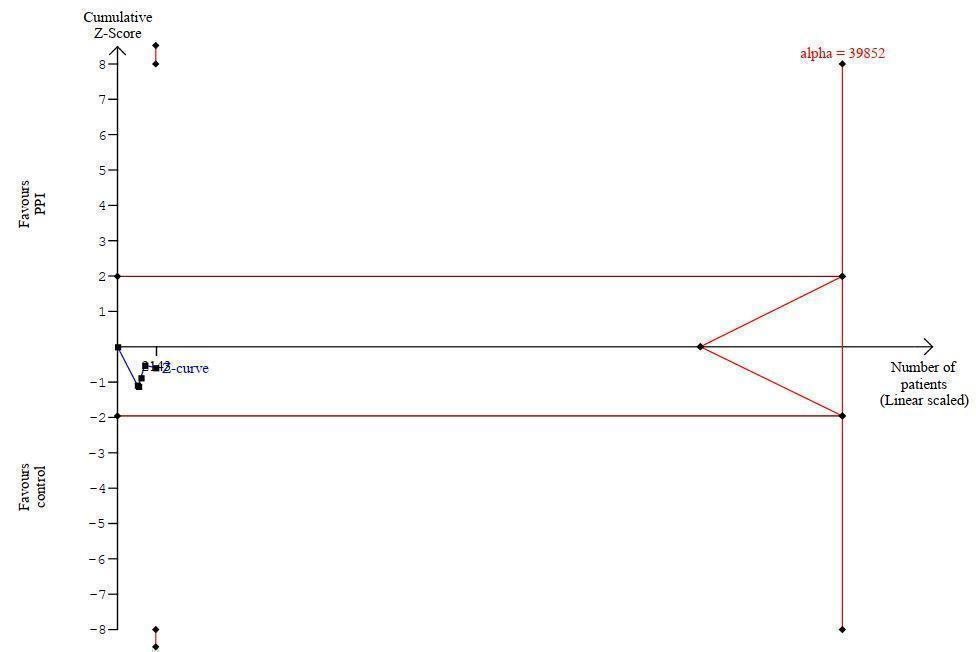
Trial sequential analysis (TSA) for outcome mortality

Trial sequential analysis (TSA) for outcome rebleeding

Comparison 1: Main analysis, Outcome 1: Mortality

Comparison 1: Main analysis, Outcome 2: Rebleeding

Comparison 1: Main analysis, Outcome 3: Surgery

Comparison 1: Main analysis, Outcome 4: Participants requiring blood transfusion

Comparison 1: Main analysis, Outcome 5: Proportion of participants with stigmata of recent haemorrhage

Comparison 1: Main analysis, Outcome 6: Proportion of participants with stigmata of recent haemorrhage plus Lau 2007

Comparison 1: Main analysis, Outcome 7: Proportion of participants with blood in stomach

Comparison 1: Main analysis, Outcome 8: Proportion of participants with active bleeding

Comparison 1: Main analysis, Outcome 9: Proportion of participants with active bleeding plus Lau 2007

Comparison 1: Main analysis, Outcome 10: Endoscopic haemostatic treatment at index endoscopy

Comparison 2: Subgroup analysis according to risk of bias, Outcome 1: Mortality

Comparison 2: Subgroup analysis according to risk of bias, Outcome 2: Rebleeding

Comparison 2: Subgroup analysis according to risk of bias, Outcome 3: Surgery

Comparison 2: Subgroup analysis according to risk of bias, Outcome 4: Proportion of participants with stigmata of recent haemorrhage

Comparison 2: Subgroup analysis according to risk of bias, Outcome 5: Endoscopic haemostatic treatment at index endoscopy

Comparison 3: Subgroup analysis according to geographic location, Outcome 1: Mortality

Comparison 3: Subgroup analysis according to geographic location, Outcome 2: Rebleeding

Comparison 3: Subgroup analysis according to geographic location, Outcome 3: Surgery

Comparison 4: Subgroup analysis according to route of PPI administration, Outcome 1: Mortality

Comparison 4: Subgroup analysis according to route of PPI administration, Outcome 2: Rebleeding

Comparison 4: Subgroup analysis according to route of PPI administration, Outcome 3: Surgery

Comparison 5: Subgroup analysis according to PPI dose (high dose versus non‐high dose), Outcome 1: Mortality

Comparison 5: Subgroup analysis according to PPI dose (high dose versus non‐high dose), Outcome 2: Rebleeding

Comparison 5: Subgroup analysis according to PPI dose (high dose versus non‐high dose), Outcome 3: Surgery

Comparison 6: Subgroup analysis according to control treatment, Outcome 1: Mortality

Comparison 6: Subgroup analysis according to control treatment, Outcome 2: Rebleeding

Comparison 6: Subgroup analysis according to control treatment, Outcome 3: Surgery

Comparison 7: Subgroup analysis according to use of endoscopic haemostatic treatment at index endoscopy, Outcome 1: Mortality

Comparison 7: Subgroup analysis according to use of endoscopic haemostatic treatment at index endoscopy, Outcome 2: Rebleeding

Comparison 7: Subgroup analysis according to use of endoscopic haemostatic treatment at index endoscopy, Outcome 3: Surgery

Comparison 8: Sensitivity analysis restricted to peptic ulcer participants, Outcome 1: Mortality

Comparison 8: Sensitivity analysis restricted to peptic ulcer participants, Outcome 2: Rebleeding

Comparison 8: Sensitivity analysis restricted to peptic ulcer participants, Outcome 3: Surgery
| Main analysis: proton pump inhibitor treatment compared to H2RA, placebo or no treatment in people with upper gastrointestinal bleeding prior to endoscopic diagnosis | |||||
| Patient or population: people with upper gastrointestinal bleeding prior to endoscopic diagnosis | |||||
| Outcomes | Anticipated absolute effects* (95% CI) | Relative effect | № of participants | Certainty of the evidence | |
|---|---|---|---|---|---|
| With control treatment | With PPI treatment | ||||
| Mortality ‐ within 30 days | Study population | OR 1.14 | 2143 | ⊕⊕⊝⊝ | |
| 45 per 1000 | 6 more per 1000 | ||||
| Rebleeding ‐ within 30 days | Study population | OR 0.81 | 2121 | ⊕⊕⊝⊝ | |
| 131 per 1000 | 23 less per 1000 | ||||
| Surgery ‐ within 30 days | Study population | OR 0.91 | 2223 | ⊕⊕⊝⊝ | |
| 77 per 1000 | 6 less per 1000 | ||||
| Proportion of participants with stigmata of recent haemorrhage at index endoscopy | Study population | OR 0.80 | 1332 | ⊕⊕⊝⊝ | |
| 465 per 1000 | 42 less per 1000 | ||||
| Endoscopic haemostatic treatment at index endoscopy | Study population | OR 0.68 | 1983 | ⊕⊕⊕⊝ | |
| 118 per 1000 | 33 less per 1000 | ||||
| *The risk in the intervention group (and its 95% confidence interval) is based on the assumed risk in the comparison group and the relative effect of the intervention (and its 95% CI). | |||||
| GRADE Working Group grades of evidence | |||||
| aThe certainty of evidence for mortality was rated down one level due to serious study limitations. Two of the five studies had high risk of bias (high risk of performance bias due to lack of blinding; unclear risk of selection bias due to unclear random sequence generation and unclear allocation concealment), and two other studies had unclear risk of bias (unclear risk of selection bias due to unclear allocation concealment). Of note, if by a 'sensitivity approach' the above‐mentioned four studies were excluded, then all the evidence would be derived from one RCT at low risk of bias (Lau 2007): the effect estimate would remain similar, and there would be no study limitations, but the imprecision would further worsen and would be considered very serious (due to very wide 95% CI and only 15 events in total) requiring rating down by two levels for imprecision; therefore, the certainty of evidence would be low with either approach. | |||||
| Outcome or subgroup title | No. of studies | No. of participants | Statistical method | Effect size |
| 1.1 Mortality Show forest plot | 5 | 2143 | Risk Ratio (M‐H, Random, 95% CI) | 1.13 [0.77, 1.66] |
| 1.2 Rebleeding Show forest plot | 5 | 2121 | Odds Ratio (M‐H, Random, 95% CI) | 0.81 [0.62, 1.06] |
| 1.3 Surgery Show forest plot | 6 | 2223 | Odds Ratio (M‐H, Random, 95% CI) | 0.91 [0.65, 1.26] |
| 1.4 Participants requiring blood transfusion Show forest plot | 4 | 1512 | Odds Ratio (M‐H, Random, 95% CI) | 0.95 [0.75, 1.20] |
| 1.5 Proportion of participants with stigmata of recent haemorrhage Show forest plot | 4 | 1332 | Odds Ratio (M‐H, Random, 95% CI) | 0.80 [0.52, 1.21] |
| 1.6 Proportion of participants with stigmata of recent haemorrhage plus Lau 2007 Show forest plot | 5 | 1709 | Odds Ratio (M‐H, Random, 95% CI) | 0.68 [0.50, 0.93] |
| 1.7 Proportion of participants with blood in stomach Show forest plot | 3 | 1230 | Odds Ratio (M‐H, Random, 95% CI) | 0.64 [0.32, 1.30] |
| 1.8 Proportion of participants with active bleeding Show forest plot | 4 | 1332 | Odds Ratio (M‐H, Random, 95% CI) | 0.74 [0.53, 1.02] |
| 1.9 Proportion of participants with active bleeding plus Lau 2007 Show forest plot | 5 | 1709 | Odds Ratio (M‐H, Random, 95% CI) | 0.67 [0.47, 0.95] |
| 1.10 Endoscopic haemostatic treatment at index endoscopy Show forest plot | 3 | 1983 | Odds Ratio (M‐H, Random, 95% CI) | 0.68 [0.50, 0.93] |
| Outcome or subgroup title | No. of studies | No. of participants | Statistical method | Effect size |
| 2.1 Mortality Show forest plot | 5 | 2143 | Odds Ratio (M‐H, Random, 95% CI) | 1.14 [0.76, 1.70] |
| 2.1.1 low or unclear risk of bias | 3 | 1983 | Odds Ratio (M‐H, Random, 95% CI) | 1.20 [0.79, 1.84] |
| 2.1.2 high risk of bias | 2 | 160 | Odds Ratio (M‐H, Random, 95% CI) | 0.66 [0.18, 2.46] |
| 2.2 Rebleeding Show forest plot | 5 | 2121 | Odds Ratio (M‐H, Random, 95% CI) | 0.81 [0.62, 1.06] |
| 2.2.1 low or unclear risk of bias | 3 | 1983 | Odds Ratio (M‐H, Random, 95% CI) | 0.87 [0.65, 1.16] |
| 2.2.2 high risk of bias | 2 | 138 | Odds Ratio (M‐H, Random, 95% CI) | 0.45 [0.19, 1.03] |
| 2.3 Surgery Show forest plot | 6 | 2223 | Odds Ratio (M‐H, Random, 95% CI) | 0.91 [0.65, 1.26] |
| 2.3.1 low or unclear risk of bias | 3 | 1983 | Odds Ratio (M‐H, Random, 95% CI) | 0.90 [0.64, 1.27] |
| 2.3.2 high risk of bias | 3 | 240 | Odds Ratio (M‐H, Random, 95% CI) | 0.85 [0.22, 3.37] |
| 2.4 Proportion of participants with stigmata of recent haemorrhage Show forest plot | 4 | 1332 | Odds Ratio (M‐H, Random, 95% CI) | 0.80 [0.52, 1.21] |
| 2.4.1 low or unclear risk of bias | 2 | 1172 | Odds Ratio (M‐H, Random, 95% CI) | 0.79 [0.40, 1.55] |
| 2.4.2 high risk of bias | 2 | 160 | Odds Ratio (M‐H, Random, 95% CI) | 1.01 [0.46, 2.19] |
| 2.5 Endoscopic haemostatic treatment at index endoscopy Show forest plot | 3 | 1983 | Odds Ratio (M‐H, Random, 95% CI) | 0.68 [0.50, 0.93] |
| 2.5.1 low or unclear risk of bias | 3 | 1983 | Odds Ratio (M‐H, Random, 95% CI) | 0.68 [0.50, 0.93] |
| Outcome or subgroup title | No. of studies | No. of participants | Statistical method | Effect size |
| 3.1 Mortality Show forest plot | 5 | 2143 | Odds Ratio (M‐H, Random, 95% CI) | 1.14 [0.76, 1.70] |
| 3.1.1 Asian | 2 | 689 | Odds Ratio (M‐H, Random, 95% CI) | 1.13 [0.43, 2.96] |
| 3.1.2 Non‐Asian | 3 | 1454 | Odds Ratio (M‐H, Random, 95% CI) | 0.96 [0.48, 1.94] |
| 3.2 Rebleeding Show forest plot | 5 | 2121 | Odds Ratio (M‐H, Random, 95% CI) | 0.81 [0.62, 1.06] |
| 3.2.1 Asian | 2 | 689 | Odds Ratio (M‐H, Random, 95% CI) | 1.04 [0.45, 2.40] |
| 3.2.2 Non‐Asian | 3 | 1432 | Odds Ratio (M‐H, Random, 95% CI) | 0.78 [0.59, 1.04] |
| 3.3 Surgery Show forest plot | 6 | 2223 | Odds Ratio (M‐H, Random, 95% CI) | 0.91 [0.65, 1.26] |
| 3.3.1 Asian | 2 | 689 | Odds Ratio (M‐H, Random, 95% CI) | 0.67 [0.19, 2.39] |
| 3.3.2 Non‐Asian | 4 | 1534 | Odds Ratio (M‐H, Random, 95% CI) | 0.93 [0.66, 1.30] |
| Outcome or subgroup title | No. of studies | No. of participants | Statistical method | Effect size |
| 4.1 Mortality Show forest plot | 5 | 2143 | Odds Ratio (M‐H, Random, 95% CI) | 1.14 [0.76, 1.70] |
| 4.1.1 Oral PPI | 1 | 205 | Odds Ratio (M‐H, Random, 95% CI) | 0.39 [0.07, 2.07] |
| 4.1.2 Intravenous PPI | 4 | 1938 | Odds Ratio (M‐H, Random, 95% CI) | 1.21 [0.80, 1.85] |
| 4.2 Rebleeding Show forest plot | 5 | 2121 | Odds Ratio (M‐H, Random, 95% CI) | 0.81 [0.62, 1.06] |
| 4.2.1 Oral PPI | 1 | 205 | Odds Ratio (M‐H, Random, 95% CI) | 1.01 [0.40, 2.54] |
| 4.2.2 Intravenous PPI | 4 | 1916 | Odds Ratio (M‐H, Random, 95% CI) | 0.79 [0.55, 1.13] |
| 4.3 Surgery Show forest plot | 6 | 2223 | Odds Ratio (M‐H, Random, 95% CI) | 0.91 [0.65, 1.26] |
| 4.3.1 Oral PPI | 1 | 205 | Odds Ratio (M‐H, Random, 95% CI) | 0.49 [0.12, 2.01] |
| 4.3.2 Intravenous PPI | 5 | 2018 | Odds Ratio (M‐H, Random, 95% CI) | 0.94 [0.67, 1.31] |
| Outcome or subgroup title | No. of studies | No. of participants | Statistical method | Effect size |
| 5.1 Mortality Show forest plot | 5 | 2143 | Odds Ratio (M‐H, Random, 95% CI) | 1.14 [0.76, 1.70] |
| 5.1.1 High dose PPI | 1 | 631 | Odds Ratio (M‐H, Random, 95% CI) | 1.16 [0.41, 3.23] |
| 5.1.2 Non‐high dose PPI | 4 | 1512 | Odds Ratio (M‐H, Random, 95% CI) | 1.13 [0.73, 1.76] |
| 5.2 Rebleeding Show forest plot | 5 | 2121 | Odds Ratio (M‐H, Random, 95% CI) | 0.81 [0.62, 1.06] |
| 5.2.1 High dose PPI | 1 | 631 | Odds Ratio (M‐H, Random, 95% CI) | 1.40 [0.56, 3.53] |
| 5.2.2 Non‐high dose PPI | 4 | 1490 | Odds Ratio (M‐H, Random, 95% CI) | 0.77 [0.58, 1.02] |
| 5.3 Surgery Show forest plot | 6 | 2223 | Odds Ratio (M‐H, Random, 95% CI) | 0.91 [0.65, 1.26] |
| 5.3.1 High dose PPI | 1 | 631 | Odds Ratio (M‐H, Random, 95% CI) | 0.67 [0.19, 2.39] |
| 5.3.2 Non‐high dose PPI | 5 | 1592 | Odds Ratio (M‐H, Random, 95% CI) | 0.93 [0.66, 1.30] |
| Outcome or subgroup title | No. of studies | No. of participants | Statistical method | Effect size |
| 6.1 Mortality Show forest plot | 5 | 2143 | Odds Ratio (M‐H, Random, 95% CI) | 1.14 [0.76, 1.70] |
| 6.1.1 PPI versus placebo | 3 | 1983 | Odds Ratio (M‐H, Random, 95% CI) | 1.20 [0.79, 1.84] |
| 6.1.2 PPI versus H2RA | 2 | 160 | Odds Ratio (M‐H, Random, 95% CI) | 0.66 [0.18, 2.46] |
| 6.2 Rebleeding Show forest plot | 5 | 2121 | Odds Ratio (M‐H, Random, 95% CI) | 0.81 [0.62, 1.06] |
| 6.2.1 PPI versus placebo | 3 | 1983 | Odds Ratio (M‐H, Random, 95% CI) | 0.87 [0.65, 1.16] |
| 6.2.2 PPI versus H2RA | 1 | 58 | Odds Ratio (M‐H, Random, 95% CI) | 0.56 [0.14, 2.26] |
| 6.2.3 PPI versus no treatment | 1 | 80 | Odds Ratio (M‐H, Random, 95% CI) | 0.39 [0.14, 1.12] |
| 6.3 Surgery Show forest plot | 6 | 2223 | Odds Ratio (M‐H, Random, 95% CI) | 0.91 [0.65, 1.26] |
| 6.3.1 PPI versus placebo | 3 | 1983 | Odds Ratio (M‐H, Random, 95% CI) | 0.90 [0.64, 1.27] |
| 6.3.2 PPI versus H2RA | 2 | 160 | Odds Ratio (M‐H, Random, 95% CI) | 1.53 [0.45, 5.18] |
| 6.3.3 PPI versus no treatment | 1 | 80 | Odds Ratio (M‐H, Random, 95% CI) | 0.37 [0.07, 2.02] |
| Outcome or subgroup title | No. of studies | No. of participants | Statistical method | Effect size |
| 7.1 Mortality Show forest plot | 5 | 2143 | Odds Ratio (M‐H, Random, 95% CI) | 1.14 [0.76, 1.70] |
| 7.1.1 Reported use of endoscopic haemostatic treatment at index endoscopy | 4 | 2041 | Odds Ratio (M‐H, Random, 95% CI) | 1.20 [0.78, 1.82] |
| 7.1.2 No mention of endoscopic haemostatic treatment at index endoscopy | 1 | 102 | Odds Ratio (M‐H, Random, 95% CI) | 0.60 [0.14, 2.66] |
| 7.2 Rebleeding Show forest plot | 5 | 2121 | Odds Ratio (M‐H, Random, 95% CI) | 0.81 [0.62, 1.06] |
| 7.2.1 Reported use of endoscopic haemostatic treatment at index endoscopy | 4 | 2041 | Odds Ratio (M‐H, Random, 95% CI) | 0.85 [0.65, 1.13] |
| 7.2.2 No mention of endoscopic haemostatic treatment at index endoscopy | 1 | 80 | Odds Ratio (M‐H, Random, 95% CI) | 0.39 [0.14, 1.12] |
| 7.3 Surgery Show forest plot | 6 | 2223 | Odds Ratio (M‐H, Random, 95% CI) | 0.91 [0.65, 1.26] |
| 7.3.1 Reported use of endoscopic haemostatic treatment at index endoscopy | 4 | 2041 | Odds Ratio (M‐H, Random, 95% CI) | 0.90 [0.64, 1.27] |
| 7.3.2 No mention of endoscopic haemostatic treatment at index endoscopy | 2 | 182 | Odds Ratio (M‐H, Random, 95% CI) | 0.85 [0.22, 3.37] |
| Outcome or subgroup title | No. of studies | No. of participants | Statistical method | Effect size |
| 8.1 Mortality Show forest plot | 2 | 580 | Odds Ratio (M‐H, Random, 95% CI) | 1.39 [0.52, 3.70] |
| 8.2 Rebleeding Show forest plot | 2 | 880 | Odds Ratio (M‐H, Fixed, 95% CI) | 0.86 [0.59, 1.26] |
| 8.3 Surgery Show forest plot | 2 | 880 | Odds Ratio (M‐H, Random, 95% CI) | 0.91 [0.59, 1.40] |