Scolaris Content Display Scolaris Content Display

Study flow diagram.
Figures and Tables -
Figure 1

Study flow diagram.

Risk of bias graph: review authors' judgements about each risk of bias item presented as percentages across all included studies.
Figures and Tables -
Figure 2

Risk of bias graph: review authors' judgements about each risk of bias item presented as percentages across all included studies.

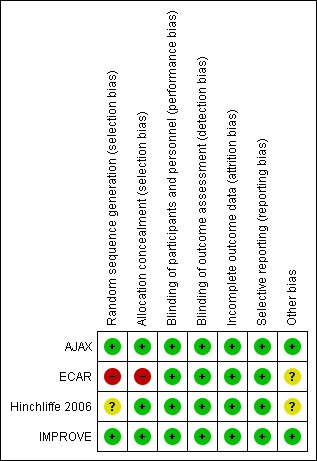
Risk of bias summary: review authors' judgements about each risk of bias item for each included study.
Figures and Tables -
Figure 3

Risk of bias summary: review authors' judgements about each risk of bias item for each included study.

Comparison 1 Emergency endovascular aneurysm repair versus open repair, Outcome 1 Short‐term mortality (30‐day or in‐hospital).
Figures and Tables -
Analysis 1.1

Comparison 1 Emergency endovascular aneurysm repair versus open repair, Outcome 1 Short‐term mortality (30‐day or in‐hospital).

Comparison 1 Emergency endovascular aneurysm repair versus open repair, Outcome 2 Major complications ‐ 30‐day.
Figures and Tables -
Analysis 1.2

Comparison 1 Emergency endovascular aneurysm repair versus open repair, Outcome 2 Major complications ‐ 30‐day.

Comparison 1 Emergency endovascular aneurysm repair versus open repair, Outcome 3 Complication ‐ Myocardial infarction.
Figures and Tables -
Analysis 1.3

Comparison 1 Emergency endovascular aneurysm repair versus open repair, Outcome 3 Complication ‐ Myocardial infarction.

Comparison 1 Emergency endovascular aneurysm repair versus open repair, Outcome 4 Complication ‐ Stroke.
Figures and Tables -
Analysis 1.4

Comparison 1 Emergency endovascular aneurysm repair versus open repair, Outcome 4 Complication ‐ Stroke.

Comparison 1 Emergency endovascular aneurysm repair versus open repair, Outcome 5 Complication ‐ Cardiac complications (moderate or severe).
Figures and Tables -
Analysis 1.5

Comparison 1 Emergency endovascular aneurysm repair versus open repair, Outcome 5 Complication ‐ Cardiac complications (moderate or severe).

Comparison 1 Emergency endovascular aneurysm repair versus open repair, Outcome 6 Complication ‐ Renal complications (moderate or severe).
Figures and Tables -
Analysis 1.6

Comparison 1 Emergency endovascular aneurysm repair versus open repair, Outcome 6 Complication ‐ Renal complications (moderate or severe).

Comparison 1 Emergency endovascular aneurysm repair versus open repair, Outcome 7 Complication ‐ Respiratory failure.
Figures and Tables -
Analysis 1.7

Comparison 1 Emergency endovascular aneurysm repair versus open repair, Outcome 7 Complication ‐ Respiratory failure.

Comparison 1 Emergency endovascular aneurysm repair versus open repair, Outcome 8 Complication ‐ Bowel ischaemia.
Figures and Tables -
Analysis 1.8

Comparison 1 Emergency endovascular aneurysm repair versus open repair, Outcome 8 Complication ‐ Bowel ischaemia.

Comparison 1 Emergency endovascular aneurysm repair versus open repair, Outcome 9 Complication ‐ Spinal cord ischaemia.
Figures and Tables -
Analysis 1.9

Comparison 1 Emergency endovascular aneurysm repair versus open repair, Outcome 9 Complication ‐ Spinal cord ischaemia.

Comparison 1 Emergency endovascular aneurysm repair versus open repair, Outcome 10 Complication ‐ Reoperation.
Figures and Tables -
Analysis 1.10

Comparison 1 Emergency endovascular aneurysm repair versus open repair, Outcome 10 Complication ‐ Reoperation.

Comparison 1 Emergency endovascular aneurysm repair versus open repair, Outcome 11 Complication ‐ Amputation.
Figures and Tables -
Analysis 1.11

Comparison 1 Emergency endovascular aneurysm repair versus open repair, Outcome 11 Complication ‐ Amputation.

Comparison 1 Emergency endovascular aneurysm repair versus open repair, Outcome 12 Mortality ‐ 6 months.
Figures and Tables -
Analysis 1.12

Comparison 1 Emergency endovascular aneurysm repair versus open repair, Outcome 12 Mortality ‐ 6 months.

Comparison 1 Emergency endovascular aneurysm repair versus open repair, Outcome 13 Major complications ‐ 6 months.
Figures and Tables -
Analysis 1.13

Comparison 1 Emergency endovascular aneurysm repair versus open repair, Outcome 13 Major complications ‐ 6 months.

Comparison 1 Emergency endovascular aneurysm repair versus open repair, Outcome 14 Complication ‐ Reoperation ‐ 6 months.
Figures and Tables -
Analysis 1.14

Comparison 1 Emergency endovascular aneurysm repair versus open repair, Outcome 14 Complication ‐ Reoperation ‐ 6 months.

Comparison 1 Emergency endovascular aneurysm repair versus open repair, Outcome 15 Mortality ‐ 1 year.
Figures and Tables -
Analysis 1.15

Comparison 1 Emergency endovascular aneurysm repair versus open repair, Outcome 15 Mortality ‐ 1 year.

Comparison 1 Emergency endovascular aneurysm repair versus open repair, Outcome 16 Cost per patient ‐ 30‐day.
Figures and Tables -
Analysis 1.16

Comparison 1 Emergency endovascular aneurysm repair versus open repair, Outcome 16 Cost per patient ‐ 30‐day.

Summary of findings for the main comparison. Emergency endovascular aneurysm repair compared to conventional open repair for ruptured abdominal aortic aneurysm

Emergency endovascular aneurysm repair (eEVAR) compared to conventional open repair for ruptured abdominal aortic aneurysm

Patient or population: people diagnosed with RAAA
Setting: hospital

Intervention: eEVAR
Comparison: conventional open repair

Outcomes

№ of participants
(studies)

Quality of the evidence
(GRADE)

Relative effect
(95% CI)

Anticipated absolute effects* (95% CI)

Risk with conventional open repair

Risk difference with eEVAR

Short‐term mortality

(30‐day or in‐hospital)

868
(4 RCTs)

⊕⊕⊕⊝
MODERATE1

OR 0.88
(0.66 to 1.16)

Study population

366 per 1000

29 fewer per 1000
(90 fewer to 35 more)

Endoleak

(30‐day)

128
(3 RCTs)

⊕⊕⊝⊝
LOW2

A total of 44 endoleak events occurred in 128 participants randomised to eEVAR treatment. As endoleaks are only a result of endovascular repair, meta‐analysis was inappropriate.

Complication: myocardial infarction

(30‐day)

139
(2 RCTs)

⊕⊕⊝⊝
LOW3,4

OR 2.38
(0.34 to 16.53)

Study population

15 per 1000

20 more per 1000
(10 fewer to 183 more)

Complication: renal complications (moderate or severe)

(30‐day)

255
(3 RCTs)

⊕⊕⊝⊝
LOW3,5

OR 1.07
(0.21 to 5.42)

Study population

197 per 1000

11 more per 1000
(148 fewer to 374 more)

Complication: respiratory failure

(30‐day)

32
(1 RCT)

⊕⊕⊝⊝
LOW6

OR 3.62
(0.14 to 95.78)

Study population

1 respiratory failure event occurred in 15 participants who were randomised to eEVAR treatment. No respiratory failure events were reported in the open‐repair group.

Complication: bowel ischaemia

(30‐day)

223
(2 RCTs)

⊕⊕⊝⊝
LOW3,4

OR 0.37
(0.14 to 0.94)

Study population

145 per 1000

86 fewer per 1000
(122 fewer to 8 fewer)

Mortality

(6 months)

116
(1 RCT)

⊕⊕⊕⊝
MODERATE3

OR 0.89
(0.40 to 1.98)

Study population

305 per 1000

24 fewer per 1000
(156 fewer to 160 more)

*We calculated the assumed risk of the conventional open‐repair group from the average risk in the conventional open‐repair group (i.e. the number of participants with events divided by total number of participants of the conventional open‐repair group included in the meta‐analysis). The risk in the intervention group (and its 95% confidence interval) is based on the assumed risk in the comparison group and the relative effect of the intervention (and its 95% CI).
CI: confidence interval; eEVAR: emergency endovascular aneurysm repair; OR: odds ratio; RAAA: ruptured abdominal aortic aneurysm; RCT: randomised controlled trial

GRADE Working Group grades of evidence
High quality: We are very confident that the true effect lies close to that of the estimate of the effect.
Moderate quality: We are moderately confident in the effect estimate: The true effect is likely to be close to the estimate of the effect, but there is a possibility that it is substantially different.
Low quality: Our confidence in the effect estimate is limited: The true effect may be substantially different from the estimate of the effect.
Very low quality: We have very little confidence in the effect estimate: The true effect is likely to be substantially different from the estimate of effect.

1Downgraded by one level due to imprecision: two of the three studies included in this outcome were underpowered to report on this outcome, as calculated by the study authors.
2Downgraded by two levels due to inconsistency: event values varied greatly between studies, resulting in heterogeneity.
3Downgraded by one level due to imprecision: the outcome analysis included few participants or events, or both.
4Downgraded by one level due to risk of bias as a result of inadequate random sequence generation and allocation concealment within the ECAR study, which contributed the majority of participants within this outcome.
5Downgraded by one level due to inconsistency: event values varied between studies.
6Downgraded by two levels due to very serious imprecision: only a single event was reported in the eEVAR group.

Figures and Tables -
Summary of findings for the main comparison. Emergency endovascular aneurysm repair compared to conventional open repair for ruptured abdominal aortic aneurysm
Table 1. Perioperative and postoperative participant characteristics

AJAX

(median, IQR)

ECAR

(mean, range)

Hinchliffe 2006

(median, IQR)

IMPROVE

(mean, SD)

Time waiting for procedure

eEVAR

74 min (39 to 126 min)

2.9 hours

93 min (± 370)

Open repair

45 min (35 to 70 min)

1.3 hours

73 min (± 157)

Time in operating theatre

eEVAR

185 min (160 to 236 min)

160 min (150 to 234 min)

156 min (± 100)

Open repair

157 min (136 to 194 min)

150 min (141 to 204 min)

180 min (± 107)

Blood loss during operation

eEVAR

500 mL (200 to 1375 mL)

Units for transfusion:

6.8 (range 0 to 25.0)

200 mL (163 to 450 mL)

Open repair

3500 mL (1000 to 4600 mL)

Units for transfusion:

10.9 (range 0 to 53.0)

2100 mL (1150 to 3985 mL)

Length of hospital stay

eEVAR

9 days (4 to 21 days)

14.3 days (6.0 to 99.0)

10 days (6 to 28 days)

9.8 days (± 9.0)

Open repair

13 days (5 to 21 days)

17.1 days (9.1 to 81.1 )

12 days (4 to 52 days)

12.2 days (± 10.2)

eEVAR: emergency endovascular aneurysm repair
IQR: interquartile range
SD: standard deviation

Figures and Tables -
Table 1. Perioperative and postoperative participant characteristics
Comparison 1. Emergency endovascular aneurysm repair versus open repair

Outcome or subgroup title

No. of studies

No. of participants

Statistical method

Effect size

1 Short‐term mortality (30‐day or in‐hospital) Show forest plot

4

868

Odds Ratio (M‐H, Fixed, 95% CI)

0.88 [0.66, 1.16]

2 Major complications ‐ 30‐day Show forest plot

2

223

Odds Ratio (M‐H, Fixed, 95% CI)

0.72 [0.42, 1.23]

3 Complication ‐ Myocardial infarction Show forest plot

2

139

Odds Ratio (M‐H, Fixed, 95% CI)

2.38 [0.34, 16.53]

4 Complication ‐ Stroke Show forest plot

2

148

Odds Ratio (M‐H, Fixed, 95% CI)

0.71 [0.12, 4.31]

5 Complication ‐ Cardiac complications (moderate or severe) Show forest plot

3

253

Odds Ratio (M‐H, Fixed, 95% CI)

0.84 [0.32, 2.23]

6 Complication ‐ Renal complications (moderate or severe) Show forest plot

3

255

Odds Ratio (M‐H, Random, 95% CI)

1.07 [0.21, 5.42]

7 Complication ‐ Respiratory failure Show forest plot

1

Odds Ratio (M‐H, Fixed, 95% CI)

Totals not selected

8 Complication ‐ Bowel ischaemia Show forest plot

2

223

Odds Ratio (M‐H, Fixed, 95% CI)

0.37 [0.14, 0.94]

9 Complication ‐ Spinal cord ischaemia Show forest plot

1

Odds Ratio (M‐H, Fixed, 95% CI)

Totals not selected

10 Complication ‐ Reoperation Show forest plot

2

148

Odds Ratio (M‐H, Fixed, 95% CI)

0.89 [0.39, 2.01]

11 Complication ‐ Amputation Show forest plot

2

223

Odds Ratio (M‐H, Fixed, 95% CI)

0.16 [0.02, 1.32]

12 Mortality ‐ 6 months Show forest plot

1

Odds Ratio (M‐H, Fixed, 95% CI)

Totals not selected

13 Major complications ‐ 6 months Show forest plot

1

Odds Ratio (M‐H, Fixed, 95% CI)

Totals not selected

14 Complication ‐ Reoperation ‐ 6 months Show forest plot

1

Odds Ratio (M‐H, Fixed, 95% CI)

Totals not selected

15 Mortality ‐ 1 year Show forest plot

1

Odds Ratio (M‐H, Fixed, 95% CI)

Totals not selected

16 Cost per patient ‐ 30‐day Show forest plot

1

Mean Difference (IV, Fixed, 95% CI)

Totals not selected

Figures and Tables -
Comparison 1. Emergency endovascular aneurysm repair versus open repair