Antimicrobial agents for preventing peritonitis in peritoneal dialysis patients
Information
- DOI:
- https://doi.org/10.1002/14651858.CD004679.pub3Copy DOI

- Database:
-
- Cochrane Database of Systematic Reviews
- Version published:
-
- 08 April 2017see what's new
- Type:
-
- Intervention
- Stage:
-
- Review
- Cochrane Editorial Group:
-
Cochrane Kidney and Transplant Group
- Copyright:
-
- Copyright © 2017 The Cochrane Collaboration. Published by John Wiley & Sons, Ltd.
Article metrics
Altmetric:
Cited by:
Authors
Contributions of authors
-
Designing the review: GS, DJ, JC
-
Coordinating the update of the review: DC, GS, JC
-
Data collection for the update of the review: DC and GS, independently
-
Developing search strategy: DC and GS, independently
-
Undertaking searches: DC and GS, independently
-
Screening search results: DC and GS, independently
-
Organising retrieval of papers: DC and GS, independently
-
Screening retrieved papers against inclusion criteria; DC and GS, independently
-
Appraising quality of papers: DC and GS, independently
-
Abstracting data from papers (modified Cochrane Kidney and Transplant's data extraction form): DC and GS, independently
-
Searching for additional data in unpublished studies: DC and GS, independently
-
Entering data into RevMan: DC
-
Analysis of data: DC, GS, JC
-
Interpretation of data: DC, GS, JC
-
Providing a methodological perspective: GS, JC
-
Providing a clinical perspective: GS, DJ, JC
-
Providing a policy perspective: GS, DJ, JC
-
Providing a consumer perspective: GS, DJ, JC
-
Writing the review: DC, GS, DJ, JC
-
Providing general advice on the review: JC, GS
Declarations of interest
-
Denise Campbell: none
-
David W Mudge has received consultancy fees, speakers' honoraria and travel assistance from Baxter Healthcare for activities unrelated to this review
-
Jonathan C Craig: none
-
David W Johnson has received consultancy fees, speakers' honoraria, travel sponsorships and research funding from Fresenius Medical Care and Baxter Healthcare for activities unrelated to this review
-
Allison Tong: none
-
Giovanni FM Strippoli: none
Acknowledgements
2004 review
We acknowledge the contribution of Drs Peter Wilson, Ignatius Fong, Gerald Coles and Cliff Holmes of the Mupirocin Study Group, David Churchill and Judy Bernardini, who responded to our queries about their studies. We are indebted to Dr R Russo and Dr R Curciulo of the University of Bari, Italy, who commented on the original project and provided useful background information. Particular thanks to Dr Paolo Strippoli, Head of the Nephrology Unit of Ospedale "A. Perrino", Brindisi, Italy, for his intellectual input in this manuscript with comments on the original project and final manuscript and providing abundant background information and advice. We acknowledge the contribution of Narelle Willis, Coordinator of the Cochrane Renal Group, who coordinated our activities throughout the project and edited the latest draft of this review.
2017 review
We would like to thank Drs Chu, Danguilan, Johnson, Jassal, Ayliffe and Selgas for their responses to our queries about their studies.
We would like to thank Dr E Hodson for her comments and feedback during the preparation of this updated review.
Version history
| Published | Title | Stage | Authors | Version |
| 2017 Apr 08 | Antimicrobial agents for preventing peritonitis in peritoneal dialysis patients | Review | Denise Campbell, David W Mudge, Jonathan C Craig, David W Johnson, Allison Tong, Giovanni FM Strippoli | |
| 2004 Oct 18 | Antimicrobial agents for preventing peritonitis in peritoneal dialysis patients | Review | Giovanni FM Strippoli, Allison Tong, David W Johnson, Francesco Paolo Schena, Jonathan C Craig | |
| 2003 Oct 20 | Anti‐infective (antiseptics and antibiotics) agents for preventing peritonitis in peritoneal dialysis patients | Protocol | Giovanni FM Strippoli, Allison Tong, David Johnson, Francesco Paolo Schena, Jonathan C Craig | |
Differences between protocol and review
-
The risk of bias assessment tool has replaced the quality assessment checklist used in the original review
-
Summary of findings tables have been incorporated into this update
Keywords
MeSH
Medical Subject Headings (MeSH) Keywords
- *Antibiotic Prophylaxis;
- Administration, Intranasal;
- Administration, Topical;
- Anti‐Bacterial Agents [administration & dosage, *therapeutic use];
- Anti‐Infective Agents, Local [administration & dosage, therapeutic use];
- Antifungal Agents [administration & dosage, therapeutic use];
- Catheter‐Related Infections [epidemiology, *prevention & control];
- Device Removal [adverse effects];
- Injections, Intravenous;
- Mupirocin [administration & dosage, therapeutic use];
- Mycoses [prevention & control];
- Peritoneal Dialysis [*adverse effects];
- Peritonitis [epidemiology, *prevention & control];
- Randomized Controlled Trials as Topic;
- Vancomycin [administration & dosage, therapeutic use];
Medical Subject Headings Check Words
Humans;
PICOs


Risk of bias graph: review authors' judgements about each risk of bias item presented as percentages across all included studies.

Risk of bias summary: review authors' judgements about each risk of bias item for each included study.

Comparison 1 Oral or topical antibiotics versus placebo/no treatment, Outcome 1 Peritonitis (number of patients with one or more episodes).
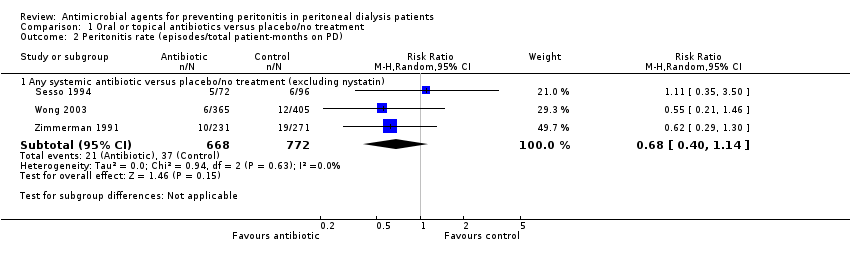
Comparison 1 Oral or topical antibiotics versus placebo/no treatment, Outcome 2 Peritonitis rate (episodes/total patient‐months on PD).

Comparison 1 Oral or topical antibiotics versus placebo/no treatment, Outcome 3 Exit‐site/tunnel infection (number of patients with one or more episodes).

Comparison 1 Oral or topical antibiotics versus placebo/no treatment, Outcome 4 Exit‐site/tunnel infection rate (episodes/total patient‐months on PD).

Comparison 1 Oral or topical antibiotics versus placebo/no treatment, Outcome 5 Catheter removal or replacement (number of patients).
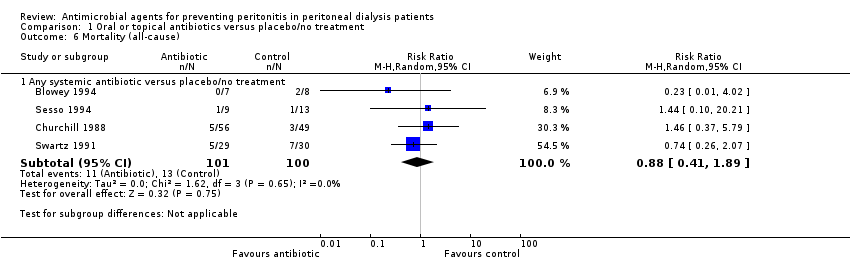
Comparison 1 Oral or topical antibiotics versus placebo/no treatment, Outcome 6 Mortality (all‐cause).
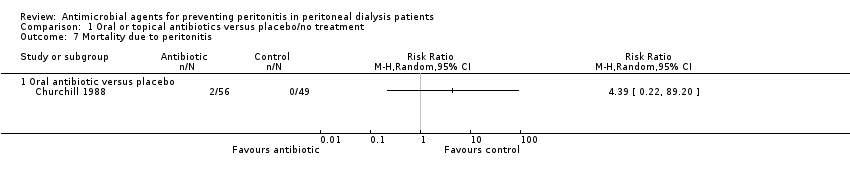
Comparison 1 Oral or topical antibiotics versus placebo/no treatment, Outcome 7 Mortality due to peritonitis.
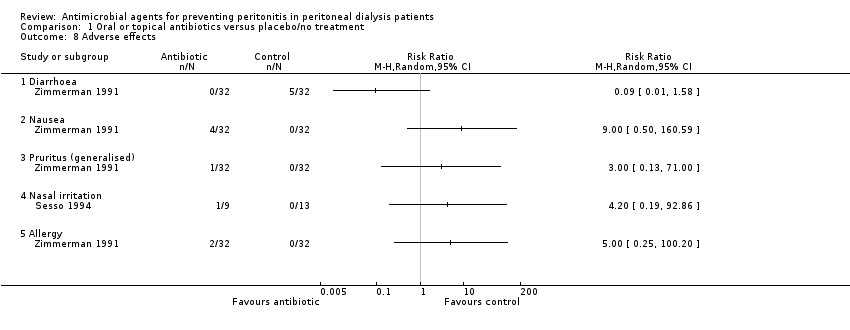
Comparison 1 Oral or topical antibiotics versus placebo/no treatment, Outcome 8 Adverse effects.

Comparison 2 Oral or topical antibiotics versus other antibiotic, Outcome 1 Peritonitis (number of patients with one or more episodes).

Comparison 2 Oral or topical antibiotics versus other antibiotic, Outcome 2 Peritonitis rate (episodes/total patient‐months on PD).

Comparison 2 Oral or topical antibiotics versus other antibiotic, Outcome 3 Exit‐site/tunnel infection (number of patients with one or more episodes).
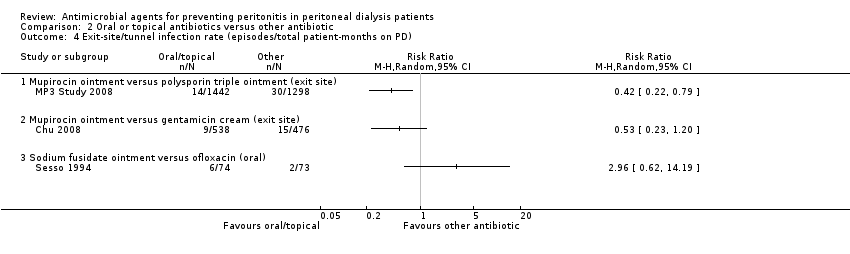
Comparison 2 Oral or topical antibiotics versus other antibiotic, Outcome 4 Exit‐site/tunnel infection rate (episodes/total patient‐months on PD).

Comparison 2 Oral or topical antibiotics versus other antibiotic, Outcome 5 Catheter removal or replacement (number of patients).

Comparison 2 Oral or topical antibiotics versus other antibiotic, Outcome 6 Mortality (all‐cause).
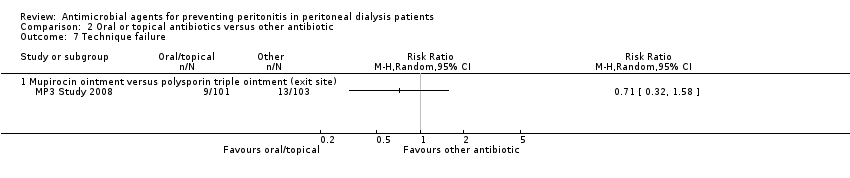
Comparison 2 Oral or topical antibiotics versus other antibiotic, Outcome 7 Technique failure.

Comparison 2 Oral or topical antibiotics versus other antibiotic, Outcome 8 Adverse effects.

Comparison 3 Nasal antibiotics versus placebo/no treatment, Outcome 1 Peritonitis (number of patients with one or more episodes).

Comparison 3 Nasal antibiotics versus placebo/no treatment, Outcome 2 Peritonitis rate (episodes/total patient‐months on PD).
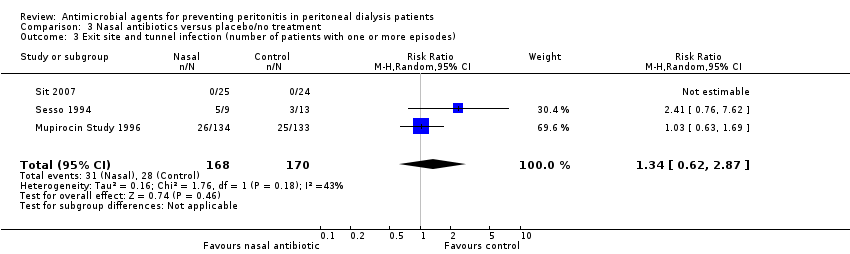
Comparison 3 Nasal antibiotics versus placebo/no treatment, Outcome 3 Exit site and tunnel infection (number of patients with one or more episodes).

Comparison 3 Nasal antibiotics versus placebo/no treatment, Outcome 4 Exit site and tunnel infection rate (episodes/total patient‐months on PD).

Comparison 3 Nasal antibiotics versus placebo/no treatment, Outcome 5 Catheter removal or replacement (number of patients).
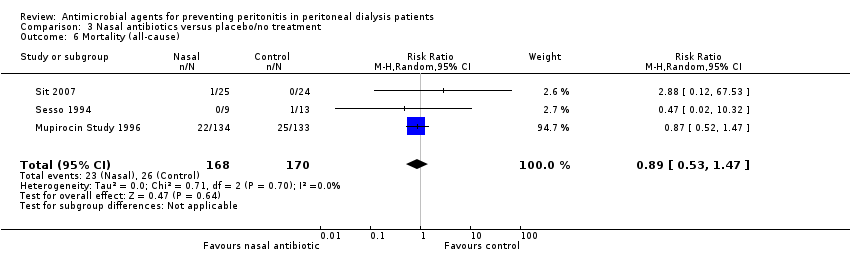
Comparison 3 Nasal antibiotics versus placebo/no treatment, Outcome 6 Mortality (all‐cause).
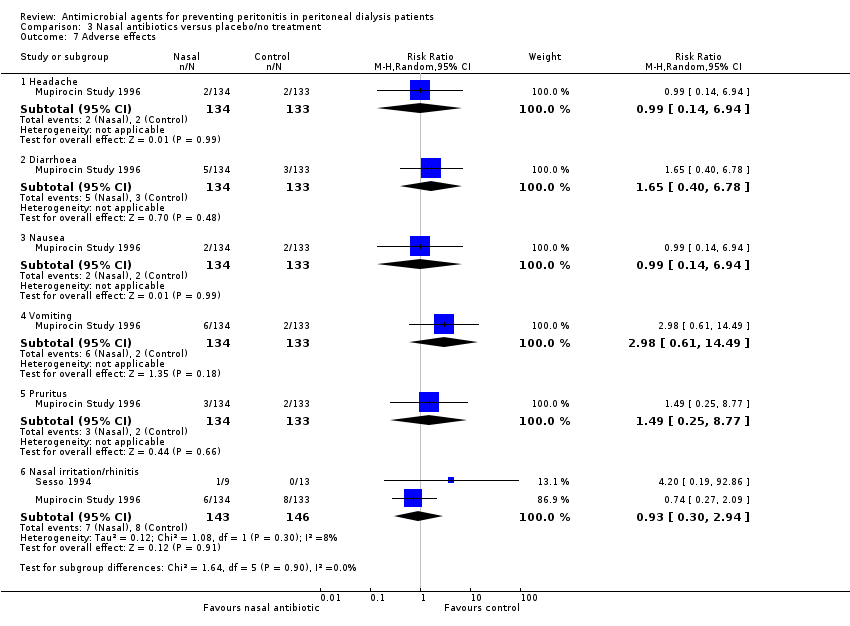
Comparison 3 Nasal antibiotics versus placebo/no treatment, Outcome 7 Adverse effects.

Comparison 4 Pre/peri‐operative prophylaxis versus placebo/no treatment or other antibiotic, Outcome 1 Peritonitis (number of patients with one or more episodes).

Comparison 4 Pre/peri‐operative prophylaxis versus placebo/no treatment or other antibiotic, Outcome 2 Exit site/tunnel infection (number of patients with one or more episodes).

Comparison 4 Pre/peri‐operative prophylaxis versus placebo/no treatment or other antibiotic, Outcome 3 Catheter removal or replacement (number of patients).

Comparison 4 Pre/peri‐operative prophylaxis versus placebo/no treatment or other antibiotic, Outcome 4 Mortality (all‐cause).
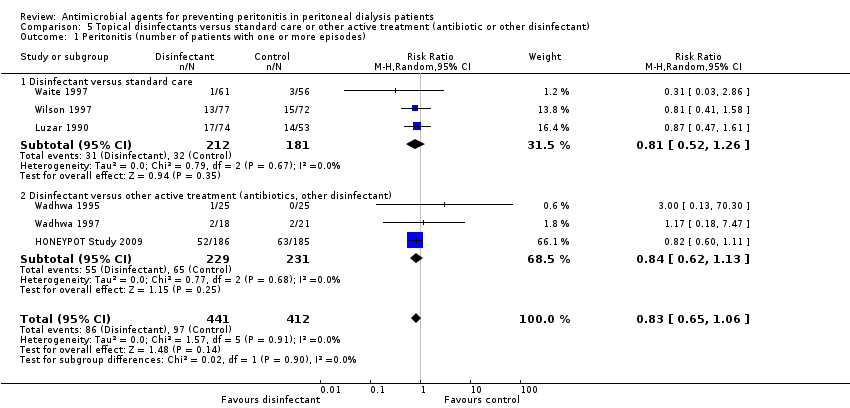
Comparison 5 Topical disinfectants versus standard care or other active treatment (antibiotic or other disinfectant), Outcome 1 Peritonitis (number of patients with one or more episodes).

Comparison 5 Topical disinfectants versus standard care or other active treatment (antibiotic or other disinfectant), Outcome 2 Exit site/tunnel infection (number of patients with one or more episodes).
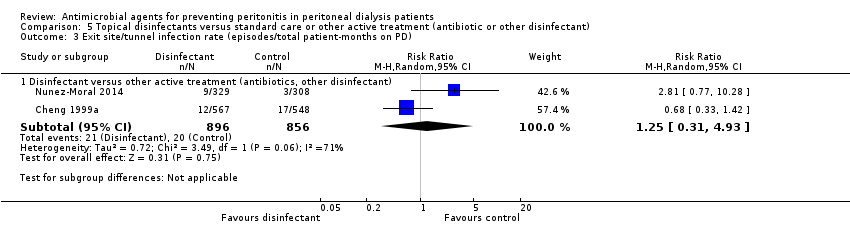
Comparison 5 Topical disinfectants versus standard care or other active treatment (antibiotic or other disinfectant), Outcome 3 Exit site/tunnel infection rate (episodes/total patient‐months on PD).

Comparison 5 Topical disinfectants versus standard care or other active treatment (antibiotic or other disinfectant), Outcome 4 Catheter removal or replacement (number of patients).
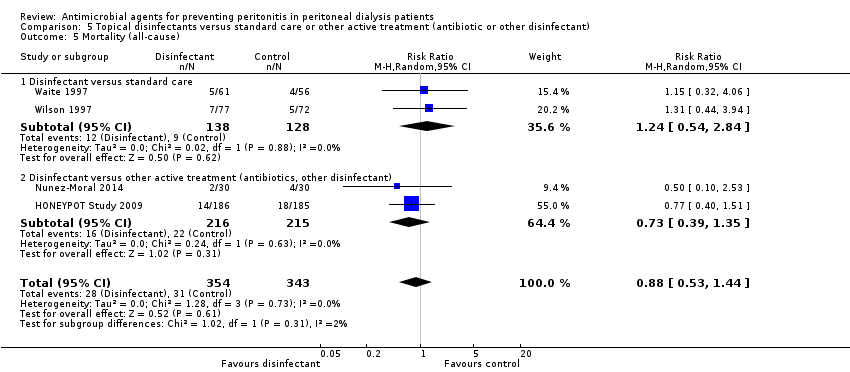
Comparison 5 Topical disinfectants versus standard care or other active treatment (antibiotic or other disinfectant), Outcome 5 Mortality (all‐cause).
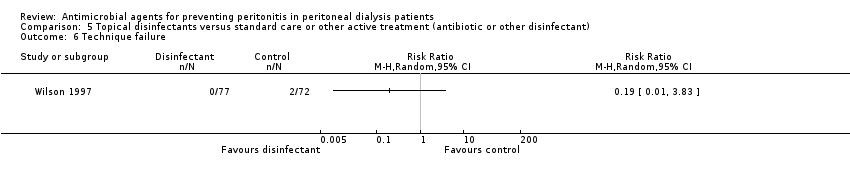
Comparison 5 Topical disinfectants versus standard care or other active treatment (antibiotic or other disinfectant), Outcome 6 Technique failure.

Comparison 5 Topical disinfectants versus standard care or other active treatment (antibiotic or other disinfectant), Outcome 7 Pruritus (local).

Comparison 6 Germicidal chamber versus none, Outcome 1 Peritonitis rate (episodes/total patient‐months on PD).
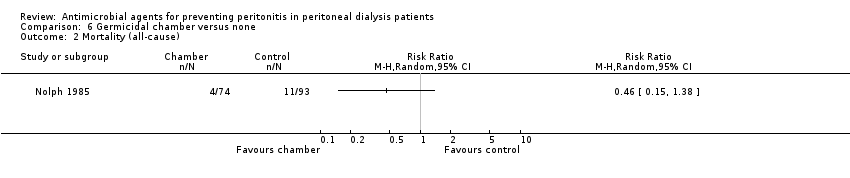
Comparison 6 Germicidal chamber versus none, Outcome 2 Mortality (all‐cause).
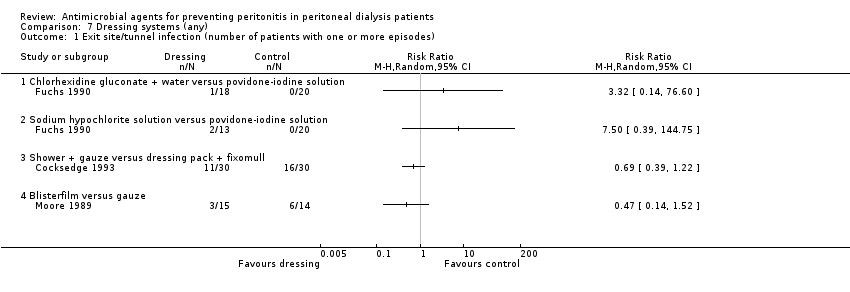
Comparison 7 Dressing systems (any), Outcome 1 Exit site/tunnel infection (number of patients with one or more episodes).

Comparison 7 Dressing systems (any), Outcome 2 Exit site/tunnel infection rate (episodes/total patient‐months on PD).

Comparison 8 Silver ring system on catheter versus none, Outcome 1 Peritonitis (number of patients with one or more episodes).

Comparison 8 Silver ring system on catheter versus none, Outcome 2 Exit site/tunnel infection (number of patients with one or more episodes).

Comparison 8 Silver ring system on catheter versus none, Outcome 3 Catheter removal or replacement (number of patients).
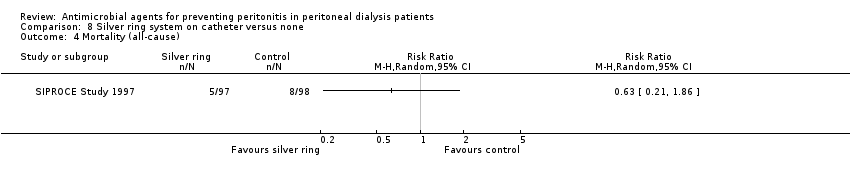
Comparison 8 Silver ring system on catheter versus none, Outcome 4 Mortality (all‐cause).

Comparison 9 Antistaphylococcal vaccine (Staphypan) versus placebo, Outcome 1 Peritonitis rate (episodes/total patient‐months on PD).
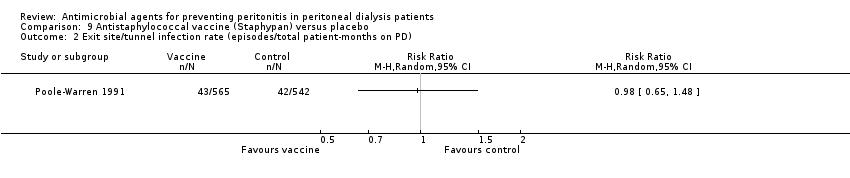
Comparison 9 Antistaphylococcal vaccine (Staphypan) versus placebo, Outcome 2 Exit site/tunnel infection rate (episodes/total patient‐months on PD).

Comparison 10 Antifungal versus placebo/no treatment, Outcome 1 Fungal peritonitis (number of patients with one or more episodes).

Comparison 10 Antifungal versus placebo/no treatment, Outcome 2 Fungal peritonitis rate (episodes/total patient‐months on PD).
| Oral or topical or intraperitoneal antibiotics versus placebo/no treatment for preventing peritonitis in peritoneal dialysis patients | ||||||
| Patient or population: patients with CKD on peritoneal dialysis | ||||||
| Outcomes | Illustrative comparative risks* (95% CI) | Relative effect | No of participants | Quality of the evidence | Comments | |
| Assumed risk | Corresponding risk | |||||
| Control | Oral or topical or intraperitoneal antibiotics versus placebo/no treatment | |||||
| Peritonitis (number of patients with one or more episodes) | Study population | RR 0.82 | 395 (5) | ⊕⊕⊝⊝ | ||
| 360 per 1000 | 295 per 1000 | |||||
| Moderate | ||||||
| 385 per 1000 | 316 per 1000 | |||||
| Exit‐site/tunnel infection (number of patients with one or more episodes) | Study population | RR 0.45 | 191 (3) | ⊕⊕⊝⊝ | ||
| 176 per 1000 | 79 per 1000 | |||||
| Moderate | ||||||
| 231 per 1000 | 104 per 1000 | |||||
| Catheter removal or replacement (number of patients) | Study population | RR 0.82 | 395 (5) | ⊕⊕⊝⊝ | ||
| 115 per 1000 | 94 per 1000 | |||||
| Moderate | ||||||
| 156 per 1000 | 128 per 1000 | |||||
| *The basis for the assumed risk (e.g. the median control group risk across studies) is provided in footnotes. The corresponding risk (and its 95% confidence interval) is based on the assumed risk in the comparison group and the relative effect of the intervention (and its 95% CI). | ||||||
| GRADE Working Group grades of evidence | ||||||
| 1 Unclear or high risk of bias in 3 of 5 studies Abbreviations: CKD ‐ chronic kidney disease; GRADE ‐ Grading of Recommendations Assessment, Development and Evaluation | ||||||
| Nasal antibiotics versus no treatment for preventing peritonitis in peritoneal dialysis patients | ||||||
| Patient or population: patients with CKD on peritoneal dialysis | ||||||
| Outcomes | Illustrative comparative risks* (95% CI) | Relative effect | No. of participants | Quality of the evidence | Comments | |
| Assumed risk | Corresponding risk | |||||
| Control | Nasal antibiotics versus placebo/no treatment | |||||
| Peritonitis (number of patients with one or more episodes) | Study population | RR 0.94 | 338 (3) | ⊕⊕⊝⊝ | ||
| 294 per 1000 | 276 per 1000 | |||||
| Moderate | ||||||
| 331 per 1000 | 311 per 1000 | |||||
| Exit‐site/ tunnel infection (number of patients with one or more episodes) | Study population | RR 1.34 | 338 (3) | ⊕⊕⊝⊝ | ||
| 165 per 1000 | 221 per 1000 | |||||
| Moderate | ||||||
| 188 per 1000 | 252 per 1000 | |||||
| Catheter removal or replacement (number of patients) | Study population | RR 0.92 | 289 (2) | ⊕⊕⊝⊝ | ||
| 103 per 1000 | 95 per 1000 | |||||
| Moderate | ||||||
| 265 per 1000 | 244 per 1000 | |||||
| *The basis for the assumed risk (e.g. the median control group risk across studies) is provided in footnotes. The corresponding risk (and its 95% confidence interval) is based on the assumed risk in the comparison group and the relative effect of the intervention (and its 95% CI). CI: Confidence interval; RR: Risk ratio | ||||||
| GRADE Working Group grades of evidence | ||||||
| ¹ Unclear risk of bias for allocation concealment in largest study (Mupirocin Study 1996) Abbreviations: CKD ‐ chronic kidney disease; GRADE ‐ Grading of Recommendations Assessment, Development and Evaluation | ||||||
| Topical disinfectants versus standard care or other active treatment (antibiotic or other disinfectant) for preventing peritonitis in peritoneal dialysis patients | ||||||
| Patient or population: patients with CKD on peritoneal dialysis | ||||||
| Outcomes | Illustrative comparative risks* (95% CI) | Relative effect | No. of participants | Quality of the evidence | Comments | |
| Assumed risk | Corresponding risk | |||||
| Control | Topical disinfectants versus standard care or other active treatment (antibiotic or other disinfectant) | |||||
| Peritonitis (number of patients with one or more episodes) | Study population | RR 0.83 | 853 (6) | ⊕⊕⊝⊝ | ||
| 235 per 1000 | 195 per 1000 | |||||
| Moderate | ||||||
| 152 per 1000 | 126 per 1000 | |||||
| Exit‐site/tunnel infection (number of patients with one or more episodes) | Study population | RR 0.97 | 913 (7) | ⊕⊕⊝⊝ | ||
| 238 per 1000 | 230 per 1000 | |||||
| Moderate | ||||||
| 222 per 1000 | 215 per 1000 | |||||
| Catheter removal or replacement (number of patients) | Study population | RR 0.89 | 792 (6) | ⊕⊕⊝⊝ | ||
| 97 per 1000 | 86 per 1000 | |||||
| Moderate | ||||||
| 93 per 1000 | 83 per 1000 | |||||
| *The basis for the assumed risk (e.g. the median control group risk across studies) is provided in footnotes. The corresponding risk (and its 95% confidence interval) is based on the assumed risk in the comparison group and the relative effect of the intervention (and its 95% CI). | ||||||
| GRADE Working Group grades of evidence | ||||||
| 1 Unclear allocation in several studies Abbreviations: CKD ‐ chronic kidney disease; GRADE ‐ Grading of Recommendations Assessment, Development and Evaluation | ||||||
| Antifungal versus placebo/no treatment for preventing fungal peritonitis in peritoneal dialysis patients | ||||||
| Patient or population: patients with CKD on peritoneal dialysis | ||||||
| Outcomes | Illustrative comparative risks* (95% CI) | Relative effect | No. of participants | Quality of the evidence | Comments | |
| Assumed risk | Corresponding risk | |||||
| Control | Antifungal versus placebo/no treatment | |||||
| Fungal peritonitis (number of patients with one or more episodes) | Study population | RR 0.28 | 817 (2) | ⊕⊕⊝⊝ | ||
| 64 per 1000 | 18 per 1000 | |||||
| Moderate | ||||||
| 64 per 1000 | 18 per 1000 | |||||
| *The basis for the assumed risk (e.g. the median control group risk across studies) is provided in footnotes. The corresponding risk (and its 95% confidence interval) is based on the assumed risk in the comparison group and the relative effect of the intervention (and its 95% CI). | ||||||
| GRADE Working Group grades of evidence | ||||||
| 1 High risk of bias in one study (Lo 1996) Abbreviations: CKD ‐ chronic kidney disease; GRADE ‐ Grading of Recommendations Assessment, Development and Evaluation | ||||||
| Guideline | Country | Year | Recommendation |
| Kidney‐Disease Outcomes Quality Initiative | United States of America | NA | No guideline |
| The Renal Association | United Kingdom | April 2008 July 2010 | Guideline 3.1 ‐ PD Access: Implantation Protocol
Guideline 5.1.4 ‐ PD Infectious Complications: Prevention Strategies
Guideline 5.1.5 ‐ PD Infectious Complications: Prevention Strategies
Guideline 5.1.6 ‐ PD Infectious Complications: Prevention Strategies
|
| Canadian Society of Nephrology | Canada | NA | No guideline |
| European Renal Best Practice | Europe | NA | No guideline |
| International Society for Peritoneal Dialysis | NA | July 2010 November 2011 | Guideline 3.1: Implantation Protocol (1A)
Position Statement: Catheter Placement to Prevent Catheter Infections and the Related Peritonitis Episodes
Position Statement: Exit‐Site Care to Prevent Peritonitis
Position Statement: Prevention of Fungal Peritonitis
|
| Kidney Health Australia‐Caring for Australasians with Renal Impairment | Australia/ New Zealand | February 2014 | Guideline 6. Prophylactic Antibiotics for Insertion of PD Catheters
Guideline 8. Treatment of Peritoneal Dialysis‐Associated Fungal Peritonitis
Guideline 10. Prophylaxis for Exit‐site/Tunnel Infections Using Mupirocin
|
| MRSA ‐ methicillin‐resistant S. aureus; NA ‐ not applicable; PD ‐ peritoneal dialysis | |||
| Comparisons in 2004 review | Comparisons in 2017 review |
| Oral antibiotics versus none | Oral or topical antibiotics versus placebo/no treatment |
| Nasal antibiotics versus none | Oral or topical antibiotics versus other antibiotic |
| Peri‐operative IV prophylaxis versus none | Nasal antibiotics versus no treatment |
| Peri‐operative IV prophylaxis head‐to‐head | Pre/peri‐operative IV prophylaxis versus none or head‐to‐head |
| Topical disinfectants versus none | Topical disinfectants versus standard care or other active treatment (antibiotic or other disinfectant) |
| Germicidal chamber versus none | Germicidal chamber versus none |
| Antistaphylococcal vaccine (Staphypan) versus placebo | Dressing systems (any) |
| Antibiotic prophylaxis head‐to‐head agents | Silver ring system on catheter versus none |
| ‐‐ | Antistaphylococcal vaccine (Staphypan) versus placebo |
| ‐‐ | Antifungal versus placebo/no treatment |
| Outcome analysed | Number of studies | Number of patients | RR (95% CI) |
| Oral antibiotic prophylaxis | |||
| Pruritus | 1 | 64 | 3.00 (0.13 to 71.00) |
| Diarrhoea | 1 | 64 | 0.09 (0.01 to 1.58) |
| Nausea | 1 | 64 | 9.00 (0.50 to 160.59) |
| Allergy | 1 | 64 | 5.00 (0.25 to 100.20) |
| Nasal antibiotic prophylaxis | |||
| Nasal irritation | 1 | 15 | 2.10 (0.10 to 44.40) |
| Rhinitis | 1 | 267 | 0.74 (0.27 to 2.09) |
| Headache | 1 | 267 | 0.99 (0.14 to 6.94) |
| Diarrhoea | 1 | 267 | 1.65 (0.40 to 6.78) |
| Nausea | 1 | 267 | 0.99 (0.14 to 6.94) |
| Vomiting | 1 | 267 | 2.98 (0.61 to 14.94) |
| Pruritus | 1 | 267 | 1.49 (0.25 to 8.77) |
| Topical disinfectants | |||
| Technique failure | 1 | 149 | 0.19 (0.01 to 3.83) |
| Pruritus | 1 | 149 | 10.29 (0.58 to 182.92) |
| Outcome or subgroup title | No. of studies | No. of participants | Statistical method | Effect size |
| 1 Peritonitis (number of patients with one or more episodes) Show forest plot | 5 | 395 | Risk Ratio (M‐H, Random, 95% CI) | 0.82 [0.57, 1.19] |
| 1.1 Oral antibiotic versus placebo | 4 | 241 | Risk Ratio (M‐H, Random, 95% CI) | 0.87 [0.58, 1.32] |
| 1.2 Mupirocin ointment versus standard care | 1 | 154 | Risk Ratio (M‐H, Random, 95% CI) | 0.55 [0.22, 1.40] |
| 2 Peritonitis rate (episodes/total patient‐months on PD) Show forest plot | 3 | Risk Ratio (M‐H, Random, 95% CI) | Subtotals only | |
| 2.1 Any systemic antibiotic versus placebo/no treatment (excluding nystatin) | 3 | 1440 | Risk Ratio (M‐H, Random, 95% CI) | 0.68 [0.40, 1.14] |
| 3 Exit‐site/tunnel infection (number of patients with one or more episodes) Show forest plot | 3 | Risk Ratio (M‐H, Random, 95% CI) | Subtotals only | |
| 3.1 Any systemic antibiotic versus placebo/no treatment | 3 | 191 | Risk Ratio (M‐H, Random, 95% CI) | 0.45 [0.19, 1.04] |
| 4 Exit‐site/tunnel infection rate (episodes/total patient‐months on PD) Show forest plot | 2 | Risk Ratio (M‐H, Random, 95% CI) | Subtotals only | |
| 4.1 Any systemic antibiotic versus placebo/no treatment | 2 | 939 | Risk Ratio (M‐H, Random, 95% CI) | 0.42 [0.17, 1.05] |
| 5 Catheter removal or replacement (number of patients) Show forest plot | 5 | Risk Ratio (M‐H, Random, 95% CI) | Subtotals only | |
| 5.1 Any systemic antibiotic versus placebo/no treatment | 5 | 395 | Risk Ratio (M‐H, Random, 95% CI) | 0.82 [0.46, 1.46] |
| 6 Mortality (all‐cause) Show forest plot | 4 | Risk Ratio (M‐H, Random, 95% CI) | Subtotals only | |
| 6.1 Any systemic antibiotic versus placebo/no treatment | 4 | 201 | Risk Ratio (M‐H, Random, 95% CI) | 0.88 [0.41, 1.89] |
| 7 Mortality due to peritonitis Show forest plot | 1 | Risk Ratio (M‐H, Random, 95% CI) | Totals not selected | |
| 7.1 Oral antibiotic versus placebo | 1 | Risk Ratio (M‐H, Random, 95% CI) | 0.0 [0.0, 0.0] | |
| 8 Adverse effects Show forest plot | 2 | Risk Ratio (M‐H, Random, 95% CI) | Totals not selected | |
| 8.1 Diarrhoea | 1 | Risk Ratio (M‐H, Random, 95% CI) | 0.0 [0.0, 0.0] | |
| 8.2 Nausea | 1 | Risk Ratio (M‐H, Random, 95% CI) | 0.0 [0.0, 0.0] | |
| 8.3 Pruritus (generalised) | 1 | Risk Ratio (M‐H, Random, 95% CI) | 0.0 [0.0, 0.0] | |
| 8.4 Nasal irritation | 1 | Risk Ratio (M‐H, Random, 95% CI) | 0.0 [0.0, 0.0] | |
| 8.5 Allergy | 1 | Risk Ratio (M‐H, Random, 95% CI) | 0.0 [0.0, 0.0] | |
| Outcome or subgroup title | No. of studies | No. of participants | Statistical method | Effect size |
| 1 Peritonitis (number of patients with one or more episodes) Show forest plot | 4 | 314 | Risk Ratio (M‐H, Random, 95% CI) | 1.28 [0.89, 1.84] |
| 1.1 Sodium fusidate ointment versus ofloxacin (oral) | 1 | 18 | Risk Ratio (M‐H, Random, 95% CI) | 0.25 [0.03, 1.82] |
| 1.2 Mupirocin ointment versus rifampin (oral) | 1 | 82 | Risk Ratio (M‐H, Random, 95% CI) | 1.25 [0.67, 2.33] |
| 1.3 Mupirocin ointment/cream versus gentamicin cream (topical) | 2 | 214 | Risk Ratio (M‐H, Random, 95% CI) | 1.39 [0.93, 2.07] |
| 2 Peritonitis rate (episodes/total patient‐months on PD) Show forest plot | 5 | Risk Ratio (M‐H, Random, 95% CI) | Totals not selected | |
| 2.1 Mupirocin ointment versus polysporin triple ointment (exit site) | 1 | Risk Ratio (M‐H, Random, 95% CI) | 0.0 [0.0, 0.0] | |
| 2.2 Sodium fusidate ointment versus ofloxacin (oral) | 1 | Risk Ratio (M‐H, Random, 95% CI) | 0.0 [0.0, 0.0] | |
| 2.3 Mupirocin ointment versus neomycin sulphate ointment (nasal) | 1 | Risk Ratio (M‐H, Random, 95% CI) | 0.0 [0.0, 0.0] | |
| 2.4 Mupirocin ointment versus rifampin (oral) | 1 | Risk Ratio (M‐H, Random, 95% CI) | 0.0 [0.0, 0.0] | |
| 2.5 Mupirocin ointment versus gentamicin cream (exit site) | 1 | Risk Ratio (M‐H, Random, 95% CI) | 0.0 [0.0, 0.0] | |
| 3 Exit‐site/tunnel infection (number of patients with one or more episodes) Show forest plot | 4 | 336 | Risk Ratio (M‐H, Random, 95% CI) | 1.28 [0.71, 2.31] |
| 3.1 Mupirocin ointment versus sodium fusidate ointment (topical) | 1 | 100 | Risk Ratio (M‐H, Random, 95% CI) | 0.91 [0.42, 1.95] |
| 3.2 Sodium fusidate ointment versus ofloxacin (oral) | 1 | 22 | Risk Ratio (M‐H, Random, 95% CI) | 2.41 [0.76, 7.62] |
| 3.3 Mupirocin ointment/cream versus gentamicin cream (topical) | 2 | 214 | Risk Ratio (M‐H, Random, 95% CI) | 1.19 [0.41, 3.46] |
| 4 Exit‐site/tunnel infection rate (episodes/total patient‐months on PD) Show forest plot | 3 | Risk Ratio (M‐H, Random, 95% CI) | Totals not selected | |
| 4.1 Mupirocin ointment versus polysporin triple ointment (exit site) | 1 | Risk Ratio (M‐H, Random, 95% CI) | 0.0 [0.0, 0.0] | |
| 4.2 Mupirocin ointment versus gentamicin cream (exit site) | 1 | Risk Ratio (M‐H, Random, 95% CI) | 0.0 [0.0, 0.0] | |
| 4.3 Sodium fusidate ointment versus ofloxacin (oral) | 1 | Risk Ratio (M‐H, Random, 95% CI) | 0.0 [0.0, 0.0] | |
| 5 Catheter removal or replacement (number of patients) Show forest plot | 4 | Risk Ratio (M‐H, Random, 95% CI) | Totals not selected | |
| 5.1 Mupirocin ointment versus polysporin triple ointment (exit site) | 1 | Risk Ratio (M‐H, Random, 95% CI) | 0.0 [0.0, 0.0] | |
| 5.2 Sodium fusidate ointment versus ofloxacin (oral) | 1 | Risk Ratio (M‐H, Random, 95% CI) | 0.0 [0.0, 0.0] | |
| 5.3 Mupirocin ointment (exit site) versus rifampin (oral) | 1 | Risk Ratio (M‐H, Random, 95% CI) | 0.0 [0.0, 0.0] | |
| 5.4 Mupirocin cream versus gentamicin cream (exit site) | 1 | Risk Ratio (M‐H, Random, 95% CI) | 0.0 [0.0, 0.0] | |
| 6 Mortality (all‐cause) Show forest plot | 4 | Risk Ratio (M‐H, Random, 95% CI) | Totals not selected | |
| 6.1 Mupirocin ointment versus polysporin triple ointment (exit site) | 1 | Risk Ratio (M‐H, Random, 95% CI) | 0.0 [0.0, 0.0] | |
| 6.2 Sodium fusidate ointment versus ofloxacin (oral) | 1 | Risk Ratio (M‐H, Random, 95% CI) | 0.0 [0.0, 0.0] | |
| 6.3 Mupirocin ointment versus rifampin (oral) | 1 | Risk Ratio (M‐H, Random, 95% CI) | 0.0 [0.0, 0.0] | |
| 6.4 Mupirocin ointment versus gentamicin cream (exit site) | 1 | Risk Ratio (M‐H, Random, 95% CI) | 0.0 [0.0, 0.0] | |
| 7 Technique failure Show forest plot | 1 | Risk Ratio (M‐H, Random, 95% CI) | Totals not selected | |
| 7.1 Mupirocin ointment versus polysporin triple ointment (exit site) | 1 | Risk Ratio (M‐H, Random, 95% CI) | 0.0 [0.0, 0.0] | |
| 8 Adverse effects Show forest plot | 3 | Risk Ratio (M‐H, Random, 95% CI) | Subtotals only | |
| 8.1 Nausea | 1 | 82 | Risk Ratio (M‐H, Random, 95% CI) | 0.09 [0.01, 1.59] |
| 8.2 Pruritus (local) | 2 | 337 | Risk Ratio (M‐H, Random, 95% CI) | 0.65 [0.29, 1.49] |
| Outcome or subgroup title | No. of studies | No. of participants | Statistical method | Effect size |
| 1 Peritonitis (number of patients with one or more episodes) Show forest plot | 3 | 338 | Risk Ratio (M‐H, Random, 95% CI) | 0.94 [0.67, 1.31] |
| 2 Peritonitis rate (episodes/total patient‐months on PD) Show forest plot | 2 | 2797 | Risk Ratio (M‐H, Random, 95% CI) | 0.67 [0.16, 2.77] |
| 3 Exit site and tunnel infection (number of patients with one or more episodes) Show forest plot | 3 | 338 | Risk Ratio (M‐H, Random, 95% CI) | 1.34 [0.62, 2.87] |
| 4 Exit site and tunnel infection rate (episodes/total patient‐months on PD) Show forest plot | 2 | 2796 | Risk Ratio (M‐H, Random, 95% CI) | 0.91 [0.29, 2.92] |
| 5 Catheter removal or replacement (number of patients) Show forest plot | 2 | 289 | Risk Ratio (M‐H, Random, 95% CI) | 0.92 [0.48, 1.78] |
| 6 Mortality (all‐cause) Show forest plot | 3 | 338 | Risk Ratio (M‐H, Random, 95% CI) | 0.89 [0.53, 1.47] |
| 7 Adverse effects Show forest plot | 2 | Risk Ratio (M‐H, Random, 95% CI) | Subtotals only | |
| 7.1 Headache | 1 | 267 | Risk Ratio (M‐H, Random, 95% CI) | 0.99 [0.14, 6.94] |
| 7.2 Diarrhoea | 1 | 267 | Risk Ratio (M‐H, Random, 95% CI) | 1.65 [0.40, 6.78] |
| 7.3 Nausea | 1 | 267 | Risk Ratio (M‐H, Random, 95% CI) | 0.99 [0.14, 6.94] |
| 7.4 Vomiting | 1 | 267 | Risk Ratio (M‐H, Random, 95% CI) | 2.98 [0.61, 14.49] |
| 7.5 Pruritus | 1 | 267 | Risk Ratio (M‐H, Random, 95% CI) | 1.49 [0.25, 8.77] |
| 7.6 Nasal irritation/rhinitis | 2 | 289 | Risk Ratio (M‐H, Random, 95% CI) | 0.93 [0.30, 2.94] |
| Outcome or subgroup title | No. of studies | No. of participants | Statistical method | Effect size |
| 1 Peritonitis (number of patients with one or more episodes) Show forest plot | 4 | Risk Ratio (M‐H, Random, 95% CI) | Totals not selected | |
| 1.1 Vancomycin versus placebo | 1 | Risk Ratio (M‐H, Random, 95% CI) | 0.0 [0.0, 0.0] | |
| 1.2 Cefazolin versus placebo | 1 | Risk Ratio (M‐H, Random, 95% CI) | 0.0 [0.0, 0.0] | |
| 1.3 IV gentamicin versus no antibiotics | 1 | Risk Ratio (M‐H, Random, 95% CI) | 0.0 [0.0, 0.0] | |
| 1.4 IV cefazolin + gentamicin versus no antibiotics | 1 | Risk Ratio (M‐H, Random, 95% CI) | 0.0 [0.0, 0.0] | |
| 1.5 IV cefuroxime + cefuroxime (intraperitoneal) versus no antibiotics | 1 | Risk Ratio (M‐H, Random, 95% CI) | 0.0 [0.0, 0.0] | |
| 1.6 Vancomycin versus cefazolin | 1 | Risk Ratio (M‐H, Random, 95% CI) | 0.0 [0.0, 0.0] | |
| 2 Exit site/tunnel infection (number of patients with one or more episodes) Show forest plot | 4 | Risk Ratio (M‐H, Random, 95% CI) | Totals not selected | |
| 2.1 Vancomycin versus placebo | 1 | Risk Ratio (M‐H, Random, 95% CI) | 0.0 [0.0, 0.0] | |
| 2.2 Cefazolin versus placebo | 1 | Risk Ratio (M‐H, Random, 95% CI) | 0.0 [0.0, 0.0] | |
| 2.3 IV gentamicin versus no antibiotics | 1 | Risk Ratio (M‐H, Random, 95% CI) | 0.0 [0.0, 0.0] | |
| 2.4 IV cefazolin + gentamicin versus no antibiotics | 1 | Risk Ratio (M‐H, Random, 95% CI) | 0.0 [0.0, 0.0] | |
| 2.5 IV cefuroxime + cefuroxime (intraperitoneal) versus no antibiotics | 1 | Risk Ratio (M‐H, Random, 95% CI) | 0.0 [0.0, 0.0] | |
| 2.6 Vancomycin versus cefazolin | 1 | Risk Ratio (M‐H, Random, 95% CI) | 0.0 [0.0, 0.0] | |
| 3 Catheter removal or replacement (number of patients) Show forest plot | 1 | Risk Ratio (M‐H, Random, 95% CI) | Totals not selected | |
| 4 Mortality (all‐cause) Show forest plot | 1 | Risk Ratio (M‐H, Random, 95% CI) | Totals not selected | |
| Outcome or subgroup title | No. of studies | No. of participants | Statistical method | Effect size |
| 1 Peritonitis (number of patients with one or more episodes) Show forest plot | 6 | 853 | Risk Ratio (M‐H, Random, 95% CI) | 0.83 [0.65, 1.06] |
| 1.1 Disinfectant versus standard care | 3 | 393 | Risk Ratio (M‐H, Random, 95% CI) | 0.81 [0.52, 1.26] |
| 1.2 Disinfectant versus other active treatment (antibiotics, other disinfectant) | 3 | 460 | Risk Ratio (M‐H, Random, 95% CI) | 0.84 [0.62, 1.13] |
| 2 Exit site/tunnel infection (number of patients with one or more episodes) Show forest plot | 8 | 973 | Risk Ratio (M‐H, Random, 95% CI) | 1.00 [0.75, 1.33] |
| 2.1 Disinfectant versus standard care | 4 | 453 | Risk Ratio (M‐H, Random, 95% CI) | 0.74 [0.45, 1.20] |
| 2.2 Disinfectant versus other active treatment (antibiotics, other disinfectant) | 4 | 520 | Risk Ratio (M‐H, Random, 95% CI) | 1.19 [0.89, 1.60] |
| 3 Exit site/tunnel infection rate (episodes/total patient‐months on PD) Show forest plot | 2 | Risk Ratio (M‐H, Random, 95% CI) | Subtotals only | |
| 3.1 Disinfectant versus other active treatment (antibiotics, other disinfectant) | 2 | 1752 | Risk Ratio (M‐H, Random, 95% CI) | 1.25 [0.31, 4.93] |
| 4 Catheter removal or replacement (number of patients) Show forest plot | 7 | 852 | Risk Ratio (M‐H, Random, 95% CI) | 0.89 [0.57, 1.38] |
| 4.1 Disinfectant versus standard care | 2 | 266 | Risk Ratio (M‐H, Random, 95% CI) | 0.73 [0.34, 1.55] |
| 4.2 Disinfectant versus other active treatment (antibiotics, other disinfectant) | 5 | 586 | Risk Ratio (M‐H, Random, 95% CI) | 0.98 [0.57, 1.69] |
| 5 Mortality (all‐cause) Show forest plot | 4 | 697 | Risk Ratio (M‐H, Random, 95% CI) | 0.88 [0.53, 1.44] |
| 5.1 Disinfectant versus standard care | 2 | 266 | Risk Ratio (M‐H, Random, 95% CI) | 1.24 [0.54, 2.84] |
| 5.2 Disinfectant versus other active treatment (antibiotics, other disinfectant) | 2 | 431 | Risk Ratio (M‐H, Random, 95% CI) | 0.73 [0.39, 1.35] |
| 6 Technique failure Show forest plot | 1 | Risk Ratio (M‐H, Random, 95% CI) | Totals not selected | |
| 7 Pruritus (local) Show forest plot | 4 | 609 | Risk Ratio (M‐H, Random, 95% CI) | 2.80 [1.21, 6.48] |
| Outcome or subgroup title | No. of studies | No. of participants | Statistical method | Effect size |
| 1 Peritonitis rate (episodes/total patient‐months on PD) Show forest plot | 2 | 1855 | Risk Ratio (M‐H, Random, 95% CI) | 1.05 [0.74, 1.51] |
| 2 Mortality (all‐cause) Show forest plot | 1 | Risk Ratio (M‐H, Random, 95% CI) | Totals not selected | |
| Outcome or subgroup title | No. of studies | No. of participants | Statistical method | Effect size |
| 1 Exit site/tunnel infection (number of patients with one or more episodes) Show forest plot | 3 | Risk Ratio (M‐H, Random, 95% CI) | Totals not selected | |
| 1.1 Chlorhexidine gluconate + water versus povidone‐iodine solution | 1 | Risk Ratio (M‐H, Random, 95% CI) | 0.0 [0.0, 0.0] | |
| 1.2 Sodium hypochlorite solution versus povidone‐iodine solution | 1 | Risk Ratio (M‐H, Random, 95% CI) | 0.0 [0.0, 0.0] | |
| 1.3 Shower + gauze versus dressing pack + fixomull | 1 | Risk Ratio (M‐H, Random, 95% CI) | 0.0 [0.0, 0.0] | |
| 1.4 Blisterfilm versus gauze | 1 | Risk Ratio (M‐H, Random, 95% CI) | 0.0 [0.0, 0.0] | |
| 2 Exit site/tunnel infection rate (episodes/total patient‐months on PD) Show forest plot | 1 | Risk Ratio (M‐H, Random, 95% CI) | Totals not selected | |
| 2.1 Shower + gauze versus dressing pack + fixomull | 1 | Risk Ratio (M‐H, Random, 95% CI) | 0.0 [0.0, 0.0] | |
| Outcome or subgroup title | No. of studies | No. of participants | Statistical method | Effect size |
| 1 Peritonitis (number of patients with one or more episodes) Show forest plot | 1 | Risk Ratio (M‐H, Random, 95% CI) | Totals not selected | |
| 2 Exit site/tunnel infection (number of patients with one or more episodes) Show forest plot | 1 | Risk Ratio (M‐H, Random, 95% CI) | Totals not selected | |
| 3 Catheter removal or replacement (number of patients) Show forest plot | 1 | Risk Ratio (M‐H, Random, 95% CI) | Totals not selected | |
| 4 Mortality (all‐cause) Show forest plot | 1 | Risk Ratio (M‐H, Random, 95% CI) | Totals not selected | |
| Outcome or subgroup title | No. of studies | No. of participants | Statistical method | Effect size |
| 1 Peritonitis rate (episodes/total patient‐months on PD) Show forest plot | 1 | Risk Ratio (M‐H, Random, 95% CI) | Totals not selected | |
| 2 Exit site/tunnel infection rate (episodes/total patient‐months on PD) Show forest plot | 1 | Risk Ratio (M‐H, Random, 95% CI) | Totals not selected | |
| Outcome or subgroup title | No. of studies | No. of participants | Statistical method | Effect size |
| 1 Fungal peritonitis (number of patients with one or more episodes) Show forest plot | 2 | 817 | Risk Ratio (M‐H, Random, 95% CI) | 0.28 [0.12, 0.63] |
| 2 Fungal peritonitis rate (episodes/total patient‐months on PD) Show forest plot | 1 | Risk Ratio (M‐H, Random, 95% CI) | Totals not selected | |