Axillary treatment for operable primary breast cancer
Information
- DOI:
- https://doi.org/10.1002/14651858.CD004561.pub3Copy DOI

- Database:
-
- Cochrane Database of Systematic Reviews
- Version published:
-
- 04 January 2017see what's new
- Type:
-
- Intervention
- Stage:
-
- Review
- Cochrane Editorial Group:
-
Cochrane Breast Cancer Group
- Copyright:
-
- Copyright © 2019 The Cochrane Collaboration. Published by John Wiley & Sons, Ltd.
Article metrics
Altmetric:
Cited by:
Authors
Contributions of authors
NB, MSH and MA screened literature searches and extracted and analysed data.
MWR interpreted results and prepared the discussion and implications for practice.
EH designed and carried out literature searches.
MWR, LW and DH conceived of the protocol.
LW, DH, EW and CB drafted the protocol.
MWR and Professor RE Coleman commented on the content of the protocol.
Sources of support
Internal sources
-
North Trent Cancer Research Network, UK.
External sources
-
No sources of support supplied
Declarations of interest
None known.
Acknowledgements
Professor RE Coleman, University of Sheffield, UK, and the North Trent Cancer Research Network provided advice and support. We thank Andrew Cleves for his input and contributions. We also thank Lixin Ma (School of Public Health, Hebei University, China) for assistance provided in translating a Chinese paper, and Dr Liliya‐Eugenevna Ziganshina (Department of Basic and Clinical Pharmacology, Kazan Federal University, Russian Federation, and The Nordic Cochrane Centre) for assistance provided in translating two Russian papers.
Version history
| Published | Title | Stage | Authors | Version |
| 2017 Jan 04 | Axillary treatment for operable primary breast cancer | Review | Nathan Bromham, Mia Schmidt‐Hansen, Margaret Astin, Elise Hasler, Malcolm W Reed | |
| 2004 Jul 19 | Axillary staging for operable primary breast cancer. | Protocol | Daniel Hind, Lynda Wyld, Eifiona Wood, Catherine Beverley, Malcolm W Reed | |
| 2003 Oct 20 | Axillary staging for operable primary breast cancer. | Protocol | Daniel Hind, Lynda Wyld, C Beverly, Malcolm W Reed, Catherine Beverley | |
Differences between protocol and review
-
We searched trial registries to comply with new Cochrane methodological standards
-
We analysed breast cancer recurrence separately for local recurrence, locoregional recurrence and distant metastasis
-
The protocol states that when the eligibility of a trial is judged, the results section of the publication would be masked, but results were not masked when review authors judged eligibility
-
The protocol predates the current Cochrane risk of bias tool, which we used for the review
-
With the exception of Prof Malcolm W Reed, the review authors are different from those listed in the protocol
-
We have updated the background section of the review
-
We used the GRADE approach to interpret review findings
-
We included an additional comparison of less surgery versus ALND, which combines comparisons 1, 2, 3 and 7 (see Types of interventions section)
Notes
We have added a new review author, Eifiona Wood, to the protocol (10/05/2004).
We have added a new comparison to the protocol along with the following text added to the section titled "Criteria for considering studies for this review" (10/05/2004).
7) Full axillary surgery with no radiotherapy versus no axillary surgery with radiotherapy.
No subgroups.
We added comparison '7' to the original protocol in response to retrieval of large numbers of trial reports pertaining to this question. The review authors recognise that, unlike comparisons 1 through 6, comparison 7 does not address the effectiveness of axillary surgery. A regimen in comparison 1 ‐ full axillary surgery plus radiotherapy ‐ was standard practice but has been largely discontinued because of the illogic of irradiating the axilla subsequent to removal of the lymph nodes. The regimen in comparison 7 ‐ no axillary surgery with radiotherapy ‐ reflects more current practice; although it is considered irrelevant to a younger, fitter population, some clinicians still consider it a viable treatment option for older women.
Keywords
MeSH
Medical Subject Headings (MeSH) Keywords
Medical Subject Headings Check Words
Female; Humans;
PICOs


Risk of bias summary: review authors' judgements about each risk of bias item for each included study.

Comparison 1 No axillary surgery versus full axillary surgery, Outcome 1 All‐cause mortality (radiotherapy subgroups).

Comparison 1 No axillary surgery versus full axillary surgery, Outcome 2 All‐cause mortality (extra treatment for positive node subgroups).

Comparison 1 No axillary surgery versus full axillary surgery, Outcome 3 Locoregional recurrence (radiotherapy subgroups).

Comparison 1 No axillary surgery versus full axillary surgery, Outcome 4 Locoregional recurrence (extra treatment for positive‐node subgroups).

Comparison 1 No axillary surgery versus full axillary surgery, Outcome 5 Distant metastasis.

Comparison 1 No axillary surgery versus full axillary surgery, Outcome 6 Lymphoedema (≥ 12 months postop) ‐ fixed‐effect model.

Comparison 1 No axillary surgery versus full axillary surgery, Outcome 7 Lymphoedema (≥ 12 months postop) ‐ random‐effects model.

Comparison 1 No axillary surgery versus full axillary surgery, Outcome 8 Arm or shoulder movement impairment (≥ 12 months postop).

Comparison 1 No axillary surgery versus full axillary surgery, Outcome 9 Pain (≥ 12 months postop).

Comparison 1 No axillary surgery versus full axillary surgery, Outcome 10 Paraesthesia (≥ 12 months postop).

Comparison 1 No axillary surgery versus full axillary surgery, Outcome 11 Delayed healing.

Comparison 1 No axillary surgery versus full axillary surgery, Outcome 12 Skin graft.

Comparison 1 No axillary surgery versus full axillary surgery, Outcome 13 All‐cause mortality (allocation concealment subgroups).

Comparison 2 Axillary sampling versus full axillary surgery, Outcome 1 All‐cause mortality.

Comparison 2 Axillary sampling versus full axillary surgery, Outcome 2 Local recurrence.

Comparison 2 Axillary sampling versus full axillary surgery, Outcome 3 Axillary recurrence.

Comparison 2 Axillary sampling versus full axillary surgery, Outcome 4 Locoregional recurrence.
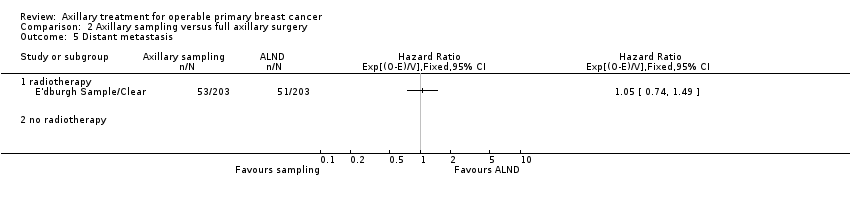
Comparison 2 Axillary sampling versus full axillary surgery, Outcome 5 Distant metastasis.

Comparison 2 Axillary sampling versus full axillary surgery, Outcome 6 Lymphoedema. Increase in arm circumference (≥ 12 months postop).

Comparison 2 Axillary sampling versus full axillary surgery, Outcome 7 Shoulder lateral rotation (12 months postop).

Comparison 2 Axillary sampling versus full axillary surgery, Outcome 8 Seroma.

Comparison 3 Sentinel node biopsy versus full axillary surgery, Outcome 1 All‐cause mortality.

Comparison 3 Sentinel node biopsy versus full axillary surgery, Outcome 2 Local recurrence.

Comparison 3 Sentinel node biopsy versus full axillary surgery, Outcome 3 Axillary recurrence.

Comparison 3 Sentinel node biopsy versus full axillary surgery, Outcome 4 Locoregional recurrence.

Comparison 3 Sentinel node biopsy versus full axillary surgery, Outcome 5 Distant metastasis.

Comparison 3 Sentinel node biopsy versus full axillary surgery, Outcome 6 Lymphoedema. Increase in arm circumference (≥ 12 months postop).

Comparison 3 Sentinel node biopsy versus full axillary surgery, Outcome 7 Lymphoedema. Patient reported (at 12 or more months postop).

Comparison 3 Sentinel node biopsy versus full axillary surgery, Outcome 8 Shoulder flexion (12 months postop).

Comparison 3 Sentinel node biopsy versus full axillary surgery, Outcome 9 Shoulder abduction (12 months postop).

Comparison 3 Sentinel node biopsy versus full axillary surgery, Outcome 10 Shoulder internal rotation (12 months postop).

Comparison 3 Sentinel node biopsy versus full axillary surgery, Outcome 11 Shoulder external rotation (12 months postop).

Comparison 3 Sentinel node biopsy versus full axillary surgery, Outcome 12 Subjective arm movement impairment (≥ 12 months postop).

Comparison 3 Sentinel node biopsy versus full axillary surgery, Outcome 13 Pain (≥ 12 months postop).

Comparison 3 Sentinel node biopsy versus full axillary surgery, Outcome 14 Paraesthesia (≥ 12 months postop).

Comparison 3 Sentinel node biopsy versus full axillary surgery, Outcome 15 Numbness (≥ 12 months postop).

Comparison 3 Sentinel node biopsy versus full axillary surgery, Outcome 16 Seroma.

Comparison 3 Sentinel node biopsy versus full axillary surgery, Outcome 17 Wound infection.

Comparison 3 Sentinel node biopsy versus full axillary surgery, Outcome 18 Brachial plexus injury at 6 months postop.

Comparison 4 Radiotherapy versus full axillary surgery, Outcome 1 All‐cause mortality.

Comparison 4 Radiotherapy versus full axillary surgery, Outcome 2 Local recurrence.

Comparison 4 Radiotherapy versus full axillary surgery, Outcome 3 Distant metastasis.

Comparison 4 Radiotherapy versus full axillary surgery, Outcome 4 Lymphoedema. Increase in arm circumference (≥ 12 months postop).

Comparison 4 Radiotherapy versus full axillary surgery, Outcome 5 Delayed healing.

Comparison 4 Radiotherapy versus full axillary surgery, Outcome 6 Wound infection.

Comparison 4 Radiotherapy versus full axillary surgery, Outcome 7 Skin graft.

Comparison 4 Radiotherapy versus full axillary surgery, Outcome 8 Haematoma.

Comparison 5 Less surgery versus ALND, Outcome 1 All‐cause mortality.

Comparison 5 Less surgery versus ALND, Outcome 2 All‐cause mortality (radiotherapy subgroups).

Comparison 5 Less surgery versus ALND, Outcome 3 All‐cause mortality (additional treatment for histologically positive nodes).

Comparison 5 Less surgery versus ALND, Outcome 4 Local recurrence.

Comparison 5 Less surgery versus ALND, Outcome 5 Locoregional recurrence.

Comparison 5 Less surgery versus ALND, Outcome 6 Distant metastasis.

Comparison 5 Less surgery versus ALND, Outcome 7 Lymphoedema. Increase in arm volume at 12 months postop.

Comparison 5 Less surgery versus ALND, Outcome 8 Paraesthesia (≥ 12 months postop).

Comparison 5 Less surgery versus ALND, Outcome 9 Pain (≥ 12 months postop).

Comparison 5 Less surgery versus ALND, Outcome 10 Delayed healing.

Comparison 5 Less surgery versus ALND, Outcome 11 Seroma.

Comparison 5 Less surgery versus ALND, Outcome 12 Wound infection.

Comparison 5 Less surgery versus ALND, Outcome 13 Skin graft.

Comparison 5 Less surgery versus ALND, Outcome 14 Haematoma.
| No axillary surgery compared with full axillary surgery for operable primary breast cancer | |||||
| Patient or population: women with operable primary breast cancer | |||||
| Outcomes | Illustrative comparative risks* (95% CI) | Relative effect | Number of participants | Quality of the evidence | |
| Assumed risk | Corresponding risk | ||||
| Full axillary surgery | No axillary surgery | ||||
| All‐cause mortality | 92% overall survival at 5 yearsa | 92% overall survival at 5 years | HR 1.06 | 3849 | ⊕⊕⊕⊝ |
| Locoregional recurrence | 86% locoregional recurrence‐free survival at 5 yearsc | 71% locoregional recurrence‐free survival at 5 years | HR 2.35 | 20,863d | ⊕⊕⊕⊝ |
| Lymphoedema | 236 per 1000 | 87 per 1000 | OR 0.31 | 1714 | ⊕⊕⊝⊝ |
| Arm or shoulder movement impairment | 91 per 1000 | 67 per 1000 | OR 0.72 | 1495 | ⊕⊝⊝⊝ |
| *The basis for the assumed risk (e.g. median control group risk across studies) is provided in footnotes. The corresponding risk (and its 95% confidence interval) is based on the assumed risk in the comparison group and the relative effect of the intervention (and its 95% CI). | |||||
| GRADE Working Group grades of evidence | |||||
| aAssumed risk is taken from full axillary surgery arm of Institut Curie. | |||||
| Axillary sampling compared with full axillary surgery for operable primary breast cancer | ||||||
| Patient or population: women with operable primary breast cancer | ||||||
| Outcomes | Illustrative comparative risks* (95% CI) | Relative effect | Number of participants | Quality of the evidence | Comments | |
| Assumed risk | Corresponding risk | |||||
| Full axillary surgery | Axillary sampling | |||||
| All‐cause mortality | 82% overall survival at 5 yearsa | 83% overall survival at 5 years | HR 0.94 | 967 | ⊕⊕⊝⊝ | |
| Local recurrence | 85% local recurrence‐free survival at 5 yearsd | 80% local recurrence free survival at 5 years | HR 1.41 (0.94 to 2.12) | 1404 | ⊕⊕⊝⊝ | |
| *The basis for the assumed risk (e.g. median control group risk across studies) is provided in footnotes. The corresponding risk (and its 95% confidence interval) is based on the assumed risk in the comparison group and the relative effect of the intervention (and its 95% CI). | ||||||
| GRADE Working Group grades of evidence. | ||||||
| aAssumed risk is taken from full axillary surgery arm of E'dburgh Sample/Clear. | ||||||
| Sentinel node biopsy compared with full axillary surgery for operable primary breast cancer | |||||
| Patient or population: women with operable primary breast cancer | |||||
| Outcomes | Illustrative comparative risks* (95% CI) | Relative effect | Number of participants | Quality of the evidence | |
| Assumed risk | Corresponding risk | ||||
| Full axillary surgery | Sentinel node biopsy | ||||
| All‐cause mortality | 96% overall survival at 5 yearsa | 96% overall survival at 5 years | HR 1.05 | 6352 | ⊕⊕⊕⊝ |
| Lymphoedema | 132 per 1000 | 48 per 1000 | OR 0.33 | 815 | ⊕⊕⊝⊝ |
| Subjective arm movement impairment | 100 per 1000 | 40 per 1000 | OR 0.38 | 877 | ⊕⊝⊝⊝ |
| Paraesthesia | 776 per 1000 | 343 per 1000 | OR 0.15 | 495 | ⊕⊕⊝⊝ |
| Pain | 177 per 1000 | 86 per 1000 | OR 0.44 | 877 | ⊕⊕⊝⊝ |
| Numbness | 346 per 1000 | 185 per 1000 | OR 0.43 | 1799 | ⊕⊕⊕⊝ |
| *The basis for the assumed risk (e.g. median control group risk across studies) is provided in footnotes. The corresponding risk (and its 95% confidence interval) is based on the assumed risk in the comparison group and the relative effect of the intervention (and its 95% CI). | |||||
| GRADE Working Group grades of evidence. | |||||
| aAssumed risk taken from the full axillary surgery arm of Milan. | |||||
| Radiotherapy alone compared with full axillary surgery for operable primary breast cancer | |||||
| Patient or population: women with operable primary breast cancer | |||||
| Outcomes | Illustrative comparative risks* (95% CI) | Relative effect | Number of participants | Quality of the evidence | |
| Assumed risk | Corresponding risk | ||||
| Full axillary surgery | Radiotherapy alone | ||||
| All‐cause mortality | 81% overall survival at 5 yearsa | 79% overall survival at 5 years | HR 1.1 | 2469 | ⊕⊕⊕⊕ |
| Local recurrence | 90% local recurrence‐free survival at 5 yearsb | 92% local recurrence‐free survival at 5 yearsa | HR 0.8 | 22,256c | ⊕⊕⊕⊕ |
| *The basis for the assumed risk (e.g. median control group risk across studies) is provided in footnotes. The corresponding risk (and its 95% confidence interval) is based on the assumed risk in the comparison group and the relative effect of the intervention (and its 95% CI). | |||||
| GRADE Working Group grades of evidence. | |||||
| aAssumed risk from full axillary surgery arm of NSABP B‐04 using mean 5‐year overall survival in combined N+ and N‐ groups. | |||||
| Study | Outcome reported | Observed | Expected | Variance | HR | 95% CIs | P value | Follow‐up | Notes |
| Overall mortality | ALND: 107/112 No ALND: 108/121 | o‐e = ‐3.1 | 46.5 | 0.94 | (0.70 to 1.25) | NA | 15 years? | Taken from Clarke 2005 (Appendix web figure 9b), then inverted to reflect that more surgery is our control and less surgery is our research condition The number of patients reported by Clarke 2005 differs from that reported by Brinkley (1971). | |
| Breast cancer mortality | ALND: 74/112 No ALND: 78/121 | o‐e = ‐2.2 | 32.8 | ‐ | ‐ | NA | 15 years? | Taken from Clarke 2005 (Appendix web figure 9b), then inverted to reflect that more surgery is our control and less surgery is our research condition. Not included in meta‐analysis | |
| Isolated local recurrence | ALND: 7 events/1148 women‐years No ALND: 15 events/1218 women‐years | o‐e = 3.3 | 5.4 | 1.8 | (0.79 to 4.28) | NA | 5 years? | Taken from Clarke 2005 (Appendix web figure 9b), then inverted to reflect that more surgery is our control and less surgery is our research condition | |
| Overall mortality | ALDN: 7/476 SLNB: 7/478 | NA | NA | NA | NA | NA | 1 year | Cannot calculate o‐e. Not included in meta‐analysis | |
| Axillary recurrence | ALDN: 4/476 SLNB: 1/478 | NA | NA | NA | NA | NA | 1 year | Cannot calculate o‐e. Not included in meta‐analysis | |
| Overall mortality | ALND: 21/43 Simple: 30/52 | o‐e = 4.74 | 12.35 | 1.47 | (0.84 to 2.56) | 0.1775 | 10 years | Tierney et al (2007) method 7 used log‐rank test results from figure 1. Cape Town | |
| Overall mortality (node‐negative) | ALND: 14/21 Simple: 26/30 | o‐e = 1.8 | 7.6 | ‐ | ‐ | NA | Taken from Clarke 2005 (Appendix web figure 9a; Groote‐Schuur), then O‐E sign changed to reflect that more surgery is our control and less surgery is our research condition. Not included in meta‐analysis | ||
| Overall mortality (node‐positive) | ALND: 19/22 Simple: 22/25 | o‐e = ‐1.9 | 7.7 | ‐ | ‐ | NA | Taken from Clarke 2005 (Appendix web figure 9b; Groote‐Schuur), then O‐E sign changed to reflect that more surgery is our control and less surgery is our research condition. Not included in meta‐analysis | ||
| Isolated local recurrence (node‐negative) | ALND: 3/206 women‐years Simple: 8/232 women‐years | o‐e = 1.7 | 2.3 | 2.09 | (0.58 to 7.63) | NA | Taken from Clarke 2005 (Appendix web figure 9a; Groote‐Schuur), then inverted to reflect that more surgery is our control and less surgery is our research condition | ||
| Isolated local recurrence (node‐positive) | ALND: 5/134 women‐years Simple: 9/173 women‐years | o‐e = 0.0 | 2.0 | 1.00 | (0.25 to 4.00) | NA | Taken from Clarke 2005 (Appendix web figure 9b; Groote‐Schuur), then inverted to reflect that more surgery is our control and less surgery is our research condition | ||
| Axillary recurrence | ALND: 2/43 Simple: 8/52 | NA | NA | NA | NA | NA | 10 years | Cannot calculate o‐e. Not included in meta‐analysis | |
| Any locoregional recurrence | ALND: 11/43 Simple: 19/52 | NA | NA | NA | NA | NA | 10 years | Cannot calculate o‐e. Not included in meta‐analysis | |
| Distant metastases | ALND: 11/43 Simple: 13/52 | NA | NA | NA | NA | NA | 10 years | Cannot calculate o‐e. Not included in meta‐analysis | |
| Overall survival | ALND: N = 97 Sampling: N =103 Total events = 152 Fig 2 data: ALND: 23/97 Sampling: 13/103 | o‐e: 7.4 | 38 | 1.21 | (0.29 to 0.99) | 0.23 | 20 years | HR calculated using log‐rank P value from Stewart et al (1994, page 42) by Tierney 2007 method 8, 9. Owing to non‐proportionality of hazard rates, HR cannot be included in meta‐analysis | |
| Disease‐free survival | ALND: 97 Sampling: 103 | 5.87 | 7.75 | 2.13 | (1.05 to 4.31) | 0.035 | 20 years | Log‐rank P value Tierney 2007 method 8, 9 (page 43 & Fig 5 Stewart et al, 1994) | |
| Locoregional recurrence (chest wall, axilla, supraclavicular/internal mammary nodes) | ALND: 19/94 Sampling: 31/99 Fig 4: ALND: 11/97 Sampling: 22/103 | o‐e: 6.46 | 11.78 | 1.73 | (0.87 to 3.42) | NA | 20 years | Tierney et al (2007) method 4 used and data from Figure 4 & page 42 Stewart et al (1994) | |
| Distant relapse | ALND: 43/94 Sampling: 59/99 | o‐e: 8.4 | 24.87 | 1.4 | (0.99 to 1.71) | 0.092 | 20 years | Data from Table 2, Stewart et al (1994): excludes patients with radiotherapy violations. Per‐protocol analysis ‐ not included in meta‐analysis | |
| Breast cancer recurrence (total) (locoregional and distant relapse) | ALND: 62/94 Sampling: 90/99 | o‐e: 12.77 | 36.71 | 1.42 | (1.18 to 1.61) | 0.035 | 20 years | Calculated from Stewart et al (1994) (excludes RT violations) per‐protocol analysis Risk of overestimation not certain as these are first events or total events.‐ not included in meta‐analysis | |
| Overall survival | ALND: ?/232 Sampling: ?/234 Total events = 53 ALND: 207/232 Sampling: 190/234 | o‐e: ‐4.66 | 13.25 | 0.7 | (0.41 to 1.21) | 0.20 | 5 years | HR calculated using log rank P ‐ figure 2, Chetty (2000) | |
| Axillary recurrence | ALND: /232 Sampling: /234 | o‐e: ‐0.15 | 13.25 | 0.99 | (0.58 to 1.69) | 0.94 | Up to 8 years | Log‐rank P value Tierney 2007 method 7, 8, 9 used Fig 3 Chetty (2000) | |
| Local recurrence in the breast | ALND: 14/232 Sampling: 15/234 | o‐e: ‐0.10 | 7.24 | 0.99 | (0.48 to 2.04) | 0.97 | Up to 8 years | Tierney 2007 method 7, 8, 9 used Table 2 & page 87 Chetty (2000) | |
| Distant recurrence | ALND: 29/232 Sampling: 29/234 | Not available | Not available | Not available | Not available | NA | Up to 8 years | Table 2, Chetty (2000). Unable to estimate HR ‐ not included in analysis | |
| Overall survival | ALND: 76/203 Sampling: 71/203 | o‐e: ‐3.81 | 36.55 | 0.90 | (0.62 to 1.25) | NA | 13 years | Tierney 2007 method 3 used (using 1995 data – Clarke 2005 paper reports more deaths) Fig 1 and page 82 HR (CI) in Forrest et al (1995) ‐ inverted the HR | |
| Distant metastases | ALND: 51/203 Sampling: 53/203 | o‐e: 1.5 | 30.78 | 0.92 | (0.67 to 1.35) | NA | 13 years | Tierney 2007 method 3 used (using 1995 data), Fig 2 and HR (CI) page 82 in Forrest et al (1995), inverted the HR | |
| Locoregional relapse (chest wall, axilla, supraclavicular) | ALND: 38/203 Sampling: 29/203 | o‐e: ‐4.9 | 16.32 | 0.74 | (0.46 to 1.20) | NA | 13 years | Tierney 2007 method 3 used (using 1995 data) Method 3 Fig 3 from HR (CI), page 82 in Forrest et al (1995), inverted the HR | |
| Overall survival | ALND: 4/115 SLNB: 5/110 | o‐e: 0.58 | 2.22 | 1.32 | (0.35 to 4.92) | 0.679 | 5 years | Log‐rank P value (Canavese 2009 ‐ fig 3) Tierney 2007 method 7 used Fig 3 KM curve gives P = 0.679. I assumed that was correct as it appears on the graph. The text value (page 20) may be a typo 0.697. HR are similar; CI differ | |
| Axillary recurrence | ALND: 1/115 SLNB: 0/110 | NA | NA | NA | NA | NA | 5 years | Not included in meta‐analysis | |
| Breast cancer recurrence (local and contralateral recurrence, axillary and distant metastases) | ALND: 10/115 SLNB: 8/110 | NA | NA | NA | NA | NA | 5 years | Not included in meta‐analysis | |
| 5‐Year event‐free survival | ALND: 12/115 SLNB: 10/110 | o‐e: ‐0.85 | 5.45 | 0.86 | (0.37 to 1.98) | 0.715 | 5 years | Log‐rank P value from Fig 2, Canavese (2009) method 7 Tierney 2007 used | |
| Overall survival | ALND: 14/352 SLNB: 21/345 | NA | NA | NA | NA | NA | 5 years | Not included in meta‐analysis | |
| Disease‐free survival | ALND: 28/352 SLNB: 39/345 | o‐e = 1.18 | 16.3 | 1.08 | 0.769 | 5 years | Method 7 Tierney 2007 used | ||
| Axillary recurrence | ALND: 0/352 SLNB: 1/345 | NA | NA | NA | NA | NA | 5 years | Cannot calculate o‐e. Not included in meta‐analysis | |
| Locoregional recurrence | ALND: 3/352 SLNB: 16/345 | NA | NA | NA | NA | NA | 5 years | Cannot calculate o‐e. Not included in meta‐analysis | |
| Distant recurrence | ALND: 16/352 SLNB: 11/345 | NA | NA | NA | NA | NA | 5 years | Cannot calculate o‐e. Not included in meta‐analysis | |
| Overall mortality (clinically node negative) | ALND: 178/241 No ALND (wide excision): 185/233 | o‐e = 13.8 | 80.7 | 1.26 | (0.98 to 1.63) | 0.1 | 15 years? | Taken from Clarke 2005 (Appendix web figure 10a), then inverted to reflect that more surgery is our control and less surgery is our research intervention | |
| Overall mortality (clinically node positive) | ALND: 82/85 No ALND (wide excision): 64/71 | o‐e = 4.3 | 30.9 | 1.15 | (0.81 to 1.64) | 0.4 | 15 years? | Taken from Clarke 2005 (Appendix web figure 10b), then inverted to reflect that more surgery is our control and less surgery is our research intervention | |
| Breast cancer mortality (clinically node negative) | ALND: 122/241 No ALND (wide excision): 142/233 | o‐e = 13.8 | 58.8 | ‐ | ‐ | 0.07 | 15 years? | Taken from Clarke 2005 (Appendix web figure 10a), then inverted to reflect that more surgery is our control and less surgery is our research intervention Not included in meta‐analysis | |
| Breast cancer mortality (clinically node positive) | ALND: 53/85 No ALND (wide excision): 54/71 | o‐e = 6.2 | 23.6 | ‐ | ‐ | 0.2 | 15 years? | Taken from Clarke 2005 (Appendix web figure 10b), then inverted to reflect that more surgery is our control and less surgery is our research intervention. Not included in meta‐analysis | |
| Isolated local recurrence (clinically node negative) | ALND: 35 events/3267 women‐years No ALND: 81 events/2383 women‐years | o‐e = 29.5 | 26.4 | 3.06 | (2.09 to 4.48) | < .00001 | 5 years? | Taken from Clarke 2005 (Appendix web figure 10a), then inverted to reflect that more surgery is our control and less surgery is our research intervention | |
| Isolated local recurrence (clinically node positive) | ALND: 17 events/873 women‐years No ALND: 31 events/519 women‐years | o‐e = 10.5 | 10.8 | 2.64 | (1.46 to 4.80) | 0.001 | 5 years? | Taken from Clarke 2005 (Appendix web figure 10b), then inverted to reflect that more surgery is our control and less surgery is our research intervention | |
| Overall survival | Radical: 35/76 Simple: 40/76 | o‐e = 1.44 | 11.78 | 1.13 | (0.64 to 2.00) | NA | 8 years | Extracted from Fig 3, Burn et al (1968) Tierney 2007 method 10 on Simple is input as "research" and radical as "control". Min and max follow‐up input as 3‐96 months | |
| Local recurrence | Radical: 10/76 Simple: 11/76 | NA | NA | NA | NA | NA | 4‐9 years | Not included in meta‐analysis | |
| Mean time to recurrence | Radical: 15.7 months Simple: 25.9 months | NA | NA | NA | NA | NA | 4‐9 years | Not included in meta‐analysis | |
| Overall survival | ALND: 72/234 Surgery only: 71/239 | o‐e = 1.76 (survival curves cross) | 36.05 | 1.05 | (0.76 to 1.46) | 0.77 | 6‐7 years | HR reported on page 340 of IBCSG (2006), used Tierney 2007 method 3 | |
| Disease‐free survival | ALND: 92/234 Surgery only: 89/239 | o‐e = 2.6 | 44.69 | 1.06 | (0.79 to 1.42) | 0.69 | 6‐7 years | HR reported on page 340 of IBCSG (2006), used Tierney 2007 method 3 | |
| Axilla recurrence (as first event) | ALND: 2/234 Surgery only: 6/239 | NA | NA | NA | NA | NA | 6‐7 years | Not included in meta‐analysis | |
| Overall survival (whole follow‐up period) ITT | no ALND: NR ALND: NR | o‐e = 6.42 | 7.04 | 2.49 | 90% CI (1.34 to 4.63) | NA | Whole follow‐up period (unclear how long that is) | HR reported on page 566 of Avril (2011), used Tierney 2007 method 3 | |
| Event‐free survival (whole follow‐up period) ITT | no ALND: 44/297 ALND: 31/297 | o‐e = 8.75 | 18.37 | 1.61 | 90% CI (1.1 to 2.37) | NA | Whole follow‐up period (unclear how long that is) | HR reported on page 566 of Avril (2011), used Tierney 2007 method 3 | |
| Axillary event | Within 5 years: no ALND: 4/297 ALND: 0/310 After 5 years: no ALND: 2/297 ALND: 0/310 | NA | NA | NA | NA | NA | Not included in meta‐analysis | ||
| Lymph node (excl axillary) event | Within 5 years: no ALND: 1/297 ALND: NA After 5 years: no ALND: 0/297 ALND: NA | NA | NA | NA | NA | NA | Not included in meta‐analysis | ||
| Breast/chest wall event | Within 5 years: no ALND: 5/297 ALND: 4/310 After 5 years: no ALND: 0/297 ALND: 8/310 | NA | NA | NA | NA | NA | Not included in meta‐analysis | ||
| Metastatic event | Within 5 years: no ALND: 4/297 ALND: 1/310 After 5 years: no ALND: 2/297 ALND: 2/310 | NA | NA | NA | NA | NA | Not included in meta‐analysis | ||
| Contralateral breast cancer | Within 5 years: no ALND: 2/297 ALND: 1/310 After 5 years: no ALND: 2/297 ALND: 1/310 | NA | NA | NA | NA | NA | Not included in meta‐analysis | ||
| Other site cancer | Within 5 years: no ALND: 5/297 ALND: 5/310 After 5 years: no ALND: 5/297 ALND: 4/310 | NA | NA | NA | NA | NA | Not included in meta‐analysis | ||
| Overall survival | RT: 43/331; ALND: 29/326 | o‐e = 7 | 17.3 | 1.50 | (0.94 to 2.40) | NA | Taken from Clarke 2005 (Appendix web figure 10a), then inverted to reflect that more surgery is our control and less surgery is our research condition | ||
| Isolated local recurrence | RT: 39/2045 women‐years; ALND: 34/2126 women‐years | o‐e = 1.6 | 17.5 | 1.10 | (0.69 to 1.75) | NA | Taken from Clarke 2005 (Appendix web figure 10a), then inverted to reflect that more surgery is our control and less surgery is our research condition | ||
| Axilla recurrence | RT: 12/332; ALND: 5/326 | o‐e = 3.86 | 3.53 | 3.93 | ‐ | 0.04 | Table 2 in Louis‐Sylvestre (2004), method 7 in Tierney 2007 | ||
| Disease‐free survival | RT: 5 years : 82 (SD = 2.1)% 10 years : 72 (SD = 2.5)% 15 years : 65.5 (SD = 2.7)% | ALND: 5 years: 83.3 (SD 2)% 10 years: 72.6 (SD 2.5)% 15 years: 64.3 (SD 2.9)%. | NA | NA | NA | NA | o‐e cannot be extracted because P values not reported past NS in Table 2 in Louis‐Sylvestre (2004). Not included in meta‐analysis | ||
| Metastases | RT: 5 years: 12.8 (SD 1.9)% 10 years: 21 (SD 2.3)% 15 years: 24.9 (SD 2.5)% | ALND: 5 years: 10.8 (SD 1.7)% 10 years: 18.3 (SD 2.2)% 15 years: 25.8 (SD 2.6)% | NA | NA | NA | NA | O‐e cannot be extracted because P values not reported past NS in Table 2 in Louis‐Sylvestre (2004). Not included in meta‐analysis | ||
| Overall survival | ALND + RT: ?/97 Mastectomy alone: ?/98 (total event rate = 91) | o‐e = ‐4.19 | 22.75 | 0.83 | (0.55 to 1.25) | 0.38 | 15‐20 years | Using P = 0.38 reported on page 558 of Borgstrom (1994) and Tierney 2007 method 8. The o‐e is calculated on the basis of a total event rate of N = 91, and total N = 97 in the ALND + RT group and N = 98 in mastectomy alone group (i.e. intent‐to‐treat numbers), and using the only P value reported, which was for per‐protocol analysis that study authors stated did not differ from intention‐to‐treat analyses | |
| Chest wall recurrence | ALND + RT: 2/97 Mastectomy alone: 11/98 | NA | NA | NA | NA | NA | 15‐20 years | Cannot calculate o‐e. Not included in meta‐analysis | |
| Overall survival | Radical: 126/149 Simple + RT: 140/159 | o‐e = 5.4 | 58.6 | 1.10 | (0.85 to 1.42) | NA | 15 years | Taken from Clarke 2005 (Appendix web figure 10b), then inverted to reflect that more surgery is our control and less surgery is our research condition | |
| Death from breast cancer | Radical: 100/149 Simple + RT: 112/159 | o‐e = 2.8 | 46 | 1.06 | (0.80 to 1.42) | NA | 15 years | Taken from Clarke 2005 (Appendix web figure 10b), then inverted to reflect that more surgery is our control and less surgery is our research condition | |
| Local recurrence | Radical: 48 events/997 women‐years Simple + RT: 41 events/1113 women‐years | o‐e = ‐5.7 | 19.9 | 0.75 | (0.48 to 1.17) | NA | 15 years | Taken from Clarke 2005 (Appendix web figure 10b), then inverted to reflect that more surgery is our control and less surgery is our research condition | |
| Death from any cause (OS) | ALND = 23/257 SLNB = 15/259 | o‐e = ‐4.34 | 9.08 | 0.62 | (0.32 to 1.19) | 0.15 | 10 years | Log‐rank P (Tierney 2007 method 7); ALND is control | |
| Breast cancer recurrence (local recurrence, regional lymph node metastases, distant metastases) | ALND = 26/257 SLNB = 23/259 | o‐e = ‐2.25 | 12.02 | 0.83 | (0.47 to 1.46) | 0.52 | 10 years | Log‐rank P (Tierney 2007 method 7); ALND is control | |
| Distant metastasis | ALND = 20/257 SLNB = 17/259 | o‐e = ‐2.04 | 9.19 | 0.80 | (0.42 to 1.53) | 0.50 | 10 years | Log‐rank P from table 4 Veronesi (2010) (Tierney 2007 method 7); ALND is control | |
| Axillary metastasis | ALND = 0/257 SLNB = 2/259 | o‐e = 0.97 | 0.50 | 6.96 | (0.44 to 111.3) | 0.17 | 10 years | Log‐rank P from table 4 Veronesi (2010) (Tierney 2007 method 8 and 9); ALND is control | |
| Local recurrence | ALND = 4/257 SLNB = 4/259 | o‐e = ‐0.12 | 2.00 | 0.94 | (0.24 to 3.76) | 0.93 | 10 years | Log‐rank P from table 4 Veronesi (2010) (Tierney 2007 method 7); ALND is control | |
| Supraclavicular metastasis | ALND = 2/257 SLNB = 0/259 | o‐e = ‐1.02 | 0.50 | 0.13 | (0.01 to 2.09) | 0.15 | 10 years | Log‐rank P from table 4 Veronesi (2010) (Tierney 2007 method 8, 9); ALND is control | |
| Contralateral breast cancer | ALND = 10/257 SLNB = 9/259 | o‐e = ‐0.81 | 4.47 | 0.84 | (0.34 to 2.07) | 0.71 | 10 years | Log‐rank P from table 4 Veronesi (2010) (Tierney 2007 method 7); ALND is control | |
| Overall survival | ALND = 31/109 No ALND = 35/110 | o‐e = ‐2.72 | 16.43 | 0.85 | (0.52 to 1.37) | Median = 150 months | HR reported on page 922 of Martelli (2012). Using Tierney 2007 method 3 o Please note, the curves cross; also the HR used for extraction of o‐e and its variance is adjusted for tumour grade and oestrogen‐receptor status | ||
| Breast cancer deaths | ALND: 8/109 No ALND: 10/110 | o‐e = 1.33 | 4.06 | 1.39 | ‐ | ‐ | Median = 150 months | HR reported in Table 3 of Martelli (2012). Tierney 2007 method 3 o Please note, the curves cross; also the HR used for extraction of o‐e and its variance is adjusted for tumour grade and oestrogen‐receptor status. Not included in meta‐analysis | |
| Axillary relapse | ALND: 0/109 No ALND: 4/110 | NA | NA | NA | NA | NA | Median = 150 months | Table 2 of Martelli (2012), cannot calculate o‐e | |
| Recurrence (ipsilateral breast tumour) | ALND: 4/109 No ALND: 7/110 | NA | NA | NA | NA | NA | Median = 150 months | Table 2 of Martelli (2012), cannot calculate o‐e | |
| Distant metastases | ALND: 9/109 No ALND: 9/110 | o‐e = ‐2.68 | 5.93 | 0.64 | (0.28 to 1.42) | NA | Median = 150 months | HR reported in Table 3 of Martelli (2012). Tierney 2007 method 3 Please note, the curves cross; also the HR used for extraction of o‐e and its variance is adjusted for tumour grade and oestrogen‐receptor status | |
| Overall survival | 10‐year ALND: 93.3% (95% CI 89.4‐95.8) no ALND: 91.5% (95% CI 87‐94.4) | o‐e = 1.76 | 12.33 | 1.15 | (0.66 to 2.02) | P = .436 | Median = 127.5 months | Agresti (2014) Figure 3A and Tierney 2007 method 11 Please note, the curves cross at the very end, also HR used for extraction of o‐e | |
| Death from breast cancer | ALND: 17/272 no ALND: 15/245 | NA | NA | NA | NA | P = 1.00 | Median = 127.5 months | Not included in meta‐analysis | |
| Disease‐free survival | 10‐year ALND: 92.4% (95% CI 88.5‐95.1) no ALND: 91.3% (95% CI 86.7‐94.3) | o‐e= ‐0.13 | 10.7 | 0.99 | (0.54 to 1.8) | P = .97 | Median = 127.5 months | Agresti (2014) Figure 3A andTierney 2007 method 11 Please note, the curves cross at the very end; also the HR used for extraction of o‐e | |
| Distant metastases | ALND: 23/272 no ALND: 20/245 | NA | NA | NA | NA | P = 1.00 | Median = 127.5 months | Not included in meta‐analysis | |
| Axillary recurrence | ALND: 0/272; no ALND: 22/245 | NA | NA | NA | NA | NA | Median = 127.5 months | Not included in meta‐analysis | |
| Local recurrence | ALND: 14/272 no ALND: 11/245 | NA | NA | NA | NA | P = .839 | Median = 127.5 months | Not included in meta‐analysis | |
| Contralateral breast cancer | ALND: 13/272 no ALND: 14/245 | `NA | NA | NA | NA | P = .695 | Median = 127.5 months | Not included in meta‐analysis | |
| Overall survival: node negative: ALND vs no ALND | ALND = 259/389 No ALND = 256/384 | o‐e = ‐5 | 117.3 | 0.96 | (0.80 to 1.15) | NA | 15 years? | Taken from Clarke 2005 Lancet (Appendix web figure 9a), then inverted to reflect that more surgery is our control and less surgery is our research condition | |
| Overall survival: node negative: ALND vs no ALND + RT | ALND = 259/389 No ALND + RT = 271/386 | o‐e = 8.6 | 122.2 | 1.07 | (0.90 to 1.28) | NA | 15 years? | Taken from Clarke 2005 (Appendix web figure 10a), then inverted to reflect that more surgery is our control and less surgery is our research condition | |
| Overall survival: node positive: ALND vs no ALND + RT | ALND = 244/301 No ALND + RT = 244/305 | o‐e = 8.3 | 109.4 | 1.08 | (0.89 to 1.30) | NA | 15 years? | Taken from Clarke 2005 (Appendix web figure 10b), then inverted to reflect that more surgery is our control and less surgery is our research condition | |
| Local isolated recurrence: node negative: ALND vs no ALND | ALND = 35 events/3949 women‐years No ALND = 94 events/3335 women‐years | o‐e = 31.5 | 29.2 | 2.94 | (2.05 to 4.23) | NA | 5 years? | Taken from Clarke 2005 (Appendix web figure 9a), then inverted to reflect that more surgery is our control and less surgery is our research condition | |
| Local isolated recurrence: node negative: ALND vs no ALND + RT | ALND = 35 events/3949 women‐years No ALND + RT = 18 events/3896 women‐years | o‐e = ‐8.7 | 13 | 0.51 | (0.30 to 0.88) | NA | 5 years? | Taken from Clarke 2005 (Appendix web figure 10a), then inverted to reflect that more surgery is our control and less surgery is our research condition | |
| Local isolated recurrence: node positive: ALND vs no ALND + RT | ALND = 45 events/2268 women‐years No ALND + RT = 42 events/2025 women‐years | o‐e = ‐0.5 | 20.8 | 0.98 | (0.64 to 1.50) | NA | 5 years? | Taken from Clarke 2005 (Appendix web figure 10b), then inverted to reflect that more surgery is our control and less surgery is our research condition | |
| Disease‐free survival: node negative: ALND vs no ALND | ALND = 281/362 No ALND + RT = 287/365 | o‐e = 9.36 | 138.3 | 1.07 | (0.91 to 1.27) | 0.39 | 25 years | FIsher (2008) page 568 (radical vs total mastectomy) Tierney 2007 method 3, calculated from the date of mastectomy, events considered in determination of disease‐free survival were the first local, regional or distant recurrence of tumour; contralateral breast cancer or a second primary tumour other than a tumour in the breast; and death with no evidence of cancer | |
| Disease‐free survival: node negative: ALND vs no ALND + RT | ALND = 281/362 No ALND + RT = 292/352 | o‐e = 8.3 | 142.39 | 1.06 | (0.90 to 1.25) | 0.49 | 25 years | FIsher (2008) page 568 (radical vs total mastectomy + RT) Tierney 2007 method 3, calculated from the date of mastectomy, events considered in determination of disease‐free survival were the first local, regional or distant recurrence of tumour; contralateral breast cancer or a second primary tumour other than a tumour in the breast; and death with no evidence of cancer | |
| Disease‐free survival: node positive: ALND vs no ALND + RT | ALND = 254/292 No ALND + RT = 258/294 | o‐e = 14.46 | 127.57 | 1.12 | (0.94 to 1.33) | 0.20 | 25 years | FIsher (2008) page 568, Tierney 2007 method 3, calculated from the date of mastectomy, events considered in determination of disease‐free survival were the first local, regional or distant recurrence of tumour; contralateral breast cancer or a second primary tumour other than a tumour in the breast; and death with no evidence of cancer | |
| Relapse‐free survival: node negative: ALND vs no ALND | ALND = 154/362 No ALND + RT = 182/365 | o‐e = 10.17 | 77.61 | 1.14 | (0.91 to 1.42) | 0.27 | 25 years | FIsher (2008) page 568 Tierney 2007 method 3; calculated from the date of mastectomy, events considered in determination of relapse‐free survival were the first local, regional or distant recurrence; or an event in the contralateral breast | |
| Relapse‐free survival: node negative: ALND vs no ALND + RT | ALND = 154/362 No ALND + RT = 163/352 | o‐e = ‐2.9 | 71.05 | 0.96 | (0.76 to 1.21) | 0.74 | 25 years | FIsher (2008) page 568, Tierney 2007 method 3, calculated from the date of mastectomy, events considered in determination of relapse‐free survival were the first local, regional or distant recurrence; or an event in the contralateral breast | |
| Relapse‐free survival: node positive: ALND vs no ALND + RT | ALND = 178/292 No ALND + RT = 183/294 | o‐e = 7.63 | 88.52 | 1.09 | (0.89 to 1.35) | 0.40 | 25 years | FIsher (2008) page 568, Tierney 2007 method 3, calculated from the date of mastectomy, events considered in determination of relapse‐free survival were the first local, regional or distant recurrence; or an event in the contralateral breast | |
| Time to distant metastasis: node negative: ALND vs no ALND | ALND = 101/362 No ALND + RT = 107/365 | o‐e = 8.44 | 88.52 | 1.1 | (0.89 to 1.35) | 0.39 | 25 years | FIsher (2008) page 569, Tierney 2007 method 3 | |
| Time to distant metastasis: node negative: ALND vs no ALND + RT | ALND = 101/362 No ALND + RT = 111/352 | o‐e = 6.69 | 86.9 | 1.08 | (0.88 to 1.34) | 0.44 | 25 years | FIsher (2008) page 569, Tierney 2007 method 3 | |
| Time to distant metastasis: node positive: ALND vs no ALND + RT | ALND = 120/292 No ALND + RT = 127/294 | o‐e = 5.98 | 88.41 | 1.07 | (0.87 to 1.32) | 0.51 | 25 years | FIsher (2008) page 569, Tierney 2007 method 3 | |
| Overall survival (all randomised participants, i.e. node+ and node‐) | ALND = 228 (deaths)/2807 SLN = 252 (deaths)/2804 | 10.32 | 119.7 | 1.09 | (0.91 to 1.3) | 0.35 | 10 years | From Julian (2013) using Tierney 2007 method 4. Contacted author (Krag) to confirm direction of effect | |
| Disease‐free survival (all randomised participants, i.e. node+ and node‐) | ALND = 455/2807 SLN = 475/2804 | 4.6 | 232.39 | 1.02 | (0.9 to 1.16) | 0.72 | 10 years | From Julian (2013) using Tierney 2007 method 4. Contacted author (Krag) to confirm direction of effect | |
| Local/regional recurrence (all randomised participants, i.e. node+ and node‐) | ALND = 121/2807 SLN = 112/2804 | ‐2.37 | 58.16 | 0.96 | (0.74 to 1.24) | 0.77 | 10 years | From Julian (2013) using Tierney 2007 method 4. Contacted author (Krag) to confirm direction of effect | |
| Axillary recurrence (all randomised participants, i.e. node+ and node‐) | ALND = 6/2807 SLN = 14/2804 | NA | NA | NA | NA | NA | 10 years | o‐e cannot be calculated. Not included in meta‐analysis | |
| Overall survival (for SLN‐neg) | ALND = 219 (dead)/1975 SLN = 245 (dead)/2011 | o‐e = 12.07 | 115.64 | 1.11 | (0.93 to 1.33) | 0.27 | 10 years | From Julian (2013) using Tierney 2007 method 4 | |
| Disease‐free survival (for SLN‐neg) | ALND = 456 (diseased)/1975 SLN = 465 (diseased)/2011 | o‐e = 2.29 | 230.23 | 1.01 | (0.89 to 1.15) | 0.92 | 10 years | From Julian (2013) using Tierney 2007 method 4 | |
| Local regional recurrence | ALND = 85 (events)/1975 SLN = 80 (events)/2011 | o‐e = ‐2.11 | 41.21 | 0.95 | (0.7 to 1.29) | 0.77 | 10 years | From Julian (2013) using Tierney 2007 method 4 | |
| Local recurrence in SLN‐negative participants | ALND = 54 (events)/1975 SLN = 49 (events)/2011 | o‐e = ‐3.03 | 25.69 | 0.89 | (0.6 to 1.31) | 0.55 | Mean = 95.6 months | From Krag (2010) page 930 using logrank P = 0.55 Tierney 2007 method 7 | |
| Regional recurrence in SLN‐negative participants | ALND = 8 (events)/1975 SLN = 14 (events)/2011 | o‐e = 2.77 | 5.09 | 1.72 | (0.72 to 4.11) | 0.22 | Mean = 95.6 months | From Krag (2010) page 930 using log rank P = 0.22 Tierney 2007 method 7 | |
| Distant recurrence in SLN‐negative patients | ALND = 55 (events)/1975 SLN = 64 (events)/2011 | o‐e = 3.91 | 29.82 | 1.14 | (0.8 to 1.64) | Mean = 95.6 months | From Krag (2010) Figure 4 Tierney 2007 method 3 | ||
| Recurrence in the axilla | ALND: 0/57 Sampling: 1/54 | NA | NA | NA | NA | NA | Median: 30 (range, 5‐76) months | From Borup‐Chistesen (1993) table IV. Recurrence is reported only out of N = 111 (57 + 54) participants who did not have metastases in axillary lymph nodes after dissection or biopsy. Cannot calculate o‐e on the basis of available data | |
| Local recurrence | ALND: 4/57 Sampling: 1/54 | NA | NA | NA | NA | NA | Median: 30 (range, 5‐76) months | From Borup‐Chistesen (1993) table IV. Recurrence is reported only out of N = 111 (57 + 54) participants who did not have metastases in axillary lymph nodes after dissection or biopsy. Cannot calculate o‐e on the basis of available data | |
| Distant recurrence | ALND: 1/57 Sampling: 4/54 | NA | NA | NA | NA | NA | Median: 30 (range, 5‐76) months | From Borup‐Chistesen (1993) table IV. Recurrence is reported only out of N = 111 (57 + 54) participants who did not have metastases in axillary lymph nodes after dissection or biopsy. Cannot calculate o‐e on the basis of available data | |
| Overall survival: node negative: ALND vs Simple + RT | ALND = 143/199 Simple + RT = 143/180 | o‐e = 17.5 | 65.7 | 1.31 | (1.02 to 1.66) | NA | 15 years? | Taken from Clarke 2005 (Appendix web figure 10a), then inverted to reflect that more surgery is our control and less surgery is our research condition | |
| Overall survival: node positive: ALND vs Simple + RT | ALND = 72/89 Simple + RT = 77/93 | o‐e = 6.3 | 34.1 | 1.20 | (0.86 to 1.68) | NA | 15 years? | Taken from Clarke 2005 (Appendix web figure 10b), then inverted to reflect that more surgery is our control and less surgery is our research condition | |
| Local isolated recurrence: node negative: ALND vs no ALND + RT | ALND = 26 events/2880 women‐years Simple + RT = 21 events/2204 women‐years | o‐e = ‐0.5 | 11.3 | 0.96 | (0.53 to 1.71) | NA | 5 years? | Taken from Clarke 2005 (Appendix web figure 10a), then inverted to reflect that more surgery is our control and less surgery is our research condition | |
| Local isolated recurrence: node positive: ALND vs no ALND + RT | ALND = 24 events/943 women‐years Simple + RT = 17 events/878 women‐years | o‐e = ‐2.9 | 9.8 | 0.74 | (0.40 to 1.39) | NA | 5 years? | Taken from Clarke 2005 (Appendix web figure 10b), then inverted to reflect that more surgery is our control and less surgery is our research condition | |
| Overall survival ‐ node negative | ALND: 56/101 Simple + RT to chest wall & axilla: 42/85 | o‐e = ‐5.5 | 21.4 | 0.77 | (0.51 to 1.18) | NA | 15 years? | CAUTION: same control group used twice for these data Taken from Clarke 2005 (Appendix web figures 9a and 10a), then inverted to reflect that more surgery is our control and less surgery is our research condition | |
| Overall survival ‐ node positive | ALND: 13/17 Simple + RT to chest wall & axilla: 7/9 | o‐e = ‐0.5 | 3.3 | 0.86 | (0.29 to 2.53) | NA | 15 years? | CAUTION: same control group used twice for these data Taken from Clarke 2005 (Appendix web figures 9b and 10b). then inverted to reflect that more surgery is our control and less surgery is our research condition | |
| Isolated local recurrence ‐ node negative | ALND: 15/510 py Simple + RT to chest wall & axilla: 13/483 py | o‐e = 0.0 | 6.7 | 1.00 | (0.47 to 2.13) | NA | 5 years? | CAUTION: same control group used twice for these data Taken from Clarke 2005 (Appendix web figures 9a and 10a), then inverted to reflect that more surgery is our control and less surgery is our research condition | |
| Isolated local recurrence ‐ node positive | ALND: 3/69 py Simple + RT to chest wall & axilla: 1/41 py | o‐e = ‐0.5 | 0.9 | 0.57 | (0.07 to 4.53) | NA | 5 years? | CAUTION: same control group used twice for these data Taken from Clarke 2005 (Appendix web figures 9b and 10b), then inverted to reflect that more surgery is our control and less surgery is our research condition | |
| 10‐year overall survival | Level I clearance: 75/93 ALND: 71/88 | NA | NA | NA | NA | NA | 10 years | o‐e could not be calculated as no P values reported. Not included in meta‐analysis | |
| 10‐year disease‐free survival | Level I clearance: 72/93 ALND: 68/88 | NA | NA | NA | NA | NA | 10 years | o‐e could not be calculated as no P values reported. Not included in meta‐analysis | |
| Breast cancer recurrence | Level I clearance: 19/93 ALND: 17/88 | NA | NA | NA | NA | NA | 10 years? | o‐e could not be calculated as no P values reported. Not included in meta‐analysis | |
| Local recurrence | Level I clearance: 3.2% ALND: 2.3% | NA | NA | NA | NA | NA | 10 years? | o‐e could not be calculated as no P values reported. Not included in meta‐analysis | |
| Distant metastasis | Level I clearance: 19/93 ALND: 15/88 | NA | NA | NA | NA | NA | 10 years? | o‐e could not be calculated as no P values reported. Not included in meta‐analysis | |
| Figures in bold were reported in the original publication; others were derived (see Notes column). | |||||||||
| Study | Oedema | Shoulder function | Skin graft | Delayed healing | Activity | Attitude | Other | Notes |
| Slight: 0‐2.5 cm Moderate: 2.5‐4.5 cm Severe > 4.5 cm Circumference of both arms measured 7.5 cm below the acromion, 18 cm above and 10 cm below the olecranon and at the wrist Presumably difference between arm circumference | Arm function: Good: uses arm freely Fair: cannot do usual tasks Poor: very unsatisfactory use of arm Appears to be assessed by patient questionnaire | Good: normal activity, back at work or resumed usual activities Fair: light work only because of operation; not resumed usual activities Poor: inactive. Assessed by patient questionnaire | Good: no complaints Fair: some complaints Poor: very unhappy about experience Assessed by patient questionnaire | |||||
| Lympheoedema (subjective) – according to patient self‐report or physician diagnosis Lympheoedema (objective): 2 cm or greater postop increase in ipsilateral arm circumference | Axillary paraesthesia – patient reported Brachial plexus injury – determined by physician on examining the patient | |||||||
| 1. Mild oedema 2. Gross oedema (estimated by measuring the circumference of each arm with the arm extended at points 11 inches and 22 inches from the tips of the middle finger. An increase of 1 inch in the circumference of the arm on the side of the operation at either or both points was taken to indicate some degree of oedema) | Stiff shoulder | Need for skin graft | Sufficient to cause postponement of radiotherapy until at least 2 months after the operation. Although incidence of delayed healing varied between surgeons, each showed the same trend of higher incidence following a radical operation | |||||
| Subjective lymphoedema: patient reported Objective lymphoedema: circumferential arm measurement at 4 cm intervals from the wrist (approximately 10 measurements) used to calculate arm volume. Volume corrected using measurements from contralateral arm | Range of movement measured by recording degrees of flexion, abduction and internal and external rotation using goniometer Sensory function tested using pinprick, light touch | Global Severity Index (GSI; low values better), Beck's Depression Inventory, Spielberger's State‐Trait anxiety, MAC, SF‐36 (measured psychological morbidity and quality of life) | ||||||
| Change in ipsilateral arm volume at each follow‐up visit was expressed as a % increase from pretreatment value. Ratios of presurgery to postsurgery arm volumes were compared on a log‐transformed scale. The contralateral arm was used as a control for evaluations of arm volume Also patient rated as mild, moderate or severe | Assessed by goniometric measurement of arm movement (flexion, abduction, internal rotation and external rotation). Changes between visits calculated by subtraction The contralateral arm was used as a control for arm and shoulder function | QoL: Fact‐B+4 Anxiety: Spielberger STAI | ||||||
| Cardiff ‐ Local | No morbidity data | |||||||
| Cardiff ‐ St Mary's | Oedema of arm 72 cm | Restricted elevation 720 degrees | Measured but not reported | Axillary pain; numbness or paraesthesia on operated sides; aesthetic appearance of axillary scar | ||||
| Arm swelling measured by water displacement, circumference 15 cm above and below the olecranon process | Shoulder mobility assessed by measuring elevation through flexion, abduction, medial and lateral rotation | Shoulder muscle power assessed using graduated spring to measure flexion, extension, abduction and adduction of the shoulder joint | ||||||
| Arm welling (arm circumference 15 cm above and 10 cm below olecranon) | Objective assessment via adduction with internal rotation; abduction with external rotation, difference in height reached between treated and non‐treated arms by stretching above head, measurement of an abduction movement without shoulder rotation whilst lying on a flat, hard surface | Power (cm/kg) of pectoralis major by repeated lifting of a 3.5 kg weight as fast as possible over 45 seconds, comparing treated and untreated arm | Sample from study only, level B evidence | |||||
| Lympheodema was assessed by comparing the circumference of the operated vs the non‐operated arm at 15 cm above the epicondyle Unclear what difference in circumference constituted lymphoedema | Assessed by the surgeon by evaluating active and passive flexion, abduction, internal and external rotation, and classified on a scale 0 (normal mobility) to 3 (severe mobility) restriction Winged scapula reported as present/absent | Axillary and arm pain reported by patients on a scale from 0 (absent) to 3 (continuous/severe) Numbness assessed by the surgeon by comparing skin sensitivity in operated and non‐operated arms. Rated 0 (absent) to 3 (severe) | ||||||
| Reports lymphoedema; categorised as none, slight, moderate and severe | Reports arm function as good, fair or poor | Reports activity as good, fair or poor | Reports attitude as good, fair or poor | Pts in no axillary surgery + RT arm reported fibrosis of breast and sometimes "marbling" of the overlying skin. Both occurred in <5% of cases | ||||
| Impairted function of the shoulder joint and swollen arm: no definitions given, but it is stated that the methodology included volumetric measurement of the upper limb and that an attempt was made to ally objective measurements with the patient’s subjective expression of discomfort or disability | Impairted function of the shoulder joint and swollen arm: no definitions given, but it is stated that the methodology included volumetric measurement of the upper limb and that an attempt was made to ally objective measurements with the patient’s subjective expression of discomfort or disability | In evaluating morbidity, attempts made to ally objective measurements with patient's subjective expression of disability or discomfort. Expectation that after RM, slight increase in volume of ipsilateral arm, or after RT, some discomfort and stiffness to shoulder, but these do not amount to morbidity | ||||||
| ≥ 5% increase in arm circumference from baseline | QOL: A core questionnaire plus a surgical module specific to this trial. Four linear analogue scales on the core questionnaire were used: well‐being, mood, appetite and perceived adjustment/coping. After 1993, 6 additional scales were added: tiredness, hot flashes, nausea/vomiting, perceived social support, arm restriction and subjective health estimation. Surgical module measured swelling, numbness, weakness, pain, stiffness, performance of daily activities and global measure of arm/hand/shoulder/chest bother | |||||||
| No definitions for functional outcomes reported | ||||||||
| No definitions for functional outcomes reported | ||||||||
| An increase in arm volume was defined as an increase > 2 cm, comparing the circumference of the operated upper limb (at 3 points: the wrist, the midpoint of the forearm and the midpoint of the upper arm) with its non‐operated counterpart | Patients were asked to lift their operated arm (maximum possible abduction): abduction ≥ 90° was considered adequate; abduction < 90° was considered abnormal | Patients were asked: Is your arm painful in a resting position (yes/no)? Does the inside of your arm feel more numb (yes/no)? | ||||||
| Arm swelling was assessed by comparing the circumference of treated and untreated arms 15 cm above the lateral epicondyle | Arm mobility was judged by asking the patient to rate restriction in movement on a scale 0 to 100 Numbness assessed by comparing skin sensitivity on inside and outside of the upper arm – classified as yes/no | Aesthetic appearance of scar judged by patient (rated good or bad) | Postoperative pain was evaluated as continuous (> 50% of the day), sporadic or absent | |||||
| Ipsilateral and contralateral measurement of arm circumference at 15 cm below the acromion process and 15 cm below the olecranon: An increase in arm circumference ≥ 2 cm in ipsilateral arm (below or above the elbow) indicated arm oedema | ||||||||
| Arm volume measured using volume of water displaced determined by the difference between treated and untreated arms (relative arm volume difference = [ipsilateral‐contralateral]/[contralateral] × 100%) | Arm mobility in degrees was determined by measuring the straight lateral abduction of both ipsilateral and contralateral arms using a standard orthopaedic goniometer to determine the angle between lateral chest wall and humerus (relative shoulder abduction deficit = [ipsilateral‐contralateral]/[contralateral] × 100%) | Numbness and tingling were assessed by self‐report by asking patients if they were currently experiencing any numbness or any tingling anywhere in ipsilateral and contralateral arms. OR of SLN compared with ALND Adverse events: no details reported | ||||||
| Arm volume measured using volume of water displaced. A cutoff of 10% increase in volume was used as the arbitrary cut point | Shoulder mobility (flexion, abduction and rotation) was determined with the help of a 360° scale placed on a wall with the centre at shoulder height | |||||||
| Arm volume was estimated using 6 measures of arm circumference at 10 cm intervals starting 10 cm from the tip of the index finger. Upper limb swelling was expressed as percentage change in volume from baseline | Abduction and flexion measured using goniometer Arm morbidity measured using the 15‐item SSSS scale developed for the study, with each rated from 0 (no trouble at all) to 10 (worst I can imagine) and averaged to obtain overall score | |||||||
| Increase in circumference of forearm by at least 3 cm | Failure to abduct the arm beyond a right angle | |||||||
| Postoperative swelling: middle grade (diameter is 3–6 cm enlargement on the involved upper arm or forearm compared with the contralateral part) |
| Study | Outcome | Measurement | Follow‐up period 1 | Follow‐up period 2 | Notes |
| Wound infection | Determined by treating physician | SLND: 11/371; SLND + ALND: 31/373 | |||
| Axillary seroma | Determined by treating physician | SLND: 21/371; SLND + ALND: 53/373 | |||
| Brachial plexus injury | Determined by treating physician | At 6 months: SLND: 3/415; SLND + ALND: 5/406 At 1 year: SLND: 0/415; SLND + ALND: 1/406 | |||
| Axillary paraesthesia | Patient reported | 30 days: SLND: 43/371; SLND + ALND: 174/373 | 6 months: SLND: 35/288; SLND + ALND: 146/335 | ||
| Axillary paraesthesia | Patient reported | 12 months: SLND: 24/268; SLND + ALND: 113/287 | |||
| Lymphoedema (objective) | Arm measurement | 30 days: SLND: 17/272; SLND + ALND: 23/255 | 6 months: SLND: 21/271; SLND + ALND: 29/270 | ||
| Lymphoedema (objective) | Arm measurement | 12 months: SLND: 14/226; SLND + ALND: 26/242 | |||
| Lymphoedema (subjective) | Patient reported/physician diagnosis | 6 months: SLND: 19/339; SLND + ALND: 27/327 | 12 months: SLND: 12/268; SLND + ALND: 37/288 | ||
| Lymphoedema (subjective) | Patient reported/physician diagnosis | > 12 months: SLND: 14/253; SLND + ALND: 52/272 | |||
| Mild oedema | Follow‐up was at least 12 months in most cases. ALND = 7/91; Simple = 5/113 | ||||
| Stiff shoulder | ALND = 6/91; Simple = 8/113 | ||||
| Skin graft | Need for skin graft | ALND = 4/91; Simple = 2/113 | |||
| Delayed healing | Need to delay postoperative RT | ALND = 18/91; Simple = 7/113 | |||
| Gross oedema | Arm measurement | ALND = 0/91; Simple = 0/113 | ALND = 12/45; Simple = 6/53 | ||
| Seroma | ALND: 33/155; SLNB: 20/143 | ||||
| Lymphoedema (objective) | Arm volume changes | 12 months: ALND: mean (SE) = 56.4 (10.9); SLNB: mean (SE) = 18.6 (13.8), difference mean (SE) = 37.8 (17.6) Mean (1, 3, 6, 12 months): ALND: mean (SE) = 53.1 (8.1); SLNB: mean (SE) = 17.7 (9.2), difference mean (SE) = 35.4 (12.2) | Max: ALND: mean (SE) = 113.7 (9.7); SLNB: mean (SE) = 78.4 (12), difference mean (SE) = 35.3 (15.3) | ||
| Lymphoedema (subjective) | Patient reported | 1 month: OR = 0.34 (95% CI 0.11 to 0.9); 3 months: OR = 0.4 (95% CI 0.16 to 0.94); 6 months: OR = 0.25 (95% CI 0.08 to 0.66) | 12 months: OR = 0.36 (95% CI 0.15 to 0.86); mean: OR = 0.3 (95% CI 0.18 to 0.68) | Odds ratios: SLNB/ALND; i.e. lower favours SLNB | |
| Paraesthesia | ALND: 130/155; SLNB: 92/140 | ||||
| Numbness | ALND: 115/155; SLNB: 68/143 | ||||
| Loss of pinprick | ALND: 118/155; SLNB: 77/140 | ||||
| Loss of light touch | ALND: 121/155; SLNB: 81/140 | ||||
| QOL (immediate postop) | Study authors note QOL scores were usually higher (better) in the SLND group and significantly so in the immediate postoperative period (P < 0.01). No significant effect of node positive/negative | ||||
| MAC scale (12 months) | Study authors no significant difference in MAC scores during 1 year follow‐up. No significant effect of node positive/negative | ||||
| BSI – somatisation (immediate postop) | SLND group scored lower (better) than ALND in the immediate postoperative period (P < 0.001) | ||||
| Quality of life | GSI level | 12 months: ALND: mean (SE, N) = 49.7 (1.1, 143); SLNB: mean (SE, N) = 48.4 (0.9, 134), difference mean (SE) = 1.3 (1.4) | OR for morbid GSI: study/control (95% CI) 0.55 (0.08 to 2.94) | ||
| Quality of life | SF‐36 (immediate postoperative) | Physical combined: ALND: mean (SD, N) = 38.6 (8.2, 143); SLNB: mean (SD, N) = 42.3 (10.4, 134), difference mean (95% CI) = 3.7 (1.2 to 6.1) Physical functioning: ALND: mean (SD, N) = 41.3 (9, 143); SLNB: mean (SD, N) = 44.5 (8.1, 134), difference mean (95% CI) = 3.2 (1.1 to5.4) | Vitality: ALND: mean (SD, N) = 48.2 (10.2, 143); SLNB: mean (SD, N) = 51.8 (9.8, 134), difference mean (95% CI) = 3.7 (1.1 to 6.2) | ||
| Shoulder movement (mean reduction) | Flexion, extension, abduction, internal rotation, external rotation | Flexion: ALND: mean (SD, N) = 13 (32.9, 141); SLNB: mean (SD, N) = 6.7 (15.6, 134), difference mean (95% CI) = 6.3 (0.1 to 12.6); Extension: ALND: mean (SD, N) = ‐1.5 (10.7, 139); SLNB: mean (SD, N) = ‐2.2 (8.1, 134), difference mean (95% CI) = 0.7 (‐1.5 to 3.3); Abduction: ALND: mean (SD, N) = 6.3 (11.5, 138); SLNB: mean (SD, N) = 3.1 (15.7, 132), difference mean (95% CI) = 3.2 (‐0.5 to 6.3) | Internal rotation: ALND: mean (SD, N) = 1.7 (12.7, 139); SLNB: mean (SD, N) = 0.3 (12, 134), difference mean (95% CI) = 1.4 (‐1.5 to 4.4); External rotation: ALND: mean (SD, N) = 2.9 (12.3, 139); SLNB: mean (SD, N) = 1.5 (11, 134), difference mean (95% CI) = 1.4 (‐1.5 to 4.4) | ||
| Axillary drain usage | ALND: 359/453; SLNB: 75/449 | ||||
| Infection rate of surgical wounds | ALND: 72/476; SLNB: 52/478 | ||||
| Lymphoedema | Patient‐assessed; moderate/severe | 1 month: ALND: 7/419; SLNB: 1/428 3 months: ALND: 12/395; SLNB: 4/417 | 6 months: ALND: 13/414; SLNB: 2/432 12 months: ALND: 10/403 SLNB: 4/412 | ||
| Lymphoedema | Mean (95% CI) change in arm vol compared with pretreatment | 1 month: ALND = 1.022 (1.013‐1.032); SLNB = 1.003 (0.997‐1.01) 3 months: ALND = 1.044 (1.035‐1.053); SLNB = 1.019 (1.01‐1.028) | 6 months: ALND = 1.058 (1.048‐1.069); SLNB = 1.022 (1.011‐1.032) 12 months: ALND = 1.061 (1.048‐1.074); SLNB = 1.028 (1.016‐1.039) | ||
| Sensory loss | Median area of sensory loss (cm2; range) | 1 month: ALND = 40 (1‐489); SLNB = 32 (2‐254) 3 months: ALND = 47 (0‐1139); SLNB = 48 (0‐327) | 6 months: ALND = 39 (0.4‐2827); SLNB = 32 (0‐201) 12 months: ALND = 35 (0.8‐1013); SLNB = 59 (0.2‐342) | Event rates for self‐assessed sensory loss also reported in Mansel 2006 for these follow‐up periods, but not extracted | |
| Intercostobrachial nerve damage | Clinician assessment; severe | 1 month: ALND: 10/392; SLNB: 6/409 3 months: ALND: 10/373; SLNB: 4/397 | 6 months: ALND: 10/394; SLNB: 4/410 12 months: ALND: 5/384 SLNB: 5/400 | ||
| Shoulder function | Mean change in shoulder function (degrees): flexion | 1 month: ALND = 9.8; SLNB = 5.8 3 months: ALND = 3.7; SLNB = 2 | 6 months: ALND = 1.6; SLNB = 2 12 months: ALND = 0.1; SLNB = 2.7 | 95% CI can also be extracted | |
| Shoulder function | Mean change in shoulder function (degrees): abduction | 1 month: ALND = 12.9; SLNB = 6.5 3 months: ALND = 4.2; SLNB = 1.9 | 6 months: ALND = 2.3; SLNB = 1.5 12 months: ALND = 1.9; SLNB = 2.5 | 95% CI can also be extracted | |
| Shoulder function | Mean change in shoulder function (degrees): external rotation | 1 month: ALND = 1.2; SLNB = 0.7 3 months: ALND = 1.2; SLNB = 0.2 | 6 months: ALND = 1; SLNB = 0.6 12 months: ALND = 0.7; SLNB = 0.6 | 95% CI can also be extracted | |
| Shoulder function | Mean change in shoulder function (degrees): internal rotation | 1 month: ALND = 0.9; SLNB = 0.4 3 months: ALND = 0.7; SLNB = 1 | 6 months: ALND = 0.8; SLNB = 0.2 12 months: ALND = 0.4; SLNB = 1.7 | 95% CI can also be extracted | |
| Quality of life | Measures: mean trial outcome index; trial outcome index reduced by ≥ 5 points from baseline (n/N); mean arm functioning subscale score; substantial arm swelling or tenderness (n/N); substantial numbness on ipsilateral side (n/N); mean FACT‐B+4 score | Means (95% CI) and event rates can be extracted for each time point (baseline, 1, 3, 6 and 12 months) | |||
| State and trait anxiety | Mean and 95% CI can be extracted for each time point (baseline, 1, 3, 6 and 12 months) | ||||
| Morbidity | Objective complaints: restricted elevation 720 degrees | Not stated: full axillary surgery, neg nodes = 25% (×2 = 7.47, P < 0.01); no axilary surgery, neg nodes = 0%; full axillary surgery + radical RT, positive nodes = 67%; no axillary surgery + local RT = 37% | Sample of 85 patients only from Cardiff site | ||
| Morbidity | Objective complaints: oedema of arm, 72 cm | Not stated: full axillary surgery, neg nodes = 46% (×2 = 6.02, P < 0.03); no axillary surgery, neg nodes = 15%; full axillary surgery + radical RT, positive nodes = 58%; no axillary surgery + local RT = 37% | Sample of 85 patients only from Cardiff site | ||
| Morbidity | Subjective complaints: limited arm movement | Not stated: full axillary surgery, neg nodes = 21%; no axillary surgery, neg nodes = 8%; full axillary surgery + radical RT, positive nodes = 8%; no axillary surgery + local RT = 21% | Sample of 85 patients only from Cardiff site | ||
| Morbidity | Subjective complaints: swollen arm | Not stated: full axillary surgery, neg nodes = 43%; no axillary surgery, neg nodes = 23%; full axillary surgery + radical RT, positive nodes = 58%; no axillary surgery + local RT = 37% | Sample of 85 patients only from Cardiff site | ||
| Morbidity | Lateral shoulder rotation (mean (SE) difference (cm) from preoperative value (N)) | 6 months: Sampling + RT: 1.91 (SE = 0.56) (N = 64), sampling ‐ RT: 0.34 (SE = 0.59) (N = 59); ALND: 0.13 (SE = 0.39) (N = 132) | 12 months: Sampling + RT: 1.75 (SE = 0.56) (N = 66), Sampling ‐ RT: 0.72 (SE = 0.62) (N = 55); ALND: 0.77 (0.4) (N = 128) | Figure 4, Chetty 2000 paper | |
| Morbidity | Lateral shoulder rotation (mean (SE) difference (cm) from preoperative value (N)) | 24 months: Sampling + RT: 1.57 (SE = 0.6) (N = 60), Sampling ‐ RT: ‐0.48 (SE = 0.65) (N = 52); ALND: 0.38 (SE = 0.43) (N = 117) | 36 months: Sampling + RT: 2.19 (SE = 0.59) (N = 59), Sampling ‐ RT: 0.43 (SE = 0.64) (N = 50); ALND: 0.24 (SE = 0.43) (N = 110) | Figure 4, Chetty 2000 paper | |
| Morbidity | Arm volume (mean (SE) percentage of preoperative arm volume (N)) | 6 months: Sampling + RT: 100.69 (SE = 0.779) (N = 56), Sampling ‐ RT: 102.04 (SE = 0.766) (N = 58); ALND: 103.57 (SE = 0.519) (N = 126) | 12 months: Sampling + RT: 100.95 (SE = 0.81) (N = 59), Sampling ‐ RT: 102.47 (SE = 0.85) (N = 54); ALND: 103.74 (SE = 0.57) (N = 119) | Figure 5, Chetty 2000 paper | |
| Morbidity | Arm volume (mean (SE) percentage of preoperative arm volume (N)) | 24 months: Sampling + RT: 100.84 (SE = 1.03) (N = 54), Sampling ‐ RT: 100.81 (SE = 1.06) (N = 51); ALND: 104.37 (SE = 0.73) (N = 108) | 36 months: Sampling + RT: 100.01 (SE = 1.03) (N = 52), Sampling ‐ RT: 101.28 (SE = 1.07) (N = 48); ALND: 104.07 (SE = 0.73) (N = 103) | Figure 5, Chetty 2000 paper | |
| Morbidity | Subjective arm | Not stated; full axillary surgery, positive node (Nil 8/12; intermittent 1/12; persistent 3/12); full axillary surgery, ‐negative node (nil 22/28; intermittent 1/28; persistent 5/28); Sample + RT, positive node (nil 17/28; intermittent 2/28; persistent 9/28); Sample, negative node (nil 23/26; intermittent 1/26; persistent 2/26) | Morbidity data to be included in discussion only; sample chosen from alphabetical pt list of patients free of local or systemic disease | ||
| Morbidity | Subjective mobility | Not stated; full axillary surgery, positive node (normal 12/12; reduced 0/12); full axillary surgery, negative node (normal 22/28; reduced 6/28); Sample + RT, negative node (normal 12/28; reduced 16/28); Sample, negative node (normal 24/26; reduced 2/26) | See comments in Aitken paper | ||
| Morbidity | Subjective interference with daily activities | Not stated; full axillary surgery, positive node (nil 12/12; occasional 0/12; severe 0/12); full axillary surgery, negative node (nil 24/28; occasional 4/28; severe 0/28); Sample + RT, positive node (nil 16/28; occasional 8/28; severe 4/28); Sample, negative node (nil 24/26; occasional 4/26; severe 0/26) | See comments in Aitken paper | ||
| Morbidity | Objective assessment ‐ shoulder joint mobility | See comments in Aitken paper | |||
| Psychological morbidity | Use in discussion only | ||||
| Lymphoedema | Assessed by physician, reported as odds ratio (95% CI): SLNB/ALND | 6 months: 0.37 (0.2 to 0.7) 12 months: 0.48 (0.2 to 0.9) | 18 months: 0.59 (0.3 to 1.2) 24 months: 0.52 (0.2 to 1.1) | ||
| Shoulder movement restriction | Assessed by physician, reported as odds ratio (95% CI): SLNB/ALND | 6 months: 0.47 (0.3 to 0.8) 12 months: 0.73 (0.4 to 1.4) 12 months: raw data extracted from graph (SLNB 17/336, ALND 23/341) | 18 months: 0.62 (0.3 to 1.3) 24 months: 0.44 (0.2 to 1.0) | ||
| Axillary/arm pain | Assessed by physician, reported as odds ratio (95% CI): SLNB/ALND | 6 months: 0.52 (0.3 to 0.8) 12 months: 0.76 (0.5 to 1.3) 12 months: raw data extracted from graph (SLNB 30/336, ALND 39/341) | 18 months: 0.84 (0.5 to 1.5) 24 months: 0.90 (0.5 to 1.6) | ||
| Numbness | Assessed by physician, reported as odds ratio (95% CI): SLNB/ALND | 6 months: 0.64 (0.4 to 0.9) 12 months: 0.53 (0.3 to 0.8) 12 months: raw data extracted from graph (SLNB 41/336, ALND 71/341) | 18 months: 0.37 (0.2 to 0.6) 24 months: 0.54 (0.3 to 0.9) | ||
| Winged scapula | Assessed by physician | Study authors report rate too low to analyse | |||
| Health‐related quality of life: SF‐36 – physical component | Assessed by patients using validated questionnaires | No significant differences found between group means of SF‐36 physical component (Del Bianco, 2008) | |||
| Health‐related quality of life: SF‐36 – mental component | Assessed by patients using validated questionnaires | No significant differences found between group means of SF‐36 mental component (Del Bianco, 2008) | |||
| Health‐related quality of life: SF‐36 HRQOL domains | Assessed by patients using validated questionnaires | No significant differences found between groups on all HRQOL domains of SF‐36 (Zavagno, 2008) | |||
| Health‐related quality of life: psychological general well‐being index | Assessed by patients using validated questionnaires | 6, 12 months: significantly better PGWB general and anxiety domain scores in SLNB group than in ALND group (Del Bianco, 2008) | 24 months: no significant differences between PGWB general and anxiety domain scores of both groups.(Del Bianco, 2008) | ||
| Morbidity | Arm function | 3 months: ALND: Good: 44/90, Fair: 41/90, Poor: 5/90; No ALND: Good: 59/77, Fair: 18/77, Poor: 0/77 | 15 months: ALND: Good: 83/100, Fair: 14/100, Poor: 3/100; No ALND: Good: 70/88, Fair: 17/88, Poor: 1/88 | Sample only | |
| Morbidity | Lymphoedema | 3 months: ALND: None: 18/93, Slight: 66/93, Moderate: 6/93, Severe: 3/93; No ALND: None: 36/81, Slight: 43/81, Moderate: 0/81, Severe: 2/81 | 15 months: ALND: None: 27/104, Slight: 71/104 Moderate: 6/104, Severe: 0/104; No ALND: None: 39/91, Slight: 52/91, Moderate: 0/91, Severe: 0/91 | Sample only | |
| Morbidity | Activity | 3 months: ALND: Good: 45/92, Fair: 46/92, Poor: 1/92; No ALND: Good: 62/80, Fair: 16/80, Poor: 2/80 | 15 months: ALND: Good: 85/101, Fair: 14/101, Poor: 2/101; No ALND: Good: 78/92, Fair: 13/92, Poor: 1/92 | Sample only | |
| Morbidity | Attitude | 3 months: ALND: Good: 81/92, Fair: 9/92, Poor: 2/92; No ALND: Good: 71/80, Fair: 7/80, Poor: 2/80 | 15 months: ALND: Good: 91/101, Fair: 8/101, Poor: 2/101; No ALND: Good: 87/92, Fair: 5/92, Poor: 0/92 | Sample only | |
| Postoperative deaths | Radical: 0/95; Simple: 0/100 | ||||
| Morbidity | Shoulder function | At 4‐year minimum follow‐up in survivors: Radical: 6/95; Simple = 18/100 | Consequential morbidity, at time of publication Methodology not reported, all patients included | ||
| Morbidity | Arm swelling (including volumetric measurement of upper limb) | At 4‐year minimum follow‐up in survivors: Radical: 7/95; Simple = 3/100 | Consequential morbidity, at time of publication Methodology not reported, all patients included | ||
| Lymphoedema | Physician reported | Not significantly different between treatments | |||
| Arm circumference | Physician reported | Not significantly different between treatments | |||
| Performance of daily activities | Physician reported | Not significantly different between treatments | |||
| Arm pain | Physician reported | Baseline: ALND 5/175, surgery 8/194; 1st postoperative: ALND 38/164, surgery 12/168; 3 months: ALND 16/161, surgery 9/171; 6 months: ALND 17/174, surgery 11/177 | 9 months: ALND 21/160, surgery 8/164; 12 months: ALND 13/189, surgery 8/190; 18 months: ALND 14/173, surgery 7/183; 24 months: ALND 12/165, surgery 8/164 | ||
| Restricted arm movement | Physician reported | Baseline: ALND 9/174, surgery 6/194; 1st postoperative: ALND 64/163, surgery 25/168; 3 months: ALND 23/161, surgery 10/170; 6 months: ALND 21/176, surgery 9/176 | 9 months: ALND 21/160, surgery 7/163; 12 months: ALND 19/188, surgery 6/187; 18 months: ALND 10/171, surgery 7/182; 24 months: ALND 12/165, surgery 7/164 | ||
| QOL ‐ bothered scores | Patient reported | No significant differences at any time point (baseline, 1st postoperative, 3, 6, 9, 12, 18 and 24 months) | |||
| QOL ‐ arm movement scores | Patient reported | At 1st postoperative surgery alone, reported less restriction in use of their arm than ALND (P < .0001). Otherwise, no significant differences | |||
| QOL ‐ numbness scores | Patient reported | At 1st postoperative surgery alone, reported less severe postsurgery numbness than ALND (P < .0001). Otherwise, no significant differences | |||
| QOL ‐ coping scores | Patient reported | No significant differences at any time point (baseline, 1st postoperative, 3, 6, 9, 12, 18 and 24 months) | |||
| Postoperative infection | Physician assessed | Surgery alone: 0/467 ALND: 1/464 | |||
| Sensory neuropathy | Physician assessed | Any: Surgery alone: 55/453 ALND: 82/447 Grade 3‐4: Surgery alone: 0/453 ALND: 1/447 | |||
| Lymphoedema | Physician assessed | Defined as long term: Any: Surgery alone: 15/453 ALND: 59/447 Grade 3‐4: Surgery alone: 0/453 ALND: 3/447 | |||
| Motor neuropathy | Physician assessed | Any: Surgery alone: 13/453 ALND: 37/447 Grade 3‐4: Surgery alone: 1/453 ALND: 3/447 | |||
| Arm fatigue | Unclear | Moderate/severe: no ALND: N = 4/258; ALND: N = 24/273 | |||
| Shoulder mobility | Unclear | Restricted somewhat or severely: no ALND: N = 5/257; ALND: N = 21/271 | |||
| Parasthesia | Unclear | Moderate/severe: no ALND: N = 6/258; ALND: N = 41/274 | |||
| Lymphoedema | Unclear | Minor/major difference: no ALND: N = 3/258; ALND: N = 29/275 | |||
| Other functional impairments | Unclear | Minor/major: no ALND: N = 12/263; ALND: N = 16/276 | |||
| Number of patients with functional impairments | Unclear | Minor: no ALND: N = 23/265; ALND: N = 78/278 | |||
| Upper limb circumference > 2 cm | Measured as per definition | 6 months: Obs: 6/57; ALND: 10/49 12 months: Obs: 8/57; ALND: 15/49 | 24 months: Obs: 8/57; ALND: 14/49 48 months: Obs: 4/57; ALND: 19/49 | ||
| Pain at rest | Patient reported | 6 months: Obs: 9/57; ALND: 9/49 12 months: Obs: 11/57; ALND: 14/49 | 24 months: Obs: 9/57; ALND: 10/49 48 months: Obs: 3/57; ALND: 7/49 | ||
| Parasthesias | Patient reported? | 6 months: Obs: 10/57; ALND: 28/49 12 months: Obs: 6/57; ALND: 29/49 | 24 months: Obs: 5/57; ALND: 34/49 48 months: Obs: 6/57; ALND: 30/49 | ||
| Shoulder dysfunction | Measured as per definition | 6 months: Obs: 5/57; ALND: 5/49 12 months: Obs: 4/57; ALND: 8/49 | 24 months: Obs: 0/57; ALND: 6/49 48 months: Obs: 2/57; ALND: 11/49 | ||
| Morbidity | Axillary pain (sporadic/continuous) | 6 months: ALND: 91/100; SNLB = 16/100 | 24 months: ALND: 39/100; SNLB = 8/100 | ||
| Morbidity | Numbness/Parasthesia on operated side | 6 months: ALND: 85/100; SNLB = 2/100 | 24 months: ALND: 68/100; SNLB = 1/100 | ||
| Morbidity | Arm mobility, 80%‐100% | 6 months: ALND: 73/100; SNLB = 100/100 | 24 months: ALND: 79/100; SNLB = 100/100 | ||
| Morbidity | Arm mobility, 60%‐79% | 6 months: ALND: 22/100; SNLB = 0/100 | 24 months: ALND: 18/100; SNLB = 0/100 | ||
| Morbidity | Arm mobility, 40%‐59% | 6 months: ALND: 5/100; SNLB = 0/100 | 24 months: ALND: 2/100; SNLB = 0/100 | ||
| Morbidity | Arm mobility, 20%‐39% | 6 months: ALND: 0/100; SNLB = 0/100 | 24 months: ALND: 1/100; SNLB = 0/100 | ||
| Morbidity | Arm mobility, < 20% | 6 months: ALND: 0/100; SNLB = 0/100 | 24 months: ALND: 0/100; SNLB = 0/100 | ||
| Morbidity | Aesthetic appearance of axillary scar: bad | 6 months: ALND: 9/100; SNLB = 2/100 | 24 months: ALND: 15/100; SNLB = 0/100 | ||
| Morbidity | Arm swelling < 1 cm difference in circumference | 6 months: ALND: 44/100; SNLB = 11/100 | 24 months: ALND: 38/100; SNLB = 6/100 | ||
| Morbidity | Arm swelling 1‐2 cm difference in circumference | 6 months: ALND: 17/100; SNLB = 0/100 | 24 months: ALND: 25/100; SNLB = 1/100 | ||
| Morbidity | Arm swelling >2 cm difference in circumference | 6 months: ALND: 8/100; SNLB = 0/100 | 24 months: ALND: 12/100; SNLB = 0/100 | ||
| Morbidity | Arm swelling, any | 6 months: ALND: 69/100; SNLB = 11/100 | 24 months: ALND: 75/100; SNLB = 7/100 | ||
| Arm oedema | Arm swelling ≥ 2 cm difference in circumference | No. of patients with data: ALND: N = 577; no ALND + RT: N = 568 no ALND: N = 312 both node + and node‐ patients. Final measurement was 2 to 5 years after surgery Arm oedema recorded at least once: ALND: 58.1%; no ALND + RT: 38.2%; no ALND: 39.1% (P < 0.001) Oedema always: ALND: 3.6%; no ALND + RT: 0.9%; no ALND: 1% No measurement after first oedema: ALND: 9.2%; no ALND + RT: 5.8%; no ALND: 3.2% Oedema always after first oedema: ALND: 6.1%; no ALND + RT: 3.2%; no ALND: 2.6% Intermittent, final measurement oedema: ALND: 11.8%; no ALND + RT: 4.9%; no ALND: 8.6%; Total with oedema on final measurement: ALND: 30.7%; no ALND + RT: 14.8%; no ALND: 15.4% (P < 0.001) | Oedema once, then resolution: ALND: 15.9%; no ALND + RT: 15.3%; no ALND: 16.7% Intermittent, final measurement no oedema: ALND: 11.4%; no ALND + RT: 8.1%; no ALND: 7.1% Total with no oedema on final measurement (after at least 1 measurement of oedema): ALND: 27.3%; no ALND + RT: 23.4%; no ALND: 23.8 Arm oedema ≥ 4 cm difference in circumference recorded at least once: ALND: 21.5%; no ALND + RT: 11.4%; no ALND: 13.1% | ||
| Adverse events (grade 3 or greater surgery related) | No details reported | ALND: 14/2788 SLN: 12/2800 Must include most of SLN positive and negative patients | Peri‐surgery | ||
| Arm mobility/shoulder abduction deficit (objective) | Physician assessed | 6 months: < 5%: ALND: 1299/1667; SLN: 1468/1744 5%‐10%: ALND: 218/1667; SLN: 176/1744 ≥ 10%: ALND: 150/1667; SLN: 99/1744 | |||
| Arm volume difference (objective) | Physician assessed | 6 months: < 5%: ALND: 1187/1677; SLN: 1363/1759 5%‐10%: ALND: 277/1677; SLN: 236/1759 ≥ 10%: ALND: 211/1677; SLN: 158/1759 | 12 months: < 5%: ALND: 1170/1639; SLN: 1345/1705 5%‐10%: ALND: 252/1639; SLN: 215/1705 ≥ 10%: ALND: 216/1639; SLN: 147/1705 | These data are also available for 18 and 30 months | |
| Arm volume difference (objective) | Physician assessed | 24 months: < 5%: ALND: 1062/1517; SLN: 1184/1504 5%‐10%: ALND: 243/1517; SLN: 197/1504 ≥ 10%: ALND: 212/1517; SLN: 123/1504 | 36 months: < 5%: ALND: 990/1421; SLN: 1156/1459 5%‐10%: ALND: 227/1421; SLN: 194/1459 ≥ 10%: ALND: 203/1421; SLN: 109/1459 | These data are also available for 18 and 30 months | |
| Tingling (subjective) | Self‐reported | 6 months: ALND (N = 388/1693), SLN (N = 184/1766) 12 months: ALND (N = 305/1640), SLN (N = 158/1713) 18 months: ALND (N = 272/1566), SLN (N = 138/1638) | 24 months: ALND (N = 236/1521), SLN (N = 137/1588) 30 months: ALND (N = 219/1448), SLN (N = 116/1502) 36 months: ALND (N = 193/1431), SLN (N = 110/1463) | ||
| Numbness (subjective) | Self‐reported | 6 months: ALND (N = 821/1693), SLN (N = 257/1769) 12 months: ALND (N = 679/1641), SLN (N = 216/1713) 18 months: ALND (N = 592/1567), SLN (N = 174/1638) | 24 months: ALND (N = 554/1523), SLN (N = 157/1587) 30 months: ALND (N = 473/1450), SLN (N = 137/1504) 36 months: ALND (N = 445/1430), SLN (N = 119/1463) | ||
| Shoulder abduction deficit ≥ 5% (in those with < 5% at baseline) | Physician assessed | 6 months: ALND (N = 275/1449), SLN (N = 201/1519) | |||
| Shoulder abduction deficit ≥ 5% (in those with < 5% at baseline) | Physician assessed | 36 months: ALND (N = 314/1136), SLN (N = 192/1151) | |||
| Numbness (in those with none at baseline) | Self‐reported | 36 months: ALND (N = 407/1336), SLN (N = 103/1371) | |||
| Tingling (in those with none at baseline) | Self‐reported | 36 months: ALND (N = 175/1329), SLN (N = 90/1343) | |||
| Seroma | Patients with percutaneous aspiration in outpatient department | ALND: 17/50; sampling: 10/50 | Adverse events reported only for the 1987‐89 sample; i.e. for N = 100/200 | ||
| Postoperative discharge (mL), median (range) | ALND: 250 (25‐1610); sampling: 130 (0‐1785) | Adverse events reported only for the 1987‐89 sample; i.e. for N = 100/200 | |||
| Duration of postop drainage (days) (median, range) | ALND: 4 (1‐11); sampling: 2.1 (1 ‐11) | Adverse events reported only for the 1987‐89 sample; i.e. for N = 100/200 | |||
| Arm volume increase | ≥ 10% | ALND: 14/47; sampling: 0/48 | Adverse events reported only for the 1987‐89 sample; i.e. for ca N = 100/200 | ||
| Subjective sensation of swelling in women without objective increase in arm volume | Any | ALND: 12/33; sampling: 9/48 | Adverse events reported only for the 1987‐89 sample; i.e. for ca N = 100/200 | ||
| Shoulder mobility (mean decrease compared with baseline) | 7.5° decrease for whole sample of 95 patients | Adverse events reported only for the 1987‐89 sample; i.e. for ca N = 100/200 | |||
| Axillary paraesthesia (impairment of sensibility in the axilla) | ALND: 17/48; sampling: 19/48 | Adverse events reported only for the 1987‐89 sample; i.e. for ca N = 100/200 | |||
| Inner upper arm paraesthesia (impairment of sensibility in the inner upper arm) | ALND: 24/48; sampling: 4/48 | Adverse events reported only for the 1987‐89 sample; i.e. for ca N = 100/200 | |||
| Delayed healing | ALND: 27/100; Simple + RT: 8/100 | ||||
| Haematoma | ALND: 24/100; Simple + RT: 6/100 | ||||
| Infection | ALND: 9/100; Simple + RT: 6/100 | ||||
| DVT | ALND: 4/100; Simple + RT: 1/100 | ||||
| Pulmonary embolism | ALND: 1/100; Simple + RT: 1/100 | ||||
| Chest infection | ALND: 6/100; Simple + RT: 3/100 | ||||
| Severe skin reaction | ALND: 0/100; Simple + RT: 5/100 | ||||
| Nausea and vomiting | ALND: 0/100; Simple + RT: 2/100 | ||||
| Tracheitis | ALND: 0/100; Simple + RT: 2/100 | ||||
| Skin grafts | ALND: 10/100; Simple + RT: 0/100 | ||||
| Arm oedema | ALND: 10/100; Simple + RT: 5/100 | ||||
| Limitation of shoulder movement | ALND: 4/100; Simple + RT: 14/100 | ||||
| Haematoma | Any | ALND: 30/539; SLNB: 38/544 | |||
| Seroma | Any | ALND: 195/539; SLNB: 93/544 | |||
| Infection | Any | ALND: 73/539; SLNB: 48/544 | |||
| Arm morbidity | Mean changes in arm morbidity (patient reported, overall summary average score of 15 items; unclear if it is SEM or SD reported) from baseline | Node+ and node‐ patients: average of measures taken at 6 and 12 months: ALND: 7 (N = 457); SLNB: 4.4 (N = 456) 1 month: ALND: 2.2 (0.2); SLNB: 1.4 (0.15) 6 months: ALND: 1.1 (0.2); SLNB: 0.8 (0.15) 12 months: ALND: 1.05 (0.2); SLNB: 0.8 (0.15) | 24 months: ALND: 1.05 (0.2); SLNB: 0.75 (0.15) 36 months: ALND: 1.05 (0.2); SLNB: 0.7 (0.15) | ||
| Arm symptoms | Mean changes in arm symptoms (patient reported, average of 7 items; unclear if it is SEM or SD reported) from baseline | Node+ and node‐ patients: average of measures taken at 6 and 12 months: ALND: 9.7 (N = 457); SLNB: 5.5 (N = 456) 1 month: ALND: 2.1 (0.2); SLNB: 1.2 (0.1) 6 months: ALND: 1.3 (0.15); SLNB: 0.8 (0.1) 12 months: ALND: 1.25 (0.15); SLNB: 0.7 (0.1) | 24 months: ALND: 1.25 (0.15); SLNB: 0.7 (0.1) 36 months: ALND: 1.2 (0.2); SLNB: 0.65 (0.15) | ||
| Arm swelling | Mean changes in arm swelling (patient reported, 1 item; unclear if it is SEM or SD reported) from baseline | Node+ and node‐ patients: average of measures taken at 6 and 12 months: ALND: 7.3 (N = 457); SLNB: 3.4 (N = 456) 1 month: ALND: 1.25 (0.2); SLNB: 0.75 (0.15) 6 months: ALND: 0.9 (0.15); SLNB: 0.55 (0.1) 12 months: ALND: 0.95 (0.15); SLNB: 0.45 (0.1) | 24 months: ALND: 1 (0.2); SLNB: 0.55 (0.15) 36 months: ALND: 1 (0.2); SLNB: 0.55 (0.15) | ||
| Arm dysfunctions | Mean arm dysfunctions change (patient reported, average of 3 items; unclear if it is SEM or SD reported) from baseline | Node+ and node‐ patients: average of measures taken at 6 and 12 months: ALND: 5.5 (N = 457); SLNB: 3.6 (N = 456) 1 month: ALND: 1.9 (0.15); SLNB: 1.35 (0.15) 6 months: ALND: 0.8 (0.1); SLNB: 0.65 (0.1) 12 months: ALND: 0.75 (0.1); SLNB: 0.6 (0.1) | 24 months: ALND: 0.7 (0.1); SLNB: 0.55 (0.1) 36 months: ALND: 0.8 (0.1); SLNB: 0.5 (0.1) | ||
| Arm disabilities | Mean arm disabilities (patient‐reported change, average of 4 items; unclear if it is SEM or SD reported) from baseline | Node+ and node‐ patients: average of measures taken at 6 and 12 months: ALND: 3.4 (N = 457); SLNB: 2.9 (N = 456) 1 month: ALND: 2.2 (0.2); SLNB: 1.4 (0.15) 6 months: ALND: 0.75 (0.1); SLNB: 0.55 (0.1) 12 months: ALND: 0.65 (0.1); SLNB: 0.45 (0.1) | 24 months: ALND: 0.6 (0.1); SLNB: 0.5 (0.1) 36 months: ALND: 0.7 (0.1); SLNB: 0.45 (0.1) | ||
| Arm volume | Increase in arm volume (percentage change from clinician ratings from baseline; unclear if it is SEM or SD reported) | Average of measures taken at 6 and 12 months: ALND: 4.2% (N = 509); SLNB: 2.8% (N = 519) All patients: 1 month: ALND: 0.8% (0.4); SLNB: 0.9% (0.4), P = 0.67 6 months: ALND: 3.5% (0.8); SLNB: 2.4% (0.7), P = 0.02 12 months: ALND: 4.6% (0.8); SLNB: 3% (0.8), P = 0.001 Node‐negative patients: 1 month: ALND: 0.8% (0.4); SLNB: 0.3% (0.4), P = 0.16 6 months: ALND: 3.5% (0.8); SLNB: 1.9% (0.5), P = 0.004 12 months: ALND: 4.6% (0.8); SLNB: 2.2% (0.7), P = 0.001 | All patients: 24 months: ALND: 5.8% (1); SLNB: 3.9% (0.7), P = 0.006 36 months: ALND: 5.8% (1); SLNB: 4.0% (1), P = 0.02 Node‐negative patients: 24 months: ALND: 5.8% (1); SLNB: 3% (0.7), P = 0.001 36 months: ALND: 5.8% (1); SLNB: 3.1% (1), P= 0.004 | ||
| Arm volume | Number with an increase in arm volume ≥ 15% (percentage change from clinician ratings from baseline) | All patients: 1 month: ALND: 5/544; SLNB: 3/544 6 months: ALND: 29/544; SLNB:21/544 12 months: ALND: 47/544; SLNB: 29/544 (P = 0.02) Node‐negative patients only: 1 month: ALND: 4/363; SLNB: 1/356 6 months: ALND: 16/363; SLNB: 9/356 12 months: ALND: 28/363; SLNB: 13/356 (P = 0.02) | All patients: 24 months: ALND: 81/544; SLNB: /544 (P = 0.001) 36 months: ALND: 82/544; SLNB: /544 (P = 0.01) Node‐negative patients only: 24 months: ALND: 47/363; SLNB: 25/356 (P = 0.01) 36 months: ALND: 49/363; SLNB: 25/356 (P = 0.006) | ||
| Lateral abduction | Lateral abduction (change from clinician ratings from baseline; degrees; unclear if it is SEM or SD reported ‐ have assumed it is SEM for calculations) | Average of measures taken at 6 and 12 months (percentage change from baseline: ALND: 4.4% (N = 509); SLNB: 2.5% (N = 519) Node+ and node‐ patients (read off graph): Baseline: ALND: 158 (1); SLNB: 157 (1) 1 month: ALND: 131 (2); SLNB: 144 (2) 6 months: ALND: 150 (1); SLNB: 151 (1) 12 months: ALND: 150 (1); SLNB: 151 (1) | Node+ and node‐ patients (read off graph): 24 months: ALND: 151 (1); SLNB: 152 (1) 36 months: ALND: 150 (1); SLNB: 151 (1) | ||
| Forward flexion | Forward flexion (degrees; unclear if it is SEM or SD reported ‐ have assumed it is SEM for calculations) | Node+ and node‐ patients (read off graph): Baseline: ALND: 157 (1); SLNB: 158 (1) 1 month: ALND: 137 (2); SLNB: 148 (1.5) 6 months: ALND: 150 (1); SLNB: 152 (1) 12 months: ALND: 151 (1); SLNB: 151 (1) | Node+ and node‐ patients (read off graph): 24 months: ALND: 152 (1); SLNB: 152 (1) 36 months: ALND: 152 (1); SLNB: 151 (1) | ||
| Postoperative swelling (oedema) | Measurement of arm diameter | Level I clearance: 3/93 ALND: 7/88 | |||
| Involved upper limb disorder | Unclear | Level I clearance: 0/93 ALND: 0/88 | |||
| Cerebrovascular accident | Unclear | Level I clearance: 0/93 ALND: 2/88 | |||
| Cardiovascular events | Unclear | Level I clearance: 2/93 ALND: 1/88 |
| Outcome or subgroup title | No. of studies | No. of participants | Statistical method | Effect size |
| 1 All‐cause mortality (radiotherapy subgroups) Show forest plot | 10 | 3849 | Hazard Ratio (95% CI) | 1.06 [0.96, 1.17] |
| 1.1 no radiotherapy | 1 | 773 | Hazard Ratio (95% CI) | 0.96 [0.80, 1.15] |
| 1.2 radiotherapy | 9 | 3076 | Hazard Ratio (95% CI) | 1.11 [0.98, 1.25] |
| 2 All‐cause mortality (extra treatment for positive node subgroups) Show forest plot | 10 | 3849 | Hazard Ratio (95% CI) | 1.06 [0.96, 1.17] |
| 2.1 additional treatment for node‐positive patients | 3 | 1174 | Hazard Ratio (95% CI) | 1.51 [1.09, 2.09] |
| 2.2 no specific additional treatment for node‐positive patients | 7 | 2675 | Hazard Ratio (95% CI) | 1.02 [0.92, 1.13] |
| 3 Locoregional recurrence (radiotherapy subgroups) Show forest plot | 4 | 20863 | Hazard Ratio (95% CI) | 2.35 [1.91, 2.89] |
| 3.1 no radiotherapy | 1 | 7284 | Hazard Ratio (95% CI) | 2.94 [2.05, 4.23] |
| 3.2 radiotherapy | 3 | 13579 | Hazard Ratio (95% CI) | 2.11 [1.64, 2.72] |
| 4 Locoregional recurrence (extra treatment for positive‐node subgroups) Show forest plot | 4 | 20863 | Hazard Ratio (95% CI) | 2.35 [1.91, 2.89] |
| 4.1 additional treatment for node‐positive patients | 1 | 4171 | Hazard Ratio (95% CI) | 1.10 [0.69, 1.75] |
| 4.2 no specific additional treatment for node‐positive patients | 3 | 16692 | Hazard Ratio (95% CI) | 2.83 [2.25, 3.57] |
| 5 Distant metastasis Show forest plot | 2 | 946 | Hazard Ratio (95% CI) | 1.06 [0.87, 1.30] |
| 5.1 no radiotherapy | 1 | 727 | Hazard Ratio (95% CI) | 1.10 [0.89, 1.35] |
| 5.2 radiotherapy | 1 | 219 | Hazard Ratio (95% CI) | 0.64 [0.28, 1.42] |
| 6 Lymphoedema (≥ 12 months postop) ‐ fixed‐effect model Show forest plot | 4 | 1714 | Odds Ratio (M‐H, Fixed, 95% CI) | 0.31 [0.23, 0.43] |
| 6.1 additional treatment for node‐positive patients | 1 | 532 | Odds Ratio (M‐H, Fixed, 95% CI) | 0.07 [0.02, 0.22] |
| 6.2 no additional treatment for node‐positive patients | 3 | 1182 | Odds Ratio (M‐H, Fixed, 95% CI) | 0.39 [0.28, 0.54] |
| 7 Lymphoedema (≥ 12 months postop) ‐ random‐effects model Show forest plot | 4 | 1714 | Odds Ratio (M‐H, Random, 95% CI) | 0.22 [0.08, 0.57] |
| 7.1 additional treatment for node‐positive patients | 1 | 532 | Odds Ratio (M‐H, Random, 95% CI) | 0.07 [0.02, 0.22] |
| 7.2 no additional treatment for node‐positive patients | 3 | 1182 | Odds Ratio (M‐H, Random, 95% CI) | 0.40 [0.28, 0.55] |
| 8 Arm or shoulder movement impairment (≥ 12 months postop) Show forest plot | 5 | 1495 | Odds Ratio (M‐H, Fixed, 95% CI) | 0.72 [0.49, 1.05] |
| 8.1 radiotherapy | 5 | 1495 | Odds Ratio (M‐H, Fixed, 95% CI) | 0.72 [0.49, 1.05] |
| 9 Pain (≥ 12 months postop) Show forest plot | 1 | Odds Ratio (M‐H, Fixed, 95% CI) | Totals not selected | |
| 9.1 radiotherapy | 1 | Odds Ratio (M‐H, Fixed, 95% CI) | 0.0 [0.0, 0.0] | |
| 10 Paraesthesia (≥ 12 months postop) Show forest plot | 1 | Odds Ratio (M‐H, Fixed, 95% CI) | Totals not selected | |
| 10.1 radiotherapy | 1 | Odds Ratio (M‐H, Fixed, 95% CI) | 0.0 [0.0, 0.0] | |
| 11 Delayed healing Show forest plot | 1 | Odds Ratio (M‐H, Fixed, 95% CI) | Totals not selected | |
| 11.1 radiotherapy | 1 | Odds Ratio (M‐H, Fixed, 95% CI) | 0.0 [0.0, 0.0] | |
| 12 Skin graft Show forest plot | 1 | Odds Ratio (M‐H, Random, 95% CI) | Totals not selected | |
| 12.1 radiotherapy | 1 | Odds Ratio (M‐H, Random, 95% CI) | 0.0 [0.0, 0.0] | |
| 13 All‐cause mortality (allocation concealment subgroups) Show forest plot | 10 | 3849 | Hazard Ratio (95% CI) | 1.06 [0.96, 1.17] |
| 13.1 adequate allocation concealment | 4 | 1442 | Hazard Ratio (95% CI) | 0.98 [0.81, 1.18] |
| 13.2 unclear or inadequate allocation concealment | 6 | 2407 | Hazard Ratio (95% CI) | 1.09 [0.97, 1.23] |
| Outcome or subgroup title | No. of studies | No. of participants | Statistical method | Effect size |
| 1 All‐cause mortality Show forest plot | 3 | 967 | Hazard Ratio (95% CI) | 0.94 [0.73, 1.21] |
| 1.1 radiotherapy | 2 | 872 | Hazard Ratio (95% CI) | 0.84 [0.64, 1.11] |
| 1.2 no radiotherapy | 1 | 95 | Hazard Ratio (95% CI) | 1.47 [0.84, 2.56] |
| 2 Local recurrence Show forest plot | 3 | 1404 | Hazard Ratio (95% CI) | 1.41 [0.94, 2.12] |
| 2.1 radiotherapy | 2 | 659 | Hazard Ratio (95% CI) | 1.40 [0.89, 2.19] |
| 2.2 no radiotherapy | 1 | 745 | Hazard Ratio (95% CI) | 1.48 [0.58, 3.82] |
| 3 Axillary recurrence Show forest plot | 1 | Hazard Ratio (95% CI) | Totals not selected | |
| 4 Locoregional recurrence Show forest plot | 1 | Hazard Ratio (95% CI) | Totals not selected | |
| 4.1 radiotherapy | 1 | Hazard Ratio (95% CI) | 0.0 [0.0, 0.0] | |
| 4.2 no radiotherapy | 0 | Hazard Ratio (95% CI) | 0.0 [0.0, 0.0] | |
| 5 Distant metastasis Show forest plot | 1 | Hazard Ratio (95% CI) | Totals not selected | |
| 5.1 radiotherapy | 1 | Hazard Ratio (95% CI) | 0.0 [0.0, 0.0] | |
| 5.2 no radiotherapy | 0 | Hazard Ratio (95% CI) | 0.0 [0.0, 0.0] | |
| 6 Lymphoedema. Increase in arm circumference (≥ 12 months postop) Show forest plot | 1 | Odds Ratio (M‐H, Fixed, 95% CI) | Totals not selected | |
| 6.1 radiotherapy | 1 | Odds Ratio (M‐H, Fixed, 95% CI) | 0.0 [0.0, 0.0] | |
| 7 Shoulder lateral rotation (12 months postop) Show forest plot | 1 | Mean Difference (IV, Fixed, 95% CI) | Totals not selected | |
| 7.1 radiotherapy | 1 | Mean Difference (IV, Fixed, 95% CI) | 0.0 [0.0, 0.0] | |
| 8 Seroma Show forest plot | 1 | Odds Ratio (M‐H, Fixed, 95% CI) | Totals not selected | |
| 8.1 radiotherapy | 1 | Odds Ratio (M‐H, Fixed, 95% CI) | 0.0 [0.0, 0.0] | |
| Outcome or subgroup title | No. of studies | No. of participants | Statistical method | Effect size |
| 1 All‐cause mortality Show forest plot | 3 | 6352 | Hazard Ratio (95% CI) | 1.05 [0.89, 1.25] |
| 1.1 radiotherapy | 2 | 6127 | Hazard Ratio (95% CI) | 1.05 [0.88, 1.25] |
| 1.2 no radiotherapy | 1 | 225 | Hazard Ratio (95% CI) | 1.30 [0.35, 4.84] |
| 2 Local recurrence Show forest plot | 1 | Hazard Ratio (95% CI) | Totals not selected | |
| 2.1 radiotherapy | 1 | Hazard Ratio (95% CI) | 0.0 [0.0, 0.0] | |
| 2.2 no radiotherapy | 0 | Hazard Ratio (95% CI) | 0.0 [0.0, 0.0] | |
| 3 Axillary recurrence Show forest plot | 1 | Hazard Ratio (95% CI) | Totals not selected | |
| 3.1 radiotherapy | 1 | Hazard Ratio (95% CI) | 0.0 [0.0, 0.0] | |
| 4 Locoregional recurrence Show forest plot | 1 | Hazard Ratio (95% CI) | Totals not selected | |
| 4.1 radiotherapy | 1 | Hazard Ratio (95% CI) | 0.0 [0.0, 0.0] | |
| 4.2 no radiotherapy | 0 | Hazard Ratio (95% CI) | 0.0 [0.0, 0.0] | |
| 5 Distant metastasis Show forest plot | 1 | Hazard Ratio (95% CI) | Totals not selected | |
| 5.1 radiotherapy | 1 | Hazard Ratio (95% CI) | 0.0 [0.0, 0.0] | |
| 5.2 no radiotherapy | 0 | Hazard Ratio (95% CI) | 0.0 [0.0, 0.0] | |
| 6 Lymphoedema. Increase in arm circumference (≥ 12 months postop) Show forest plot | 3 | Odds Ratio (M‐H, Fixed, 95% CI) | Totals not selected | |
| 6.1 radiotherapy | 3 | Odds Ratio (M‐H, Fixed, 95% CI) | 0.0 [0.0, 0.0] | |
| 7 Lymphoedema. Patient reported (at 12 or more months postop) Show forest plot | 3 | Odds Ratio (Fixed, 95% CI) | 0.33 [0.23, 0.47] | |
| 7.1 adequate allocation concealment | 2 | Odds Ratio (Fixed, 95% CI) | 0.33 [0.22, 0.48] | |
| 7.2 unclear allocation concealment | 1 | Odds Ratio (Fixed, 95% CI) | 0.36 [0.15, 0.86] | |
| 8 Shoulder flexion (12 months postop) Show forest plot | 3 | 2257 | Mean Difference (IV, Fixed, 95% CI) | 1.55 [‐0.19, 3.29] |
| 8.1 radiotherapy | 3 | 2257 | Mean Difference (IV, Fixed, 95% CI) | 1.55 [‐0.19, 3.29] |
| 9 Shoulder abduction (12 months postop) Show forest plot | 3 | 2252 | Mean Difference (IV, Fixed, 95% CI) | ‐1.02 [‐2.79, 0.75] |
| 9.1 radiotherapy | 3 | 2252 | Mean Difference (IV, Fixed, 95% CI) | ‐1.02 [‐2.79, 0.75] |
| 10 Shoulder internal rotation (12 months postop) Show forest plot | 2 | 1227 | Mean Difference (IV, Fixed, 95% CI) | 0.50 [‐1.10, 2.09] |
| 10.1 radiotherapy | 2 | 1227 | Mean Difference (IV, Fixed, 95% CI) | 0.50 [‐1.10, 2.09] |
| 11 Shoulder external rotation (12 months postop) Show forest plot | 2 | 1227 | Mean Difference (IV, Fixed, 95% CI) | ‐0.56 [‐2.21, 1.09] |
| 11.1 radiotherapy | 2 | 1227 | Mean Difference (IV, Fixed, 95% CI) | ‐0.56 [‐2.21, 1.09] |
| 12 Subjective arm movement impairment (≥ 12 months postop) Show forest plot | 2 | 877 | Odds Ratio (M‐H, Fixed, 95% CI) | 0.38 [0.22, 0.67] |
| 12.1 radiotherapy | 2 | 877 | Odds Ratio (M‐H, Fixed, 95% CI) | 0.38 [0.22, 0.67] |
| 13 Pain (≥ 12 months postop) Show forest plot | 2 | 877 | Odds Ratio (M‐H, Fixed, 95% CI) | 0.44 [0.30, 0.67] |
| 13.1 radiotherapy | 2 | 877 | Odds Ratio (M‐H, Fixed, 95% CI) | 0.44 [0.30, 0.67] |
| 14 Paraesthesia (≥ 12 months postop) Show forest plot | 2 | 495 | Odds Ratio (M‐H, Fixed, 95% CI) | 0.15 [0.09, 0.23] |
| 14.1 radiotherapy | 2 | 495 | Odds Ratio (M‐H, Fixed, 95% CI) | 0.15 [0.09, 0.23] |
| 15 Numbness (≥ 12 months postop) Show forest plot | 3 | 1799 | Odds Ratio (M‐H, Fixed, 95% CI) | 0.43 [0.34, 0.54] |
| 15.1 radiotherapy | 3 | 1799 | Odds Ratio (M‐H, Fixed, 95% CI) | 0.43 [0.34, 0.54] |
| 16 Seroma Show forest plot | 2 | 1381 | Odds Ratio (M‐H, Fixed, 95% CI) | 0.40 [0.31, 0.51] |
| 16.1 radiotherapy | 2 | 1381 | Odds Ratio (M‐H, Fixed, 95% CI) | 0.40 [0.31, 0.51] |
| 17 Wound infection Show forest plot | 2 | 2074 | Odds Ratio (M‐H, Fixed, 95% CI) | 0.65 [0.50, 0.85] |
| 17.1 radiotherapy | 2 | 2074 | Odds Ratio (M‐H, Fixed, 95% CI) | 0.65 [0.50, 0.85] |
| 18 Brachial plexus injury at 6 months postop Show forest plot | 1 | Odds Ratio (M‐H, Fixed, 95% CI) | Totals not selected | |
| 18.1 radiotherapy | 1 | Odds Ratio (M‐H, Fixed, 95% CI) | 0.0 [0.0, 0.0] | |
| Outcome or subgroup title | No. of studies | No. of participants | Statistical method | Effect size |
| 1 All‐cause mortality Show forest plot | 4 | 2469 | Hazard Ratio (95% CI) | 1.10 [1.00, 1.21] |
| 2 Local recurrence Show forest plot | 4 | 22256 | Hazard Ratio (95% CI) | 0.80 [0.64, 0.99] |
| 3 Distant metastasis Show forest plot | 1 | 1313 | Hazard Ratio (95% CI) | 1.07 [0.93, 1.25] |
| 4 Lymphoedema. Increase in arm circumference (≥ 12 months postop) Show forest plot | 1 | Odds Ratio (M‐H, Fixed, 95% CI) | Totals not selected | |
| 5 Delayed healing Show forest plot | 1 | Odds Ratio (M‐H, Fixed, 95% CI) | Totals not selected | |
| 6 Wound infection Show forest plot | 1 | Odds Ratio (M‐H, Fixed, 95% CI) | Totals not selected | |
| 7 Skin graft Show forest plot | 1 | Odds Ratio (M‐H, Fixed, 95% CI) | Totals not selected | |
| 8 Haematoma Show forest plot | 1 | Odds Ratio (M‐H, Fixed, 95% CI) | Totals not selected | |
| Outcome or subgroup title | No. of studies | No. of participants | Statistical method | Effect size |
| 1 All‐cause mortality Show forest plot | 19 | 12864 | Hazard Ratio (95% CI) | 1.08 [1.01, 1.16] |
| 1.1 no axillary surgery vs ALND | 9 | 3076 | Hazard Ratio (95% CI) | 1.11 [0.98, 1.25] |
| 1.2 axillary sampling vs ALND | 3 | 967 | Hazard Ratio (95% CI) | 0.94 [0.73, 1.21] |
| 1.3 SLNB vs ALND | 3 | 6352 | Hazard Ratio (95% CI) | 1.05 [0.89, 1.25] |
| 1.4 radiotherapy vs ALND | 4 | 2469 | Hazard Ratio (95% CI) | 1.10 [1.00, 1.21] |
| 2 All‐cause mortality (radiotherapy subgroups) Show forest plot | 19 | 13637 | Hazard Ratio (95% CI) | 1.07 [1.00, 1.14] |
| 2.1 radiotherapy (same in both groups) | 13 | 10075 | Hazard Ratio (95% CI) | 1.06 [0.96, 1.16] |
| 2.2 radiotherapy (in less surgery group only) | 4 | 2469 | Hazard Ratio (95% CI) | 1.10 [1.00, 1.21] |
| 2.3 no radiotherapy | 3 | 1093 | Hazard Ratio (95% CI) | 1.00 [0.85, 1.19] |
| 3 All‐cause mortality (additional treatment for histologically positive nodes) Show forest plot | 5 | 1708 | Hazard Ratio (95% CI) | 0.90 [0.72, 1.14] |
| 3.1 additional treatment for histologically positive nodes | 4 | 1613 | Hazard Ratio (95% CI) | 0.82 [0.64, 1.05] |
| 3.2 no additional treatment for histologically positive nodes | 1 | 95 | Hazard Ratio (95% CI) | 1.47 [0.84, 2.56] |
| 4 Local recurrence Show forest plot | 8 | 24176 | Hazard Ratio (95% CI) | 0.90 [0.75, 1.09] |
| 4.1 axillary sampling vs ALND | 3 | 1404 | Hazard Ratio (95% CI) | 1.41 [0.94, 2.12] |
| 4.2 SLNB vs ALND | 1 | 516 | Hazard Ratio (95% CI) | 0.94 [0.24, 3.77] |
| 4.3 radiotherapy vs ALND | 4 | 22256 | Hazard Ratio (95% CI) | 0.80 [0.64, 0.99] |
| 5 Locoregional recurrence Show forest plot | 6 | 26880 | Hazard Ratio (95% CI) | 1.53 [1.31, 1.78] |
| 5.1 no axillary surgery vs ALND | 4 | 20863 | Hazard Ratio (95% CI) | 2.35 [1.91, 2.89] |
| 5.2 axillary sampling vs ALND | 1 | 406 | Hazard Ratio (95% CI) | 0.74 [0.46, 1.20] |
| 5.3 SLNB vs ALND | 1 | 5611 | Hazard Ratio (95% CI) | 0.96 [0.74, 1.24] |
| 6 Distant metastasis Show forest plot | 3 | 2665 | Hazard Ratio (95% CI) | 1.07 [0.95, 1.20] |
| 6.1 no axillary surgery vs ALND | 2 | 946 | Hazard Ratio (95% CI) | 1.06 [0.87, 1.30] |
| 6.2 axillary sampling vs ALND | 1 | 406 | Hazard Ratio (95% CI) | 1.05 [0.74, 1.49] |
| 6.3 radiotherapy vs ALND | 1 | 1313 | Hazard Ratio (95% CI) | 1.07 [0.93, 1.25] |
| 7 Lymphoedema. Increase in arm volume at 12 months postop Show forest plot | 9 | 3964 | Odds Ratio (M‐H, Fixed, 95% CI) | 0.37 [0.29, 0.46] |
| 7.1 no axillary surgery vs ALND | 4 | 1714 | Odds Ratio (M‐H, Fixed, 95% CI) | 0.31 [0.23, 0.43] |
| 7.2 axillary sampling vs ALND | 1 | 85 | Odds Ratio (M‐H, Fixed, 95% CI) | 0.32 [0.13, 0.81] |
| 7.3 SLNB vs ALND | 3 | 1965 | Odds Ratio (M‐H, Fixed, 95% CI) | 0.48 [0.33, 0.69] |
| 7.4 radiotherapy vs ALND | 1 | 200 | Odds Ratio (M‐H, Fixed, 95% CI) | 0.47 [0.16, 1.44] |
| 8 Paraesthesia (≥ 12 months postop) Show forest plot | 3 | 1027 | Odds Ratio (M‐H, Fixed, 95% CI) | 0.14 [0.10, 0.21] |
| 8.1 no axillary surgery vs ALND | 1 | 532 | Odds Ratio (M‐H, Fixed, 95% CI) | 0.14 [0.06, 0.32] |
| 8.2 SLNB vs ALND | 2 | 495 | Odds Ratio (M‐H, Fixed, 95% CI) | 0.15 [0.09, 0.23] |
| 9 Pain (≥ 12 months postop) Show forest plot | 3 | 1256 | Odds Ratio (M‐H, Fixed, 95% CI) | 0.47 [0.32, 0.68] |
| 9.1 no axillary surgery vs ALND | 1 | 379 | Odds Ratio (M‐H, Fixed, 95% CI) | 0.60 [0.24, 1.47] |
| 9.2 SLNB vs ALND | 2 | 877 | Odds Ratio (M‐H, Fixed, 95% CI) | 0.44 [0.30, 0.67] |
| 10 Delayed healing Show forest plot | 2 | 404 | Odds Ratio (M‐H, Fixed, 95% CI) | 0.25 [0.13, 0.46] |
| 10.1 no axillary surgery vs ALND | 1 | 204 | Odds Ratio (M‐H, Fixed, 95% CI) | 0.27 [0.11, 0.67] |
| 10.2 radiotherapy vs ALND | 1 | 200 | Odds Ratio (M‐H, Fixed, 95% CI) | 0.24 [0.10, 0.55] |
| 11 Seroma Show forest plot | 3 | 1481 | Odds Ratio (M‐H, Fixed, 95% CI) | 0.40 [0.32, 0.52] |
| 11.1 SLNB vs ALND | 2 | 1381 | Odds Ratio (M‐H, Fixed, 95% CI) | 0.40 [0.31, 0.51] |
| 11.2 axillary sampling vs ALND | 1 | 100 | Odds Ratio (M‐H, Fixed, 95% CI) | 0.49 [0.20, 1.20] |
| 12 Wound infection Show forest plot | 3 | 2274 | Odds Ratio (M‐H, Fixed, 95% CI) | 0.65 [0.50, 0.84] |
| 12.1 SLNB vs ALND | 2 | 2074 | Odds Ratio (M‐H, Fixed, 95% CI) | 0.65 [0.50, 0.85] |
| 12.2 radiotherapy vs ALND | 1 | 200 | Odds Ratio (M‐H, Fixed, 95% CI) | 0.65 [0.22, 1.89] |
| 13 Skin graft Show forest plot | 2 | 404 | Odds Ratio (M‐H, Fixed, 95% CI) | 0.15 [0.04, 0.57] |
| 13.1 no axillary surgery vs ALND | 1 | 204 | Odds Ratio (M‐H, Fixed, 95% CI) | 0.39 [0.07, 2.19] |
| 13.2 radiotherapy vs ALND | 1 | 200 | Odds Ratio (M‐H, Fixed, 95% CI) | 0.04 [0.00, 0.74] |
| 14 Haematoma Show forest plot | 2 | 1283 | Odds Ratio (M‐H, Fixed, 95% CI) | 0.80 [0.53, 1.20] |
| 14.1 SLNB vs ALND | 1 | 1083 | Odds Ratio (M‐H, Fixed, 95% CI) | 1.27 [0.78, 2.09] |
| 14.2 radiotherapy vs ALND | 1 | 200 | Odds Ratio (M‐H, Fixed, 95% CI) | 0.20 [0.08, 0.52] |