Scolaris Content Display Scolaris Content Display

Comparison 1 Speech and language intervention vesus delayed or no treatment, Outcome 1 Expressive phonology outcomes.
Figures and Tables -
Analysis 1.1

Comparison 1 Speech and language intervention vesus delayed or no treatment, Outcome 1 Expressive phonology outcomes.

Comparison 1 Speech and language intervention vesus delayed or no treatment, Outcome 2 Receptive phonology outcomes.
Figures and Tables -
Analysis 1.2

Comparison 1 Speech and language intervention vesus delayed or no treatment, Outcome 2 Receptive phonology outcomes.

Comparison 1 Speech and language intervention vesus delayed or no treatment, Outcome 3 Expressive syntax outcomes.
Figures and Tables -
Analysis 1.3

Comparison 1 Speech and language intervention vesus delayed or no treatment, Outcome 3 Expressive syntax outcomes.

Comparison 1 Speech and language intervention vesus delayed or no treatment, Outcome 4 Receptive syntax outcomes.
Figures and Tables -
Analysis 1.4

Comparison 1 Speech and language intervention vesus delayed or no treatment, Outcome 4 Receptive syntax outcomes.

Comparison 1 Speech and language intervention vesus delayed or no treatment, Outcome 5 Expressive vocabulary outcomes.
Figures and Tables -
Analysis 1.5

Comparison 1 Speech and language intervention vesus delayed or no treatment, Outcome 5 Expressive vocabulary outcomes.

Comparison 1 Speech and language intervention vesus delayed or no treatment, Outcome 7 Composite language measures.
Figures and Tables -
Analysis 1.7

Comparison 1 Speech and language intervention vesus delayed or no treatment, Outcome 7 Composite language measures.

Comparison 1 Speech and language intervention vesus delayed or no treatment, Outcome 8 Subgroup analysis (clinician only data).
Figures and Tables -
Analysis 1.8

Comparison 1 Speech and language intervention vesus delayed or no treatment, Outcome 8 Subgroup analysis (clinician only data).

Comparison 1 Speech and language intervention vesus delayed or no treatment, Outcome 9 Subgroup analysis (trials of longer than eight weeks).
Figures and Tables -
Analysis 1.9

Comparison 1 Speech and language intervention vesus delayed or no treatment, Outcome 9 Subgroup analysis (trials of longer than eight weeks).

Comparison 1 Speech and language intervention vesus delayed or no treatment, Outcome 10 Subgroup Analysis (excluding data from children with receptive and expressive difficulties).
Figures and Tables -
Analysis 1.10

Comparison 1 Speech and language intervention vesus delayed or no treatment, Outcome 10 Subgroup Analysis (excluding data from children with receptive and expressive difficulties).

Comparison 1 Speech and language intervention vesus delayed or no treatment, Outcome 11 Sensitivity analysis (excluding studies not reporting attrition).
Figures and Tables -
Analysis 1.11

Comparison 1 Speech and language intervention vesus delayed or no treatment, Outcome 11 Sensitivity analysis (excluding studies not reporting attrition).

Comparison 1 Speech and language intervention vesus delayed or no treatment, Outcome 12 Sensitivity analysis (excluding studies not reporting blinding).
Figures and Tables -
Analysis 1.12

Comparison 1 Speech and language intervention vesus delayed or no treatment, Outcome 12 Sensitivity analysis (excluding studies not reporting blinding).

Comparison 2 Speech and language intervention versus general stimulation programmes, Outcome 3 Expressive syntax outcomes.
Figures and Tables -
Analysis 2.3

Comparison 2 Speech and language intervention versus general stimulation programmes, Outcome 3 Expressive syntax outcomes.

Comparison 2 Speech and language intervention versus general stimulation programmes, Outcome 5 Expressive vocabulary outcomes.
Figures and Tables -
Analysis 2.5

Comparison 2 Speech and language intervention versus general stimulation programmes, Outcome 5 Expressive vocabulary outcomes.

Comparison 3 Speech and language interventions versus traditional speech and language programmes, Outcome 1 Expressive phonology outcomes.
Figures and Tables -
Analysis 3.1

Comparison 3 Speech and language interventions versus traditional speech and language programmes, Outcome 1 Expressive phonology outcomes.

Comparison 3 Speech and language interventions versus traditional speech and language programmes, Outcome 2 Receptive phonology outcomes.
Figures and Tables -
Analysis 3.2

Comparison 3 Speech and language interventions versus traditional speech and language programmes, Outcome 2 Receptive phonology outcomes.

Comparison 3 Speech and language interventions versus traditional speech and language programmes, Outcome 3 Expressive syntax outcomes.
Figures and Tables -
Analysis 3.3

Comparison 3 Speech and language interventions versus traditional speech and language programmes, Outcome 3 Expressive syntax outcomes.

Comparison 3 Speech and language interventions versus traditional speech and language programmes, Outcome 4 Receptive syntax outcomes.
Figures and Tables -
Analysis 3.4

Comparison 3 Speech and language interventions versus traditional speech and language programmes, Outcome 4 Receptive syntax outcomes.

Comparison 3 Speech and language interventions versus traditional speech and language programmes, Outcome 5 Expressive vocabulary outcomes.
Figures and Tables -
Analysis 3.5

Comparison 3 Speech and language interventions versus traditional speech and language programmes, Outcome 5 Expressive vocabulary outcomes.

Comparison 3 Speech and language interventions versus traditional speech and language programmes, Outcome 6 Receptive vocabulary outcomes.
Figures and Tables -
Analysis 3.6

Comparison 3 Speech and language interventions versus traditional speech and language programmes, Outcome 6 Receptive vocabulary outcomes.

Comparison 3 Speech and language interventions versus traditional speech and language programmes, Outcome 8 Subgroup analysis (clinician versus parent).
Figures and Tables -
Analysis 3.8

Comparison 3 Speech and language interventions versus traditional speech and language programmes, Outcome 8 Subgroup analysis (clinician versus parent).

Comparison 3 Speech and language interventions versus traditional speech and language programmes, Outcome 9 Subgroup analysis (excluding data from children with expressive and receptive difficulties).
Figures and Tables -
Analysis 3.9

Comparison 3 Speech and language interventions versus traditional speech and language programmes, Outcome 9 Subgroup analysis (excluding data from children with expressive and receptive difficulties).

Table 1. Methodological Quality (A‐L)

Study

Randomisation

Blinding of Assessors

Similarities at Baseline

Explanation of Withdrawals

Discounting in analysis of Missing Values

Degree of Attrition

Intention to Treat Analysis

Power

Description of Eligibility Criteria

Almost (1998)

A

A

A

A

A (last known scores used)

C (.15)

A (I to T)

A

A

Barratt (1992)

B

B

B

A

C

A (.07)

B

A

A

Cole (1986)

B

B

A

B

B

B

B

B

A

Courtwright (1979)

B

A

B

B

B

B

B

B

B

Dixon (2001)

B

B

B

A (none)

A (none)

A (none)

B

B

A

Evans (Forthcoming)

B

A

B

A

C

C (.10)

B

B

A

Fey (1993)

B

A

C (mothers education)

A

C

A (.03)

B

B

A

Fey (1994)

B

C

A

A

A (none)

A (none)

B

B

A

Fey (1997)

B

A

A

A

C

A (.06)

B

B

A

Fudala (1972)

B

B

A

B

B

B

B

B

B

Gibbard (1994a)

B

B

A

A (none)

A (none)

A (none)

B

B

A

Gibbard (1994b)

B

B

A

A (none)

A (none)

A (none)

B

B

A

Girolametto (1996a)

B

A

C (behaviour)

A (none)

A (none)

A (none)

B

B

A

Girolametto (1996b)

B

A

A

A (none)

A (none)

A (none)

B

B

A

Girolametto (1997)

B

A

A

A (none)

A (none)

A (none)

B

B

A

Glogowska (2000)

A

A

A

A

C

A (.03)

A (I to T)

C

A

Head (1975)

B

B

B

A

C

C (.11)

B

B

C

Lancaster (1991)

B

B

B

A

A (included in end analysis)

A (none)

A (I to T)

B

A

Law (1999)

A

A

C (esteem, behaviour)

A

C

C (.12)

B

C

A

Key:

A: randomisation methods explained

A: assessors blind at pre and post test

A: baseline characteristics reported

A: withdrawals accounted for

A: missing values accounted for in analysis

A: attrition <.10

A: intention to treat analysis

A: power calculation and sufficient participants recruited

A: characteristics provided in main areas of language

B: randomisation methods not explained

B: blinding not reported

B: baseine characteristics not reported

B: withdrawals not reported

B: no missing values shown

B: attrition not reported

B: intention to treat analysis not used

B: power claculation not reported

B: characteristics reported in area of investigation

C: randomisation methods not adequate

C: blinding at pre‐test only

C: baseline characteristics reported to be different

C: withdrawals not accounted for

C: missing values discounted from analysis

C: attrition >.10

C: power calculation completed but insufficient participants recruited

C: characteristics unclear

Figures and Tables -
Table 1. Methodological Quality (A‐L)
Table 2. Methodological Quality (M‐Z)

Study

Randomisation

Blinding of Assessor

Baseline

Withdrawals

Missing Values

Attrition

Analysis

Power

Eligibility

Matheny (1978)

B

B

A

B

B

B

B

B

A

Mulac (1977)

B

A

B

B

B

B

B

B

B

Munro (1999)

B

A

B

A

C

C (.15)

B

B

A

Reid (1996)

B

B

C (medians)

A (subgroup)

A (subgroup)

A (subgroup)

B

B

A

Robertson (1997)

B

C

A

B

B

B

B

B

A

Robertson (1999)

B

B

A

A

C

C (.13)

B

B

A

Ruscello (1993)

B

B

A

B

B

B

B

B

A

Rvachew (1994)

B

A

A

B

C

C (.13)

B

B

A

Rvachew (2001)

B

A

A

A

B

B

B

B

A

Schwartz (1985)

B

C

B

B

B

B

B

B

A

Shelton (1978)

B

B

A

A

C

A (.08)

B

B

A

Sommers (1962)

B

B

A

B

B

B

B

B

B

Sommers (1964)

B

B

B

B

B

B

B

B

B

Sommers (1966)

B

A

B

C

C

C (.10)

B

B

B

Sutton (1999)

B

B

B

B

B

B

B

B

A

Tufts (1959)

B

A

A

B

B

B

B

B

B

Wilcox (1991)

B

B

A

B

B

B

B

B

A

Key

A: methods of randomisation explained

A: assessors blind to group allocation at pre and post test

A: baseline characteristics reported

A: withdrawals accounted for

A: missing values taken into account in analysis

A: <.10 attrition

A: intention to treat analysis used

A: power calculation completed and sufficient participants recruited

A: characteristics in main linguistic areas

B: methods fo randomisation not explained

B: blinding not reported

B: baseline characteristics not reported

B: withdrawals not reported

B: no missing values shown

B: attrition not reported

B: intention to treat analysis not reported

B: power claculation not reported

B: characteristics in main area of study

C: methods of randomisation inadequate

C: assessors blind at pre‐test only

C: baseline characteristics reported to be different

C: withdrawals not accounted for

C: missing values discounted in analysis

C: >.10 attrition

C: power calculation completed but insufficient participants recruited

C: characteristics unclear

Figures and Tables -
Table 2. Methodological Quality (M‐Z)
Comparison 1. Speech and language intervention vesus delayed or no treatment

Outcome or subgroup title

No. of studies

No. of participants

Statistical method

Effect size

1 Expressive phonology outcomes Show forest plot

6

Std. Mean Difference (IV, Random, 95% CI)

Subtotals only

1.1 Production of target sound

1

11

Std. Mean Difference (IV, Random, 95% CI)

0.98 [‐0.35, 2.31]

1.2 Variability in production of target sound

1

11

Std. Mean Difference (IV, Random, 95% CI)

0.91 [‐0.41, 2.23]

1.3 Measures of overall phonological development

6

264

Std. Mean Difference (IV, Random, 95% CI)

0.44 [0.01, 0.86]

1.4 Percentage of consonants correct in conversation

1

26

Std. Mean Difference (IV, Random, 95% CI)

1.91 [0.96, 2.86]

1.5 Re‐telling a story with target sound

1

11

Std. Mean Difference (IV, Random, 95% CI)

1.29 [‐0.11, 2.69]

2 Receptive phonology outcomes Show forest plot

1

Std. Mean Difference (IV, Random, 95% CI)

Subtotals only

2.1 Auditory association test

1

45

Std. Mean Difference (IV, Random, 95% CI)

0.53 [‐0.10, 1.16]

3 Expressive syntax outcomes Show forest plot

7

Std. Mean Difference (IV, Random, 95% CI)

Subtotals only

3.1 Measures of overall expressive syntax development

5

271

Std. Mean Difference (IV, Random, 95% CI)

0.70 [‐0.14, 1.55]

3.2 Total number of utterances in a language sample

3

99

Std. Mean Difference (IV, Random, 95% CI)

0.68 [‐0.45, 1.82]

3.3 Mean length of utterance from language sample

3

95

Std. Mean Difference (IV, Random, 95% CI)

0.74 [‐0.33, 1.81]

3.4 Parent report of phrase complexity

3

99

Std. Mean Difference (IV, Random, 95% CI)

1.02 [‐0.17, 2.22]

4 Receptive syntax outcomes Show forest plot

2

Std. Mean Difference (IV, Random, 95% CI)

Subtotals only

4.1 measures of overall receptive syntax development

2

193

Std. Mean Difference (IV, Random, 95% CI)

‐0.04 [‐0.64, 0.56]

5 Expressive vocabulary outcomes Show forest plot

5

Std. Mean Difference (IV, Random, 95% CI)

Subtotals only

5.1 Number of different target words learnt

2

41

Std. Mean Difference (IV, Random, 95% CI)

0.93 [0.27, 1.58]

5.2 Measures of overall expressive vocabulary development

2

74

Std. Mean Difference (IV, Random, 95% CI)

0.98 [‐0.59, 2.56]

5.3 Different words in language sample

3

82

Std. Mean Difference (IV, Random, 95% CI)

1.08 [0.61, 1.55]

5.4 Parent report of vocabulary

5

136

Std. Mean Difference (IV, Random, 95% CI)

0.89 [0.21, 1.56]

6 Receptive vocabulary outcomes

0

Std. Mean Difference (IV, Random, 95% CI)

Subtotals only

7 Composite language measures Show forest plot

1

Std. Mean Difference (IV, Random, 95% CI)

Subtotals only

7.1 REEL Language quotients

1

55

Std. Mean Difference (IV, Random, 95% CI)

0.22 [‐0.32, 0.76]

8 Subgroup analysis (clinician only data) Show forest plot

7

Std. Mean Difference (IV, Random, 95% CI)

Subtotals only

8.1 measures of overall expressive phonology development

5

214

Std. Mean Difference (IV, Random, 95% CI)

0.67 [0.19, 1.16]

8.2 measures of overall expressive syntax development

4

214

Std. Mean Difference (IV, Random, 95% CI)

0.28 [‐0.19, 0.75]

8.3 measures of overall expressive vocabulary development

1

27

Std. Mean Difference (IV, Random, 95% CI)

0.13 [‐0.65, 0.91]

8.4 measures of overall receptive syntax development

2

182

Std. Mean Difference (IV, Random, 95% CI)

0.01 [‐0.53, 0.55]

9 Subgroup analysis (trials of longer than eight weeks) Show forest plot

5

Std. Mean Difference (IV, Random, 95% CI)

Subtotals only

9.1 measures of overall phonological development

4

203

Std. Mean Difference (IV, Random, 95% CI)

0.74 [0.14, 1.33]

9.2 measures of overall expressive syntax development

3

187

Std. Mean Difference (IV, Random, 95% CI)

0.43 [‐0.06, 0.93]

9.3 measures of overall expressive vocabulary development

0

0

Std. Mean Difference (IV, Random, 95% CI)

0.0 [0.0, 0.0]

9.4 measures of overall receptive syntax development

1

155

Std. Mean Difference (IV, Random, 95% CI)

0.19 [‐0.12, 0.51]

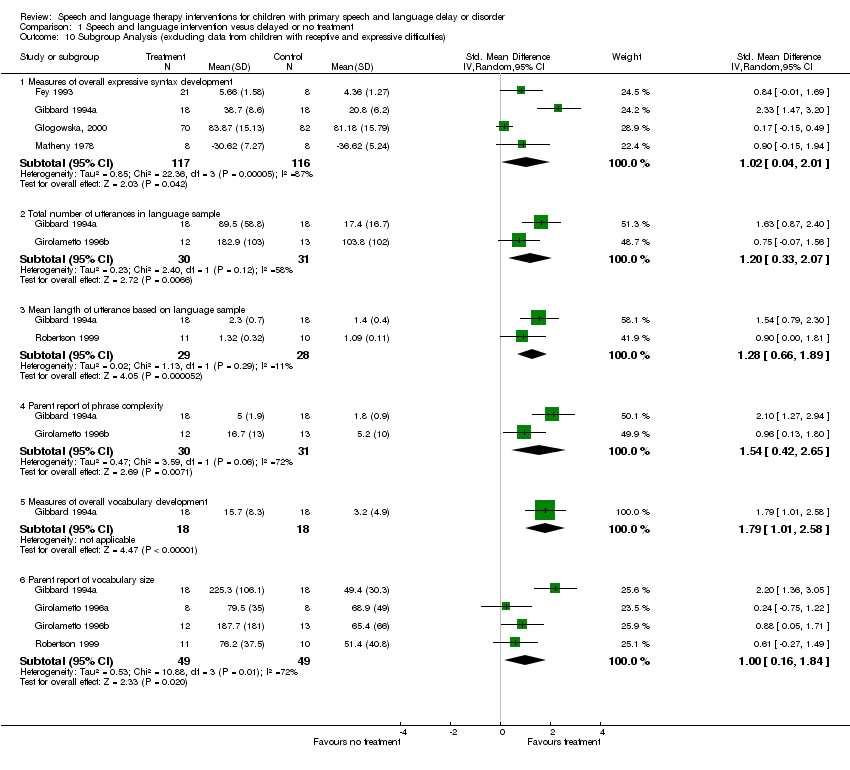
10 Subgroup Analysis (excluding data from children with receptive and expressive difficulties) Show forest plot

7

Std. Mean Difference (IV, Random, 95% CI)

Subtotals only

10.1 Measures of overall expressive syntax development

4

233

Std. Mean Difference (IV, Random, 95% CI)

1.02 [0.04, 2.01]

10.2 Total number of utterances in language sample

2

61

Std. Mean Difference (IV, Random, 95% CI)

1.20 [0.33, 2.07]

10.3 Mean langth of utterance based on language sample

2

57

Std. Mean Difference (IV, Random, 95% CI)

1.28 [0.66, 1.89]

10.4 Parent report of phrase complexity

2

61

Std. Mean Difference (IV, Random, 95% CI)

1.54 [0.42, 2.65]

10.5 Measures of overall vocabulary development

1

36

Std. Mean Difference (IV, Random, 95% CI)

1.79 [1.01, 2.58]

10.6 Parent report of vocabulary size

4

98

Std. Mean Difference (IV, Random, 95% CI)

1.00 [0.16, 1.84]

11 Sensitivity analysis (excluding studies not reporting attrition) Show forest plot

9

Std. Mean Difference (IV, Random, 95% CI)

Subtotals only

11.1 Measures of overall expressive phonology development

5

248

Std. Mean Difference (IV, Random, 95% CI)

0.40 [‐0.08, 0.89]

11.2 Measures of overall receptive phonology development

1

45

Std. Mean Difference (IV, Random, 95% CI)

0.53 [‐0.10, 1.16]

11.3 Measures of overall expressive syntax development

4

255

Std. Mean Difference (IV, Random, 95% CI)

0.67 [‐0.33, 1.66]

11.4 Measures of overall receptive syntax development

2

193

Std. Mean Difference (IV, Random, 95% CI)

‐0.04 [‐0.64, 0.56]

11.5 Measures of overall expressive vocabulary development

2

74

Std. Mean Difference (IV, Random, 95% CI)

0.98 [‐0.59, 2.56]

11.6 Measures of overall receptive vocabulary development

0

0

Std. Mean Difference (IV, Random, 95% CI)

0.0 [0.0, 0.0]

11.7 Composite language measures

1

55

Std. Mean Difference (IV, Random, 95% CI)

0.22 [‐0.32, 0.76]

12 Sensitivity analysis (excluding studies not reporting blinding) Show forest plot

6

Std. Mean Difference (IV, Random, 95% CI)

Subtotals only

12.1 Measures of overall expressive phonology

3

188

Std. Mean Difference (IV, Random, 95% CI)

0.66 [‐0.07, 1.40]

12.2 Measures of overall receptive phonology

0

0

Std. Mean Difference (IV, Random, 95% CI)

0.0 [0.0, 0.0]

12.3 Measures of overall expressive syntax

3

219

Std. Mean Difference (IV, Random, 95% CI)

0.14 [‐0.47, 0.75]

12.4 Measures of overall receptive syntax

2

193

Std. Mean Difference (IV, Random, 95% CI)

‐0.04 [‐0.64, 0.56]

12.5 Measures of overall expressive vocabulary

1

38

Std. Mean Difference (IV, Random, 95% CI)

0.19 [‐0.54, 0.91]

12.6 Measures of overall receptive vocabulary

0

0

Std. Mean Difference (IV, Random, 95% CI)

0.0 [0.0, 0.0]

12.7 Composite language measures

1

55

Std. Mean Difference (IV, Random, 95% CI)

0.22 [‐0.32, 0.76]

Figures and Tables -
Comparison 1. Speech and language intervention vesus delayed or no treatment
Comparison 2. Speech and language intervention versus general stimulation programmes

Outcome or subgroup title

No. of studies

No. of participants

Statistical method

Effect size

1 Expressive phonology outcomes

0

Std. Mean Difference (IV, Random, 95% CI)

Subtotals only

2 Receptive phonology outcomes

0

Std. Mean Difference (IV, Random, 95% CI)

Subtotals only

3 Expressive syntax outcomes Show forest plot

3

Std. Mean Difference (IV, Random, 95% CI)

Subtotals only

3.1 Multi‐word utterances using target stimuli

1

10

Std. Mean Difference (IV, Random, 95% CI)

0.74 [‐0.87, 2.34]

3.2 Measures of overall expressive syntax development

1

25

Std. Mean Difference (IV, Random, 95% CI)

0.93 [0.05, 1.82]

3.3 Number of play related speech acts during play

1

20

Std. Mean Difference (IV, Random, 95% CI)

3.20 [1.79, 4.62]

3.4 Total number of utterances in language sample

1

25

Std. Mean Difference (IV, Random, 95% CI)

0.88 [‐0.00, 1.76]

3.5 Mother description of phrase complexity

1

25

Std. Mean Difference (IV, Random, 95% CI)

0.78 [‐0.09, 1.65]

3.6 Mean length of utterance based on language sample

1

25

Std. Mean Difference (IV, Random, 95% CI)

1.36 [0.42, 2.29]

4 Receptive syntax outcomes

0

0

Mean Difference (IV, Fixed, 95% CI)

0.0 [0.0, 0.0]

5 Expressive vocabulary outcomes Show forest plot

2

Std. Mean Difference (IV, Random, 95% CI)

Subtotals only

5.1 Number of words in play scripts

1

20

Std. Mean Difference (IV, Random, 95% CI)

2.29 [1.11, 3.48]

5.2 Measures of overall expressive vocabulary development

1

25

Std. Mean Difference (IV, Random, 95% CI)

0.76 [‐0.11, 1.63]

5.3 Number of words in language sample

2

45

Std. Mean Difference (IV, Random, 95% CI)

1.25 [‐0.07, 2.58]

6 Receptive vocabulary outcomes

0

0

Mean Difference (IV, Fixed, 95% CI)

0.0 [0.0, 0.0]

Figures and Tables -
Comparison 2. Speech and language intervention versus general stimulation programmes
Comparison 3. Speech and language interventions versus traditional speech and language programmes

Outcome or subgroup title

No. of studies

No. of participants

Statistical method

Effect size

1 Expressive phonology outcomes Show forest plot

7

Std. Mean Difference (IV, Random, 95% CI)

Totals not selected

1.1 Production of target sound

1

Std. Mean Difference (IV, Random, 95% CI)

0.0 [0.0, 0.0]

1.2 Measures of overall expressive phonology development

7

Std. Mean Difference (IV, Random, 95% CI)

0.0 [0.0, 0.0]

1.3 Percentage of consonants correct in conversation

1

Std. Mean Difference (IV, Random, 95% CI)

0.0 [0.0, 0.0]

2 Receptive phonology outcomes Show forest plot

1

Std. Mean Difference (IV, Random, 95% CI)

Subtotals only

2.1 Test of Auditory Association

1

30

Std. Mean Difference (IV, Random, 95% CI)

0.0 [‐0.72, 0.72]

3 Expressive syntax outcomes Show forest plot

6

Std. Mean Difference (IV, Random, 95% CI)

Subtotals only

3.1 Correct utterance of 20 unusual sentences

1

24

Std. Mean Difference (IV, Random, 95% CI)

0.57 [‐0.25, 1.39]

3.2 Measures of overall expressive syntax development

5

138

Std. Mean Difference (IV, Random, 95% CI)

‐0.13 [‐0.47, 0.21]

3.3 Total utterances from a language sample

2

45

Std. Mean Difference (IV, Random, 95% CI)

0.15 [‐0.45, 0.74]

3.4 Mean length of utterance from a language sample

3

89

Std. Mean Difference (IV, Random, 95% CI)

0.09 [‐0.75, 0.93]

3.5 Parent report of complexity of phrases

2

45

Std. Mean Difference (IV, Random, 95% CI)

0.01 [‐0.63, 0.66]

4 Receptive syntax outcomes Show forest plot

3

Std. Mean Difference (IV, Random, 95% CI)

Totals not selected

4.1 Measures of overall receptove syntax development

3

Std. Mean Difference (IV, Random, 95% CI)

0.0 [0.0, 0.0]

5 Expressive vocabulary outcomes Show forest plot

3

Std. Mean Difference (IV, Random, 95% CI)

Subtotals only

5.1 Overall use of target words in clinic interaction

1

20

Std. Mean Difference (IV, Random, 95% CI)

0.35 [‐0.53, 1.24]

5.2 Measures of overall expressive vocabulary development

2

45

Std. Mean Difference (IV, Random, 95% CI)

0.20 [‐0.40, 0.79]

5.3 Different words in language sample

1

17

Std. Mean Difference (IV, Random, 95% CI)

‐0.50 [‐1.48, 0.47]

5.4 Parent report of vocabulary size

2

45

Std. Mean Difference (IV, Random, 95% CI)

‐0.16 [‐0.76, 0.44]

6 Receptive vocabulary outcomes Show forest plot

1

Std. Mean Difference (IV, Random, 95% CI)

Subtotals only

6.1 Measures of overall vocabulary understanding

1

44

Std. Mean Difference (IV, Random, 95% CI)

‐0.22 [‐0.82, 0.38]

7 Composite language outcomes

0

Std. Mean Difference (IV, Random, 95% CI)

Subtotals only

8 Subgroup analysis (clinician versus parent) Show forest plot

6

Std. Mean Difference (IV, Random, 95% CI)

Subtotals only

8.1 Measures of overall expressive phonology development

3

130

Std. Mean Difference (IV, Random, 95% CI)

0.66 [‐0.47, 1.80]

8.2 Measures of overall expressive syntax development

3

66

Std. Mean Difference (IV, Random, 95% CI)

‐0.04 [‐0.56, 0.48]

8.3 Measures of overall expressive vocabulary development

2

45

Std. Mean Difference (IV, Random, 95% CI)

0.20 [‐0.40, 0.79]

8.4 Measures of overall receptive syntax development

1

28

Std. Mean Difference (IV, Random, 95% CI)

‐0.11 [‐0.87, 0.65]

9 Subgroup analysis (excluding data from children with expressive and receptive difficulties) Show forest plot

2

Std. Mean Difference (IV, Random, 95% CI)

Subtotals only

9.1 Measures of overall syntax development

2

38

Std. Mean Difference (IV, Random, 95% CI)

0.27 [‐0.37, 0.91]

9.2 Total number of utterances in a language sample

1

17

Std. Mean Difference (IV, Random, 95% CI)

0.43 [‐0.54, 1.39]

9.3 Mean length of utterance derived from a language sample

1

17

Std. Mean Difference (IV, Random, 95% CI)

1.17 [0.12, 2.23]

9.4 Parent report of phrase complexity

1

17

Std. Mean Difference (IV, Random, 95% CI)

0.42 [‐0.54, 1.39]

9.5 Measures of overall vocabulary development

1

17

Std. Mean Difference (IV, Random, 95% CI)

0.33 [‐0.63, 1.29]

9.6 Parental report of vocabulary size

1

17

Std. Mean Difference (IV, Random, 95% CI)

0.13 [‐0.82, 1.08]

Figures and Tables -
Comparison 3. Speech and language interventions versus traditional speech and language programmes