Micronutrient supplementation in adults with HIV infection
Information
- DOI:
- https://doi.org/10.1002/14651858.CD003650.pub4Copy DOI

- Database:
-
- Cochrane Database of Systematic Reviews
- Version published:
-
- 18 May 2017see what's new
- Type:
-
- Intervention
- Stage:
-
- Review
- Cochrane Editorial Group:
-
Cochrane Infectious Diseases Group
- Classified:
-
- Up to date
All studies incorporated from most recent search
All eligible published studies found in the last search (18 Nov, 2016) were included and six ongoing studies have been identified (see 'Characteristics of ongoing studies' section)Assessed: 12 April 2019
- Up to date
- Copyright:
-
- Copyright © 2017 The Authors. Cochrane Database of Systematic Reviews published by John Wiley & Sons, Ltd. on behalf of The Cochrane Collaboration.
- This is an open access article under the terms of the Creative Commons Attribution‐Non‐Commercial Licence, which permits use, distribution and reproduction in any medium, provided the original work is properly cited and is not used for commercial purposes.
Article metrics
Altmetric:
Cited by:
Authors
Contributions of authors
Marianne Visser (MV) initiated the review update and contributed to all stages of the review.
Solange Durao (SD) contributed to all stages of the review update.
David Sinclair (DS) contributed to the preparation of the review update for submission.
James Irlam (JI) commented on the report of the review update.
Nandi Siegfried (NS) assisted with study selection and commented on the review update.
Sources of support
Internal sources
-
SACC HIV/AIDS Mentoring Programme, South Africa.
-
South African Cochrane Centre, South Africa.
-
Medical Research Council, South Africa.
-
Liverpool School of Tropical Medicine, UK.
External sources
-
Department for International Development, UK.
Grant: 5242
Declarations of interest
Marianne Visser (MV) has no known conflicts of interest.
Solange Durao (SD) has no known conflicts of interest.
David Sinclair (DS) has no known conflicts of interest.
James Irlam (JI) has no known conflicts of interest.
Nandi Siegfried (NS) has provided consultancies to several World Health Organization (WHO) guidelines processes within the HIV department including nutritional interventions.
Acknowledgements
We are grateful to Cochrane South Africa and the editorial base of the Cochrane Infectious Diseases Group, for assistance and support in preparing this review update. We also thank the following individuals.
-
Tamara Kredo, Cochrane SA, for providing advice and guidance throughout the review process
-
Joy Oliver, Cochrane SA, for conducting the searches for this update
-
Tonya Esterhuizen, Centre for Evidence‐based Health Care, Stellenbosch University, for providing statistical advice
-
Xuan Hui, a methodologist of the Cochrane Eyes and Vision Group, for the translation of the included Chinese article into English
-
Nigel Rollins, who was an author on the previously published versions of this review (Irlam 2002; Irlam 2005; Irlam 2010)
The editorial base of the Cochrane Infectious Diseases Group is funded by UK aid from the UK Government for the benefit of developing countries (Grant: 5242). David Sinclair and Solange Durao were partly supported by the Effective Health Care Research Consortium. This Consortium is funded by UK aid from the UK Government for the benefit of developing countries (Grant: 5242). The views expressed in this review do not necessarily reflect UK government policy.
Version history
| Published | Title | Stage | Authors | Version |
| 2017 May 18 | Micronutrient supplementation in adults with HIV infection | Review | Marianne E Visser, Solange Durao, David Sinclair, James H Irlam, Nandi Siegfried | |
| 2010 Dec 08 | Micronutrient supplementation in children and adults with HIV infection | Review | James H Irlam, Marianne ME Visser, Nigel N Rollins, Nandi Siegfried | |
| 2005 Oct 19 | Micronutrient supplementation in children and adults with HIV infection | Review | James JH Irlam, Marianne ME Visser, Nigel N Rollins, Nandi Siegfried | |
| 2002 Apr 22 | Micronutrient supplementation in children and adults with HIV infection | Protocol | James JH Irlam, Marianne ME Visser, Nigel N Rollins, Nandi N Siegfried | |
Differences between protocol and review
The original protocol for this review included studies in both HIV‐positive children and pregnant women (Irlam 2002). Two separate reviews on the role of micronutrient supplementation for HIV‐positive pregnant women, Siegfried 2012, and children, Irlam 2013, have been published. The primary focus of this review update was therefore on the role of micronutrient supplementation in HIV‐positive men and women who were not pregnant.
Keywords
MeSH
Medical Subject Headings (MeSH) Keywords
- *Dietary Supplements;
- *HIV Infections [complications, mortality];
- CD4 Lymphocyte Count;
- Cause of Death;
- HIV‐1;
- HIV‐2;
- Hospitalization [statistics & numerical data];
- Micronutrients [*administration & dosage, deficiency];
- Pregnancy Complications, Infectious [mortality];
- Randomized Controlled Trials as Topic;
- Selenium [administration & dosage];
- Viral Load;
- Vitamin A [administration & dosage];
- Vitamin D [administration & dosage];
- Vitamins [administration & dosage];
- Zinc [administration & dosage];
- beta Carotene [administration & dosage];
Medical Subject Headings Check Words
Adult; Child; Female; Humans; Pregnancy;
PICOs

'Risk of bias' graph: review authors' judgements about each 'Risk of bias' item presented as percentages across all included studies.

'Risk of bias' summary: review authors' judgements about each 'Risk of bias' item for each included study.

Comparison 1 Multiple micronutrients versus placebo, Outcome 1 Mortality.

Comparison 1 Multiple micronutrients versus placebo, Outcome 2 Hospital admissions.

Comparison 1 Multiple micronutrients versus placebo, Outcome 3 Clinical disease progression.

Comparison 1 Multiple micronutrients versus placebo, Outcome 4 CD4+ cell count.

Comparison 1 Multiple micronutrients versus placebo, Outcome 5 CD4+ cell count at longest follow‐up; subgrouped by participant characteristics.

Comparison 1 Multiple micronutrients versus placebo, Outcome 6 Viral load.

Comparison 1 Multiple micronutrients versus placebo, Outcome 7 Viral load at longest follow‐up; sub‐grouped by participant characteristics.

Comparison 2 High dose multivitamins versus standard dose, Outcome 1 Mortality.

Comparison 2 High dose multivitamins versus standard dose, Outcome 2 CD4+ cell count.

Comparison 2 High dose multivitamins versus standard dose, Outcome 3 Viral load.

Comparison 3 Vitamin D versus placebo, Outcome 1 Mortality.
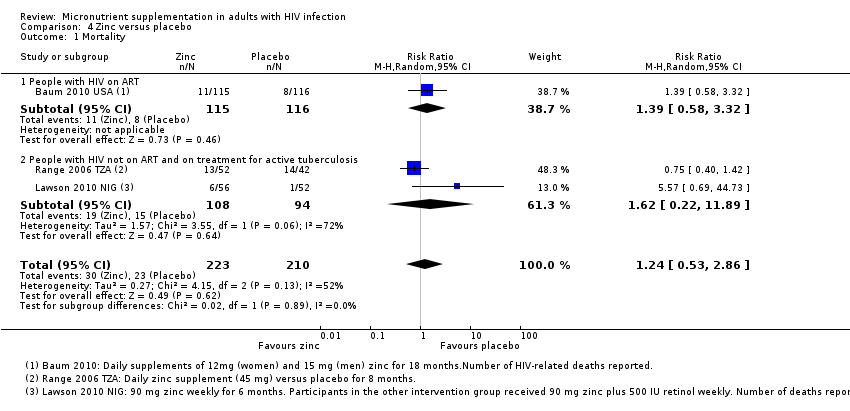
Comparison 4 Zinc versus placebo, Outcome 1 Mortality.

Comparison 4 Zinc versus placebo, Outcome 2 Persistence of diarrhoea.

Comparison 4 Zinc versus placebo, Outcome 3 Rate of diarrhoea.

Comparison 5 Selenium versus placebo, Outcome 1 Hospital admissions.
| Multiple micronutrients compared to placebo for adults with HIV infection | ||||||
| Participant or population: adults with HIV infection (with and without concurrent tuberculosis, with and without ART) | ||||||
| Outcomes | Illustrative comparative risks* (95% CI) | Relative effect | Number of participants | Certainty of the evidence | Comments | |
| Assumed risk | Corresponding risk | |||||
| Placebo | Micronutrients | |||||
| Mortality Follow‐up: 8 to 24 months | 100 per 1000 | 91 per 1000 | RR 0.91 (0.72 to 1.15) | 2897 | ⊕⊕⊝⊝ due to indirectness and imprecision | Multiple micronutrients may have little or no effect on mortality |
| Hospital admissions Follow‐up: 11 to 18 months | 139 per 1000 | 120 per 1000 (85 to 170) | RR 0.86 (0.61 to 1.22) | 881 (2 trials) | ⊕⊝⊝⊝ due to indirectness and imprecision | We don't know if multiple micronutrients have any effect on hospital admissions |
| CD4 cell count Follow‐up: 6 weeks to 2 years | The mean in the placebo groups ranged from 147 to 483 cells/mm³ | The mean in the multiple micronutrient group was 26.40 cells/mm³ higher (22.91 lower to 75.70 higher) | — | 1581 | ⊕⊕⊝⊝ low1,3,6 due to indirectness and inconsistency | Multiple micronutrients may have little or no effect on CD4 cell count |
| Viral load Follow‐up: 6 weeks to 2 years | The mean in the placebo groups ranged from 4.1 to 5.4 log10copies/mL | The mean in the multiple micronutrient groups was 0.10 log10copies/mL lower (0.26 lower to 0.06 higher) | — | 840 (4 trials) | ⊕⊕⊕⊝ due to indirectness | Multiple micronutrients probably have little or no effect on viral load |
| Nutritional status Follow‐up: 4 weeks to 1.9 years | — | — | Not pooled | 1007 | ⊕⊝⊝⊝ due to indirectness and imprecision | We don't know if multiple micronutrients have any effect on nutritional status parameters |
| The basis for the assumed risk is the median control group risk across studies. The corresponding risk (and its 95% CI) is based on the assumed risk in the comparison group and the relative effect of the intervention (and its 95% CI). | ||||||
| GRADE Working Group grades of evidence | ||||||
| 1No serious risk of bias: most trials were at low risk of selection bias and used placebos to prevent performance or detection bias. | ||||||
| Vitamin A compared to placebo for adults with HIV infection currently taking ART or not | ||||||
| Participant or population: adults with HIV infection | ||||||
| Outcomes | Illustrative comparative risks* (95% CI) | Relative effect | Number of participants | Certainty of the evidence | Comments | |
| Assumed risk | Corresponding risk | |||||
| Placebo | Vitamin A | |||||
| Mortality | — | — | — | (0 trials) | — | — |
| Morbidity | — | — | — | (0 trials) | — | — |
| CD4 cell count (cells/mm³) | — | — | Not pooled | 464 | ⊕⊕⊝⊝ due to risk of bias and indirectness | Vitamin A may have little or no short‐term effect on CD4 cell count |
| Viral load (log10copies/mL) | — | — | Not pooled | 495 | ⊕⊕⊝⊝ due to risk of bias and indirectness | Vitamin A may have little or no short‐term effect on viral load |
| Change in vitamin A concentrations (µmol/L) | — | — | Not pooled | 495 (3 trials) | ⊕⊕⊝⊝ due to risk of bias and indirectness | Vitamin A may increase blood concentrations of persons with HIV with low baseline concentrations |
| *The basis for the assumed risk (for example, the median control group risk across studies) is provided in footnotes. The corresponding risk (and its 95% CI) is based on the assumed risk in the comparison group and the relative effect of the intervention (and its 95% CI). | ||||||
| GRADE Working Group grades of evidence | ||||||
| 1Downgraded by 1 for serious risk of bias: one trial in Kenya with 400 participants reported high attrition overall (11.5%) and the trial authors stated that participants who were lost to follow‐up had more advanced HIV disease and were more likely to be vitamin A deficient (Baeten 2002 KEN). | ||||||
| Vitamin D compared to placebo for adults with HIV infection | ||||||
| Participant or population: adults with HIV infection | ||||||
| Outcomes | Illustrative comparative risks* (95% CI) | Relative effect | Number of participants | Certainty of the evidence | Comments | |
| Assumed risk | Corresponding risk | |||||
| Placebo | Vitamin D | |||||
| Mortality Follow‐up: 12 months | 254 per 1000 | 292 per 1000 (165 to 513) | RR 1.15 (0.65 to 2.02) | 131 | ⊕⊝⊝⊝ due to indirectness and imprecision | We don't know if vitamin D supplements have any effect on mortality |
| Morbidity | — | — | — | (0 trials) | — | — |
| CD4 cell count (cells/mm³) | — | — | Not pooled | 288 | ⊕⊕⊝⊝ due to indirectness | Vitamin D supplements may have little or no effect on CD4 cell count |
| Viral load (log10copies/mL) Follow‐up: 12 months | The mean in the placebo group was 3.78 | The mean in the multiple micronutrient groups was 0.66 lower (1.37 lower to 0.05 higher) | — | 28 participants (1 trial) | ⊕⊝⊝⊝ due to indirectness and imprecision | We don't know if vitamin D supplements have an effect on viral load |
| Change in 25(OH) vitamin D concentrations (ng/mL) | — | — | Not pooled | 299 | ⊕⊕⊕⊝ due to indirectness | Vitamin D supplements probably increase blood 25(OH) vitamin D levels |
| *The basis for the assumed risk (for example, the median control group risk across studies) is provided in footnotes. The corresponding risk (and its 95% CI) is based on the assumed risk in the comparison group and the relative effect of the intervention (and its 95% CI). | ||||||
| GRADE Working Group grades of evidence | ||||||
| 1No serious risk of bias: the included trials were generally at low risk of bias. | ||||||
| Zinc compared to placebo for adults with HIV infection | ||||||
| Participant or population: adults with HIV infection | ||||||
| Outcomes | Illustrative comparative risks* (95% CI) | Relative effect | Number of participants | Certainty of the evidence | Comments | |
| Assumed risk | Corresponding risk | |||||
| Placebo | Zinc | |||||
| Mortality | 110 per 1000 | 135 per 1000 (58 to 315) | RR 1.24 | 433 | ⊕⊝⊝⊝ due to indirectness and imprecision | We don't know if zinc supplements have any effect on mortality |
| Rate of diarrhoea | — | — | OR 0.40 | 231 (1 trial) | ⊕⊝⊝⊝ due to indirectness and imprecision | We don't know if zinc supplements have any effect on the frequency of diarrhoea |
| Change in CD4 cell count (cells/mm³) Follow‐up: 1 to 18 months | — | — | Not pooled | 431 | ⊕⊕⊝⊝ due to indirectness and inconsistency | Zinc supplements may have little or no effect on CD4 cell count |
| Change in viral load (log10copies/mL) Follow‐up: 1 to 18 months | — | — | Not pooled | 400 | ⊕⊕⊝⊝ due to indirectness and imprecision | Zinc supplements may have little or no effect on viral load |
| Change in blood zinc concentrations Follow‐up: 1 to 18 months | — | — | Not pooled | 484 (4 trials) | ⊕⊕⊕⊝ due to indirectness | Zinc supplements probably increase blood zinc concentrations of persons with HIV with low baseline concentrations |
| *The basis for the assumed risk (for example, the median control group risk across studies) is provided in footnotes. The corresponding risk (and its 95% CI) is based on the assumed risk in the comparison group and the relative effect of the intervention (and its 95% CI). | ||||||
| GRADE Working Group grades of evidence | ||||||
| 1No serious risk of bias: the included studies were generally at low risk of bias. | ||||||
| Selenium compared to placebo for adults with HIV infection | ||||||
| Participant or population: adults with HIV infection | ||||||
| Outcomes | Illustrative comparative risks* (95% CI) | Relative effect | Number of participants | Certainty of the evidence | Comments | |
| Assumed risk | Corresponding risk | |||||
| Placebo | Selenium | |||||
| Mortality | — | — | — | (0 trials) | — | — |
| Hospital admissions | 309 per 1000 | 124 per 1000 | RR 0.4 | 186 | ⊕⊝⊝⊝ due to risk of bias, indirectness, and imprecision | We don't know if selenium supplements reduce hospital admissions |
| Change in CD4 cell count (cells/mm³) Follow‐up: 9 to 24 months | — | — | Not pooled | 1187 participants | ⊕⊕⊝⊝ due to risk of bias and imprecision | Selenium supplements may have little or no effect on CD4 cell count |
| Change in viral load (log10copies/mL) Follow‐up: 24 months | — | — | Not estimable | 439 participants | ⊕⊕⊝⊝ | Selenium supplements may have little or no effect on viral load |
| Change in selenium concentrations (µg/L) | — | — | Not pooled | 527 | ⊕⊕⊝⊝ | Selenium supplements may increase blood selenium concentrations |
| *The basis for the assumed risk (for example, the median control group risk across studies) is provided in footnotes. The corresponding risk (and its 95% CI) is based on the assumed risk in the comparison group and the relative effect of the intervention (and its 95% CI). | ||||||
| GRADE Working Group grades of evidence | ||||||
| 1Downgraded by 1 for serious risk of bias: high attrition due to participants with incomplete medical records. In addition, fewer participants in the placebo group compared to the selenium group were on antiretroviral therapy (ART) at baseline (Burbano 2002 USA). | ||||||
| Outcome | Power | Two‐sided significance level | Risk in control group | Relative risk reduction | Risk in intervention group | Sample size (total) |
| Death | 80% | 95% | 15.5%1 | 25% | 11.6% | 2412 |
| Death | 80% | 95% | 8.3%2 | 25% | 6.2% | 4782 |
| Death | 80% | 95% | 5.5%3 | 25% | 4.1% | 7314 |
| CD4 cell count ≤ 350 cells/mm3 4 | 80% | 95% | 10% | 60% | 55% | 2312 |
| CD4 cell count ≤ 350 cells/mm3 4 | 80% | 95% | 25% | 60% | 44% | 314 |
| CD4 cell count ≤ 350 cells/mm3 4 | 80% | 95% | 50% | 60% | 29% | 76 |
| 1Estimated annual risk of death of antiretroviral naive HIV‐infected persons (≥10 years after seroconversion) (Collaborative Group on AIDS Incubation 2000). | ||||||
| Outcome | Power | Two‐sided significance level | Ratio of group 1: group 2 | Mean in control group | SD | Mean in supplement group | SD | Mean difference | Sample size (total) |
| Mean blood 25(OH) vitamin D level at 12 months1 | 80% | 95% | 1 | 17 ng/ml | 9 | 28 ng/ml | 9 | 11.5 | 22 |
| Mean blood 25(OH) vitamin D level at 12 months1 | 80% | 95% | 1 | 17 ng/ml | 20 | 28 ng/ml | 20 | 11.5 | 104 |
| Mean BMI at 24 months3 | 80% | 95% | 1 | 21 kg/m2 | 3 | 22 kg/m2 | 3 | 1 kg/m2 | 284 |
| Mean BMI at 24 months 4 | 80% | 95% | 1 | 21 kg/m2 | 3 | 23 kg/m2 | 3 | 2 kg/m2 | 72 |
| Abbreviations: BMI: body mass index; SD: standard deviation. 1This example is based on data from Stallings 2014 USA. This example uses the SD from the control group. | |||||||||
| Trial ID | Country | Participants | Baseline HAART use (%) | Mean baseline CD4+ cell count (cells/mm3) | Mean baseline viral load (copies/ml or log10 copies/mL) | MMN dose1 | Duration of supplementation |
| Botswana | HIV‐positive | 0 | 423 (median) | 11,800 (median) | High | 24 months | |
| Uganda | HIV‐positive | 49.82 | 145 (median) 137 (median) | N/A | Standard | 18 months | |
| Thailand | HIV‐positive | 0 | 244 (median) | 3.9 (1.0) | High | 48 weeks | |
| Zambia | HIV‐positive plus chronic diarrhoea | 0 | 291 (median) | N/A | High | 2 weeks | |
| Zambia | HIV‐positive | 03 | N/A | N/A | Standard | 1.9 years4 | |
| Kenya | HIV‐positive | 0 | 294 (209) | 5.3 (0.9) | High | 6 weeks | |
| China | HIV‐positive | Not stated | 417 (69) | Not stated | Standard | 6 months | |
| Tanzania | HIV‐positive plus active TB | 0 | 363 (275) | 4.02 (0.98) | High | 8 months | |
| Malawi | HIV‐positive plus active TB | 0 | Not stated | 5.4 (median) | Standard | 24 months5 | |
| Tanzania | HIV‐positive plus active TB | 0 | 305 (227) | 4.6 (1.0) | High | 24 months | |
| Abbreviations: HAART: highly active antiretroviral therapy; MMN: multiple micronutrient; TB: Tuberculosis 1Standard dose supplements provided most of the micronutrients at the level of the Dietary Recommended Intake (DRI). High‐dose supplements provided most of the micronutrients in multiples of the DRI. | |||||||
| Micronutrient | RDA male aged 19 to 70 years | Standard doses1 | High doses2 | Standard dose | High dose | ||||||||
| Vitamin A | 900 µg | — | 200 µg (660 IU) | 2424µg (8000 IU) | — | — | 3182 µg (10500 IU) | 3027 µg (9990 IU) | — | 1500 µg (5000 IU) | 1515 µg (5000 IU) | — | — |
| B‐carotene | — | 4.8 mg | — | — | — | — | — | 6 mg | — | — | — | — | — |
| Vitamin B1 (Thiamine) | 1.2 mg | 1.4 mg | 1 mg | 1.5 mg | 1.4 mg | 20 mg | — | 24 mg | 20 mg | 20 mg | 20 mg | 1.2 mg | 20 mg |
| Vitamin B2 (riboflavin) | 1.3 mg | 1.4 mg | 1 mg | 1.7 mg | 1.4 mg | 20mg | — | 15 mg | 20 mg | 20 mg | 20 mg | 1.2 mg | 20 mg |
| Vitamin B3 (niacin) | 16 mg | 18 mg | ‐ | 20 mg | 18 mg | 100 mg | — | 54 mg | 100mg | 40 mg | 100 mg | 15 mg | 100 mg |
| Vitamin B6 (pyridoxine) | 1.3 to 1.7 mg | 1.9 mg | 1 mg | 2 mg | 1.9 mg | 25 mg | — | 40mg | 25 mg | 25 mg | 25 mg | 1.3mg | 25 mg |
| Vitamin B9 | 400 µg | 400 µg | 150 µg | 400 µg | 400 µg | 800 µg | 5000 µg | 100 µg | 800 µg | 800 µg | 800 µg | 400 µg | 800 µg |
| Vitamin B12 | 2.4 µg | 2.6 µg | 6 µg | 2.6 µg | 50 µg | — | 30µg | 50 µg | 50 µg | 50 µg | 2.4 µg | 50 µg | |
| Panthothenic acid | 5 mg | — | — | — | — | — | — | 40 mg | — | — | — | — | — |
| Vitamin E | 15 mg | 10 mg | 15 mg | 133 mg | 10 mg | 30 mg | 300 mg | 80 mg | 30 mg | 60 mg | 200 mg | 15 mg | 30 mg |
| Vitamin D | 5 to 15 µg (200 to 600 IU) | 5 µg (200 IU) | 5 µg (200 IU) | 10 µg (400 IU) | — | — | — | 20 µg (800 IU) | — | 5 µg (200 IU) | — | — | — |
| Vitamin K | 120 µg | — | — | — | — | — | — | 180 µg | — | — | — | — | — |
| Vitamin C | 90 mg | 70 mg | 100 mg | 500 mg | 70 mg | 500 mg | 300 mg | 400 mg | 500 mg | 200 mg | 500 mg | 80 mg | 500 mg |
| Selenium | 55 µg | 65 µg | 30 µg | 65 µg | — | 200 µg | 150 µg | 400 µg | 200 µg | 200 µg | 100 µg | — | — |
| Iron | 8 mg | 6 mg | — | — | — | — | 10 mg | — | — | — | — | — | |
| Zinc | 11 mg | 15 mg | 5 mg | 10 mg | — | — | 200 mg | 30 mg | — | 45 mg | — | — | — |
| Copper | 0.9 mg | — | — | — | — | — | — | 3 mg | — | 5 mg | — | — | — |
| Iodine | 150 µg | — | — | 175 µg | — | — | — | 300 µg | — | — | — | — | — |
| Chromium | 35 µg | — | — | — | — | — | — | 150 µg | — | — | — | — | — |
| Manganese | 2.3 mg | — | — | — | — | — | — | 8 mg | — | — | — | — | — |
| Calcium | 1000 mg | — | 400 mg | — | — | — | — | — | — | — | — | — | — |
| Abbreviations: IU: International units; RDA:Recommended Daily Allowance 1Standard dose supplements provided most of the micronutrients at the level of the RDA. | |||||||||||||
| Trial ID | Statistical measure | Intervention | Control | Timing of endpoint | Difference between groups | ||||
| Baseline | Endpoint | N1 | Baseline | Endpoint | N1 | ||||
| Median (IQR) | 145 (86 to 215) | Not reported | 200 | 137 (68 to 192) | Not reported | 200 | 18 months | MD ‐ 6.17 (95% CI ‐29.3 to 16.9)2 | |
| Median (IQR) | 244 (52 to 544) | 200 (66 to 358) | 192 | 261 (50 to 550) | 232 (73 to 377) | 184 | 48 weeks | "Did not differ" | |
| Median (IQR) | 292 | Not reported | 66 | 282 | Not reported | 69 | 4 weeks | "Not different"3 | |
| Mean (SD) | 370 (190) | 415 (242) | 41 | 365 (212) | 409 (192) | 43 | 1.9 years3 | P = 0.55 | |
| Mean (SD) | 294 (209) | 300 (205) | 179 | 262 (202) | 265 (189) | 178 | 6 weeks | Adjusted regression co‐efficient 23 (95% CI 3 to 43); P = 0.03 | |
| Mean (SD) | 417 (69) | 589 (85) | 50 | 466 (72) | 483 (59) | 49 | 6 months | P < 0.05 | |
| Mean (SD) | 460 (391) | 423 (373) | 48 | 460 (385) | 403 (460) | 48 | 8 weeks | P = 0.18 | |
| Mean (SD) | 305 (277) | Not reported | 200 | 339 (256) | 340 (240) | 204 | 2 years5 | MD ‐5 (−37 to 26); P = 0.74 | |
| Median (IQR) | 428 (336 to 555) | Not reported | 220 | 411 (327 to 545) | Not reported | 217 | 2 years | Not reported7 | |
| Abbreviations: IQR: Interquartile range; MD: Mean difference; SD: Standard deviation 1The number of participants stated is the number assessed for end‐point data. | |||||||||
| Trial ID | Statistical measure | Intervention | Control | Timing of endpoint | Difference between groups | ||||
| Baseline | Endpoint | N1 | Baseline | Endpoint | N1 | ||||
| Median (IQR) | 4.0 (3.3‐4.7) | Not reported2 | 220 | 4.3 (3.6 to 4.8) | Not reported2 | 217 | 24 months | P = 0.43 | |
| Mean (SD) | 3.9 | 4.4 (1.4) | 714 | 4.2 | 4.5 (1.54) | 69 | 48 weeks | P = 0.4 | |
| Mean (SD) | 5.3 (0.9) | 5.3 (0.9) | 179 | 5.4 (0.9) | 5.4 (0.9) | 178 | 6 weeks | P = 0.4 | |
| Mean (SD) | 3.72 (1.18) | 3.85 (1.4) | 48 | 3.9 (1.33) | 4.1 (1.54) | 48 | 8 weeks | "Not significant"5 | |
| Mean (SD) | 4.6 (1.0) | Not reported | 71 | 4.6 (0.9) | 4.74 (1.54) | 69 | 2 years6 | MD −0.08 (−0.22 to 0.05); P = 0.23 | |
| Abbreviations: CI: Confidence interval; IQR: Interquartile range; MD: Mean difference; SD: Standard deviation 1The number of participants stated is the number assessed for end‐point data. | |||||||||
| Trial ID | Nutritional parameter | Statistical measure | Intervention | Control | Timing of endpoint | Difference between groups | ||||
| Baseline | Endpoint | N1 | Baseline | Endpoint | N1 | |||||
| BMI (kg/m2) | Mean (SD) | 19.3 (2.8) | Not reported | 233 | 19.6 (2.9) | 21.2 (3.3) | 238 | 2 years2 | MD ‐0.1 (−0.4 to 0.2); P = 0.37 | |
| Weight (kg) Haemoglobin (g/dL) | Not reported Median (IQR) | Not reported 12.2 (11.2 to 13.2) | Not reported Not reported | 200 200 | Not reported 12.3 (11.3 to 13.5) | Not reported Not reported | 200 200 | 18 months 18 months | MD 0.54 (−0.40 to 1.48); P = 0.691 MD 0.16 (−0.21 to 0.16); P = 0.977 | |
| Blood vitamin E (µmol/L)3 | Mean (SD) | 22 (9) | Not reported | Not reported | 19 (7) | Not reported | Not reported | 48 weeks | MD 10.7 (7.0 to 14.3)4; P < 0.001 | |
| Blood selenium (µmol/L)5 | Mean (SD) | 1.6 (0.2) | Not reported | Not reported | 1.6 (0.2) | Not reported | Not reported | 48 weeks | MD 0.16 (0.0 to 0.34)6; P = 0.04 | |
| Blood vitamin A (µmol/L)7,8 | Mean | 0.63 | Not reported | 66 | 0.65 | Not reported | 69 | 4 weeks | P = 0.21 | |
| Blood vitamin E (µmol/L)3,8 | Mean | 11.4 | Not reported | 66 | 11.7 | Not reported | 69 | 4 weeks | "No difference" | |
| BMI (kg/m2) MUAC (cm) Fat mass (kg) Lean body mass (kg) Grip strength (kg) | Not reported | Not reported | Not reported | Not reported | Not reported | Not reported | Not reported | 1.9 years 9 | "No significant differences at any time point" | |
| Blood vitamin A (µmol/L)7,11 | Geometric mean | 0.59 | Reported in a graph | 383 | 0.59 | Reported in a graph | 397 | 8 months | "Significantly higher" | |
| Blood selenium (µmol/L)10,11 | Geometric mean | 0.66 | Reported in a graph | 392 | 0.64 | Reported in graph | 405 | 8 months | ||
| Abbreviations: BMI: Body Mass Index; IQR: Interquartile range; MUAC: Mid‐upper arm circumference; MD: Mean difference; SD: Standard deviation 1The number of participants stated is the number assessed for endpoint data. | ||||||||||
| Multiple micronutrients compared to placebo for adults with HIV infection not currently taking ART | ||||||
| Participant or population: adults with HIV infection not currently taking ART | ||||||
| Outcomes | Illustrative comparative risks* (95% CI) | Relative effect | Number of participants | Certainty of the evidence | Comments | |
| Assumed risk | Corresponding risk | |||||
| Placebo | Micronutrients | |||||
| Mortality Follow‐up: 12 to 24 months | 45 per 1000 | 26 per 1000 | RR 0.60 (0.31 to 1.15) | 1068 | ⊕⊕⊝⊝ due to indirectness and imprecision | Multiple micronutrients may reduce mortality |
| Hospital admissions Follow‐up: 48 weeks | 84 per 1000 | 66 per 1000 (35 to 125) | RR 0.79 (0.42 to 1.49) | 481 (1 trial) | ⊕⊝⊝⊝ due to indirectness and imprecision | We don't know if multiple micronutrients have any effect on hospital admissions |
| CD4 cell count Follow‐up: 6 weeks to 2 years | The mean in the placebo groups ranged from 265 to 409 cells/mm³ | The mean in the multiple micronutrient group was 30.36 cells/mm³ higher (7.13 lower to 67.84 higher) | — | 441 | ⊕⊕⊝⊝ low1,6,7 due to indirectness and inconsistency | Multiple micronutrients may have little or no effect on CD4+ cell count |
| Viral load Follow‐up: 6 to 48 weeks | The mean in the placebo groups ranged from 4.4 to 5.3 log10copies/mL | The mean in the multiple micronutrient groups was 0.10 log10copies/mL lower (0.27 lower to 0.07 higher) | — | 497 (2 trials) | ⊕⊕⊕⊝ due to indirectness | Multiple micronutrients probably have little or no effect on viral load |
| BMI (kg/m²) Follow‐up: 1.9 years | — | — | — | 84 | ⊕⊝⊝⊝ due to indirectness and imprecision | We don't know if multiple micronutrients have any effect on BMI |
| The basis for the assumed risk is the median control group risk across studies. The corresponding risk (and its 95% CI) is based on the assumed risk in the comparison group and the relative effect of the intervention (and its 95% CI). | ||||||
| GRADE Working Group grades of evidence | ||||||
| 1No serious risk of bias: all trials were at low risk of selection bias. Appropriate methods of blinding were used. | ||||||
| Multiple micronutrients compared to placebo for adults with HIV infection currently taking ART | ||||||
| Participant or population: adults with HIV infection currently taking ART | ||||||
| Outcomes | Illustrative comparative risks* (95% CI) | Relative effect | Number of participants | Certainty of the evidence | Comments | |
| Assumed risk | Corresponding risk | |||||
| Placebo | Micronutrients | |||||
| Mortality Follow‐up: 12 to 24 months | 40 per 1000 | 50 per 1000 | RR 1,25 (0.50 to 3.10) | 400 | ⊕⊝⊝⊝ due to indirectness and imprecision | We don't know if multiple micronutrients have any effect on mortality |
| Hospital admissions Follow‐up: 48 weeks | 195 per 1000 | 176 per 1000 | RR 0.90 (0.59 to 1.36) | 400 | ⊕⊝⊝⊝ due to indirectness and imprecision | We don't know if multiple micronutrients have any effect on mortality |
| CD4 cell count Follow‐up: 18 months | The mean change in the placebo group was 147 cells/mm³ | The mean change in the multiple micronutrient group was 6.17 cells/mm³lower (29.3 lower to 16.9 higher) | _ | 367 | ⊕⊝⊝⊝ due to indirectness and imprecision | We don't know if multiple micronutrients have any effect on CD4 cell count |
| Viral load | — | — | — | — | — | — |
| Weight (kg) Follow‐up: 18 months | The mean change in the placebo group was 3.3 kg | The mean change in the multiple micronutrient group was 0.54 kg higher (0.40 lower to 1.48 higher) | 400 | ⊕⊝⊝⊝ due to indirectness and imprecision | We don't know if multiple micronutrients have any effect on weight | |
| *The basis for the assumed risk (for example, the median control group risk across studies) is provided in footnotes. The corresponding risk (and its 95% CI) is based on the assumed risk in the comparison group and the relative effect of the intervention (and its 95% CI). | ||||||
| GRADE Working Group grades of evidence | ||||||
| 1No serious risk of bias: this trial was at low risk of selection bias. The trial authors used appropriate methods of blinding. | ||||||
| Multiple micronutrients compared to placebo for adults with HIV infection and concurrent active tuberculosis not currently taking ART | ||||||
| Participant or population: adults with HIV infection and concurrent active tuberculosis not currently taking ART | ||||||
| Outcomes | Illustrative comparative risks* (95% CI) | Relative effect | Number of participants | Certainty of the evidence | Comments | |
| Assumed risk | Corresponding risk | |||||
| Placebo | Micronutrients | |||||
| Mortality Follow‐up: 8 to 24 months | 357 per 1000 | 328 per 1000 | RR 0.92 (0.69 to 1.23) | 1429 | ⊕⊕⊝⊝ due to indirectness and imprecision | Multiple micronutrients may have little or no effect on mortality |
| Clinical disease progression from stage 3 to stage 4 Follow‐up: 24 months | — | — | HR 1.08 (0.72 to 1.62 | 313 (1 trial) | ⊕⊝⊝⊝ very low1,4,5 due to indirectness and imprecision | We don't know if multiple micronutrients have any effect on clinical disease progression |
| CD4 cell count Follow‐up: 2 to 24 months | The mean in the placebo groups ranged from 340 to 403 cells/mm³ | The mean in the multiple micronutrient group was 5.77 cells/mm³ lower (55.8 lower to 44.25 higher) | — | 674 | ⊕⊕⊝⊝ low1,3,4 due to indirectness and imprecision | Multiple micronutrients may have no effect on CD4 cell count |
| Viral load Follow‐up: 2 to 24 months | The mean in the placebo groups ranged from 4.1 to 4.7 log10copies/mL | The mean in the multiple micronutrient groups was 0.09 log10copies/mL lower (0.45 lower to 0.26 higher) | — | 343 (2 trials) | ⊕⊕⊝⊝ low1,3,4 due to indirectness and imprecision | Multiple micronutrients may have no effect on viral load |
| BMI Follow‐up: 24 months | The mean BMI in the placebo group was 21.2 kg/m2 | The mean BMI in the micronutrient group was 0.1 lower (0.4 lower to 0.2 higher) | — | 471 | ⊕⊝⊝⊝ very low1,4,5 due to indirectness and imprecision | We don't know if multiple micronutrients have any effect on BMI |
| *The basis for the assumed risk (for example, the median control group risk across studies) is provided in footnotes. The corresponding risk (and its 95% CI) is based on the assumed risk in the comparison group and the relative effect of the intervention (and its 95% CI). | ||||||
| GRADE Working Group grades of evidence | ||||||
| 1No serious risk of bias: the trials were at low risk of selection bias, except for two trials that recruited both HIV‐positive and HIV‐negative participants and did not stratify the randomization (Range 2006 TZA; Semba 2007 MWI). The trials used appropriate methods of blinding. | ||||||
| Trial ID | Country | Participants | Baseline ART use | Mean baseline blood vitamin A concentration (µmol/L)1 | Mean baseline CD4+ cell count (cells/mm3) | Mean baseline viral load (log10 copies/mL) | Dose2 | Duration of supplementation |
| Kenia | HIV‐positive women | 0% | 0.097 (median) 0.095 (median) | 240 (median) 203 (median) | 5.34 (median) 5.54 (median) | 10,000 IU retinol daily | 6 weeks | |
| USA | HIV‐positive women | 49% | 1.52 (0.42) 1.41 (0.31) | Not reported | Not reported | 300,000 IU retinol | Single dose | |
| USA | HIV‐positive IDUs | 46% | 1.61 1.37 | 296 (median) 259 (median) | 9.49 (median) 9.67 (median) | 200,000 IU retinol | Single dose | |
| USA | HIV‐positive | 94% | — | — | — | 180 mg β‐carotene | 4 weeks | |
| Abbreviations: IDUs: Injection drug users; IU: International units; RDA: Recommended Daily Allowance 1Reference value for vitamin A sufficiency: > 1.05 µmol/L. | ||||||||
| Trial ID | Statistical measure | Intervention | Control | Timing of end‐point | Difference between groups | ||||
| Baseline | End‐point | N1 | Baseline | End‐point | N1 | ||||
| Median | 296 | Reported in a graph | Not reported2 | 259 | Reported in a graph | Not reported2 | 4 weeks | P = 0.17 | |
| Median | 240 | 272 | 176 | 203 | 225 | 178 | 6 weeks | P = 0.04 Adjusted regression coefficient 0.34 −0.22 to 0.90); P = 0.90 | |
| 1The number of participants stated is the number assessed for endpoint data. | |||||||||
| Trial ID | Statistical measure | Intervention | Control | Timing of endpoint | Difference between groups | ||||
| Baseline | Endpoint | N1 | Baseline | Endpoint | N1 | ||||
| Median | 9.49 | Reported in a graph | Not reported2 | 9.67 | Not reported | Not reported2 | 4 weeks | P = 0.17 | |
| Geometric mean | Reported in a graph | Reported in a graph | 19 | Reported in a graph | Reported in a graph | 12 | 8 weeks | P = 0.56 | |
| Median | 5.34 | 5.34 | 176 | 5.54 | 5.49 | 178 | 6 weeks | P = 0.1 | |
| 1The number of participants stated is the number assessed for endpoint data. | |||||||||
| Trial ID | Nutritional parameter | Statistical Measure | Intervention | Control | Timing of endpoint | Difference between groups | ||||
| Baseline | Endpoint | N1 | Baseline | Endpoint | N1 | |||||
| Vitamin A (µmol/L)2 | Median | 0.97 | 1.03 | Not reported | 0.95 | 0.94 | Not reported | 6 weeks | P = 0.03. "No effect" reported for those who were severely deficient at baseline | |
| Vitamin A (µmol/L)3 | Median | 1.61 | Presented in a graph | Not reported | 1.37 | Presented in a graph | Not reported | 4 weeks | "Not different" | |
| Vitamin A (µmol/L)3 | Median | 1.56 | 1.54 | 20 | 1.37 | 1.30 | 15 | 4 weeks | "No change" | |
| 1The number of participants stated is the number assessed for endpoint data. | ||||||||||
| Trial ID | Country | Participants | Baseline ART use | Mean baseline blood 25(OH)2 vitamin D concentration (ng/mL)1 | Mean baseline CD4+ cell count (cells/mm3) | Mean baseline viral load (log10 copies/mL) | Dose2 | Duration of supplementation |
| Denmark | HIV‐positive men | 100% | 27.2 (11.5) 29.2 (12.4) | 507 (268) 463 (197) | Not reported | 100,000 IU then 1200 IU | Single dose at baseline then daily for 16 weeks (plus 1200 mg calcium daily) | |
| Italy | HIV‐positive; ≤ 30 years | 86% | 15 (median)3 | 663 (median) 673 (median) | Not reported | 100,000 IU | Single dose at baseline and at 3, 6, and 9 months | |
| USA | HIV‐positive men and women | 0%4 | 26.7 (median) 25.1 (median) | 346 (median) 337 (median) | 4.5 | 4000 IU | Daily for 48 weeks (plus 100 mg calcium) | |
| USA | HIV‐positive; ≤ 25 years | 76% | 18.2 (8.4) 17.7 (9) | Not reported5 | 3.17 (0.96)6 | 7000 IU | Daily for 12 months | |
| Guinea‐Bissau | HIV‐positive plus active TB | 0% | Not reported for HIV‐positive participants | Not reported for HIV‐positive participants | Not reported | 100,000 IU | Single dose at baseline, 5, 8 months | |
| Abbreviations: ART: antiretroviral therapy; IU: International units; TB: Tuberculosis 1Reference value for vitamin D sufficiency: 25 (OH) vitamin D ≥ 30 ng/mL. | ||||||||
| Trial ID | Statistical measure | Baseline | Endpoint | Timing of endpoint | Difference between groups | ||||
| Intervention | Control | N1 | Intervention | Control | N1 | ||||
| Mean (SD) | 507 (268) | 463 (197) | 17 | Not reported | Not reported | 15 | 16 weeks | "No changes" in naïve or activated CD4+ cell counts | |
| Median | 15 | 15 | 25 | Not reported | Not reported | 25 | 12 months | MD 58.1 (−114.5 to 230.7)2 | |
| Median | 346 | 342 | 79 | 5513 | 5263 | 86 | 48 weeks | P = 0.90 | |
| Mean | Not reported | Not reported | Not reported | Not reported | Not reported | Not reported | 8 months | MD −22 (P = 0.17)4 | |
| Abbreviations: MD: Mean difference; SD: Standard deviation 1The number of participants stated is the number assessed for endpoint data. | |||||||||
| Trial ID | Nutritional parameter | Statistical Measure | Intervention | Control | Timing of endpoint | Difference between groups | ||||
| Baseline | Endpoint | N1 | Baseline | Endpoint | N1 | |||||
| 25(OH) vitamin D (ng/mL)2 | Mean (SD) | 27.2 (11.5) | 31.6 (9.9) | 17 | 29.2 (12.4) | 19.2 (13.9) | 15 | 16 weeks | P < 0.001 | |
| 25(OH) vitamin D (ng/mL)2 | Median | 15 | Not reported | 25 | 15 | Not reported | 25 | 12 months | MD 12.5 (5.9 to 19) P < 0.001 | |
| 25(OH) vitamin D (ng/mL)2 | Median | 26.7 | 56.4 | 79 | 25.1 | 26.2 | 86 | 48 weeks | P < 0.001 | |
| 25(OH) vitamin D (ng/mL)2 | Mean (SD) | 10.3 (6.4) | 17 (13.1) | 30 | 11.3 (7.6) | 10.5 (6.2) | 28 | 12 months | P < 0.001 | |
| Abbreviations: MD: Mean difference; SD: Standard deviation 1The number of participants stated is the number assessed for end‐point data. | ||||||||||
| Trial ID | Country | Participants | Baseline ART use | Mean baseline blood zinc concentration (µg/L)1 | Mean baseline CD4+ cell count (cells/mm3) | Mean baseline viral load (copies/mL or log10 copies/mL) | Dose2 | Duration of supplementation |
| Thailand | HIV‐positive | 100% with immunological discordance | 80 (median) 76 (median) | 183 (median) 162 (median) | Not reported | 15 mg daily | 6 months | |
| USA | HIV‐positive | 62%4 | 60 (10)5 | 373 (280) | 4.0 (1.0) | 12 mg (women) 15 mg (men) | 18 months | |
| Peru | HIV‐positive plus persistent diarrhoea | 0% | 66 (median) 65 (median) | 65 (median) 55 (median) | Not reported | 50 mg twice daily | 14 days | |
| Singapore | HIV‐positive | 95% | 86.9 (15.0) 92.2 (18.3) | 112 (62) 131 (65) | 26 338 (38 335) 28 093 (41 056 | 50 mg daily | 28 days | |
| Nigeria | HIV‐positive plus active TB | 0% | Not reported | Not reported | Not reported | 90 mg weekly6 | 6 months | |
| Tanzania | HIV‐positive plus active TB | 0% | Not reported | 406 (median) 460 (median) | 3.83 (median) 3.90 (median) | 45 mg daily | 8 months | |
| Abbreviations: ART: Antiretroviral therapy; RDA: Recommended Daily Allowance; TB: Tuberculosis 1Reference value for zinc sufficiency: > 70 µg/L. | ||||||||
| Trial ID | Statistical measure | Intervention | Control | Timing of endpoint | Difference between groups at endpoint (as reported by trial authors) | ||||
| Baseline | Endpoint | N1 | Baseline | Endpoint | N1 | ||||
| Median (IQR) | 183 (151 to 213) | 250 (190 to 286) | 13 | 162 (139 to 182) | 192 (162 to 254) | 17 | 6 months | Supplementation increased median CD4+ in those with low zinc at baseline (P = 0.042) but not those with normal zinc (P > 0.05) | |
| Mean (SD) | 385 (285) | Not reported | 104 | 361 (275) | Not reported | 96 | 18 months | Reduced risk of CD4+ < 200 cells/µL2 with intervention (RR 0.24, 95% CI 0.10 to 0.56) | |
| Median | 66 | Not reported | — | 65 | Not reported | — | — | Not reported | |
| Mean (SD) | 113 (61) | 127 (73) | 30 | 134 (63) | 156 (75) | 33 | 28 days | P = 0.91 | |
| Mean (95% CI) | 406 (327 to 485) | 422 (331 to 512) | 58 | 460 | 403 (309 to 569) | 48 | 2 months | "Not significant" | |
| Abbreviations: CI: Confidence interval; IQR: Interquartile range; RR: Relative risk; SD: Standard deviation 1The number of participants stated is the number assessed for endpoint data. | |||||||||
| Trial ID | Statistical measure | Intervention | Control | Timing of endpoint | Difference between groups | ||||
| Baseline | Endpoint | N1 | Baseline | Endpoint | N1 | ||||
| Mean (SD) | 4.0 (1.0) | Not reported | 115 | 4.0 (1.1) | Not reported | 116 | 18 months | "Not affected by supplementation" | |
| Mean (SD) | 24,740 (36,856) | 27,652 (39,418) | 30 | 26,286 (40,297) | 24,551 (39,013) | 33 | 28 days | P = 0.26 | |
| Mean | 3.83 (3.52 to 4.15) | 4.28 (3.86 to 4.71) | 58 | 3.9 (3.53 to 4.27) | 4.1 (3.67 to 4.54) | 48 | 2 months | "Not significant" | |
| Abbreviations: CI: Confidence interval; SD: Standard deviation; TB: Tuberculosis 1The number of participants stated is the number assessed for endpoint data. | |||||||||
| Trial ID | Nutritional parameter | Statistical Measure | Intervention | Control | Timing of endpoint | Difference between groups | ||||
| Baseline | Endpoint | N1 | Baseline | Endpoint | N1 | |||||
| Blood zinc (µg/L) | Median (IQR) | 80 (66 to 87) | 82 (71 to 100) | 13 | 76 (66 to 88) | 74 (69 to 82) | 17 | 6 months | "higher after zinc supplementation, particularly in patients with low plasma zinc levels at baseline" | |
| Blood zinc (µg/L) | Mean (SD) | 40 (10) | Not reported | Not reported | 40 (11) | Not reported | Not reported | 18 months | Adjusted4 regression coefficient ß = 0.04; P = 0.0472 | |
| Blood zinc (µg/L) | Median | 66 | Not reported | Not reported | 65 | Not reported | Not reported | 14 days | Not reported5 | |
| Blood zinc (µg/L) | Mean (SD) | 92.2 (18.3) | 120.3 (68.0) | 30 | 86.9 (15) | 111.8 (37.9) | 33 | 28 days | P = 0.67 | |
| Abbreviations: IQR: Interquartile range; SD: Standard deviation 1The number of participants stated is the number assessed for endpoint data. | ||||||||||
| Trial ID | Country | Participants | Baseline ART use | Mean baseline blood selenium concentration (µg/l)1 | Mean baseline CD4+ cell count (cells/mm3) | Mean baseline viral load (copies/mL or log10 copies/mL) | Dose2 | Duration of supplementation (months) |
| Botswana | HIV‐positive | 0 % | 65 (10) 70 (24)3 | 423 (median) | 18 500 (median) | 200 µg daily | 24 months | |
| USA | HIV‐positive IDUs | Combination therapy 21% HAART 46%3 | Not reported5 | 427 (421) 378 (295) | 55,257 (147, 152) 60,905 (144, 292) | 200 µg daily | 12 months | |
| USA | HIV‐positive | 73% | Not reported6 | 417 (264) 441 (266) | 24,558 (87,051) 10,491 (20,251) | 200 µg daily | 9 months | |
| Rwanda | HIV‐positive | 0%7 | Not reported | 552 (median) 527 (median) | 3.8 (median) 3.9 (median) | 200 µg daily | 24 months | |
| Abbreviations: ART: antiretroviral therapy; HAART: Highly active antiretroviral therapy; IDUs: injection drug users. 1Reference values used to define selenium sufficiency: > 75 µg/L or > 85 µg/L | ||||||||
| Trial ID | Statistical measure | Intervention | Control | Timing of endpoint | Difference between groups | ||||
| Baseline | Endpoint | N1 | Baseline | Endpoint | N1 | ||||
| Median (IQR) | 423 (347 to 539) | Not reported | 220 | 411 (327 to 545) | Not reported | 217 | 2 years | Not reported2 | |
| Mean (SD) | 427(421) | Not reported | Not reported | 376(295) | Not reported | Not reported | 12 months | Not reported3 | |
| Mean (SD) | 417 (264) | Not reported | Not reported | 441 (266) | Not reported | Not reported | 9 months | Not reported4 | |
| Median (IQR) | 552 (470 to 636) | Not reported | 149 | 527 (465 to 610) | Not reported | 151 | 24 months | Not reported5 | |
| Abbreviations: CI: confidence interval; HR: hazard ratio; IQR: interquartile range; RR: risk ratio; SD: standard deviation | |||||||||
| Trial ID | Nutritional parameter | Statistical measure | Intervention | Control | Timing of endpoint | Comment | ||||
| Baseline | Endpoint | N1 | Baseline | Endpoint | N1 | |||||
| Blood selenium (µg/L) | — | Not reported | Not reported | ‐ | Not reported | Not reported | Not reported | 12 months | Not reported 3 | |
| Blood selenium (µg/L) | — | Not reported | Not reported | 83 | Not reported | Not reported | 91 | 9 months | MD 31.7 (27.4 to 36); P<0.001 | |
| Blood selenium (µg/L) | — | Not reported | Not reported | ‐ | Not reported | Not reported | — | 24 months | — | |
| Sales 20102 | Blood selenium (µg/L)4 | Mean (SD) | 65 (10) | 147 (15.3) | 33 | 70 (24) | 69 (12.1) | 46 | 6 months | P<0.001 |
| Abbreviations: MD: Mean difference; SD: Standard deviation 1The number of participants stated is the number assessed for endpoint data. | ||||||||||
| Outcome or subgroup title | No. of studies | No. of participants | Statistical method | Effect size |
| 1 Mortality Show forest plot | 7 | 2897 | Risk Ratio (M‐H, Random, 95% CI) | 0.91 [0.72, 1.15] |
| 1.1 People with HIV not on ART | 3 | 1068 | Risk Ratio (M‐H, Random, 95% CI) | 0.60 [0.31, 1.15] |
| 1.2 People with HIV on ART or initiating ART | 1 | 400 | Risk Ratio (M‐H, Random, 95% CI) | 1.25 [0.50, 3.10] |
| 1.3 People with HIV not on ART and on treatment for active tuberculosis | 3 | 1429 | Risk Ratio (M‐H, Random, 95% CI) | 0.92 [0.69, 1.23] |
| 2 Hospital admissions Show forest plot | 2 | 881 | Risk Ratio (M‐H, Random, 95% CI) | 0.86 [0.61, 1.22] |
| 2.1 People with HIV not on ART | 1 | 481 | Risk Ratio (M‐H, Random, 95% CI) | 0.79 [0.42, 1.49] |
| 2.2 People with HIV on ART | 1 | 400 | Risk Ratio (M‐H, Random, 95% CI) | 0.90 [0.59, 1.36] |
| 3 Clinical disease progression Show forest plot | 1 | Hazard Ratio (Random, 95% CI) | 1.08 [0.72, 1.62] | |
| 3.1 People with HIV not on ART and on treatment for active tuberculosis | 1 | Hazard Ratio (Random, 95% CI) | 1.08 [0.72, 1.62] | |
| 4 CD4+ cell count Show forest plot | 6 | Mean Difference (IV, Random, 95% CI) | Subtotals only | |
| 4.1 At baseline | 5 | 1209 | Mean Difference (IV, Random, 95% CI) | ‐18.27 [‐55.97, 19.42] |
| 4.2 At longest follow‐up | 6 | 1533 | Mean Difference (IV, Random, 95% CI) | 26.40 [‐22.91, 75.70] |
| 5 CD4+ cell count at longest follow‐up; subgrouped by participant characteristics Show forest plot | 6 | Mean Difference (IV, Random, 95% CI) | Subtotals only | |
| 5.1 People with HIV not on ART | 2 | 441 | Mean Difference (IV, Random, 95% CI) | 30.36 [‐7.13, 67.84] |
| 5.2 People with HIV on ART or initiating ART | 1 | 367 | Mean Difference (IV, Random, 95% CI) | ‐6.0 [‐35.87, 23.87] |
| 5.3 People with HIV not on ART and on treatment for active tuberculosis | 2 | 626 | Mean Difference (IV, Random, 95% CI) | ‐5.77 [‐55.80, 44.25] |
| 5.4 People with HIV ‐ Not stated if they are taking ART | 1 | 99 | Mean Difference (IV, Random, 95% CI) | 106.0 [77.23, 134.77] |
| 6 Viral load Show forest plot | 4 | Mean Difference (IV, Random, 95% CI) | Subtotals only | |
| 6.1 At baseline | 4 | 1166 | Mean Difference (IV, Random, 95% CI) | ‐0.05 [‐0.16, 0.07] |
| 6.2 At longest follow‐up | 4 | 792 | Mean Difference (IV, Random, 95% CI) | ‐0.10 [‐0.26, 0.06] |
| 7 Viral load at longest follow‐up; sub‐grouped by participant characteristics Show forest plot | 4 | Mean Difference (IV, Random, 95% CI) | Subtotals only | |
| 7.1 People with HIV not on ART | 2 | 497 | Mean Difference (IV, Random, 95% CI) | ‐0.10 [‐0.27, 0.07] |
| 7.2 People with HIV not on ART but in treatment for active tuberculosis | 2 | 295 | Mean Difference (IV, Random, 95% CI) | ‐0.09 [‐0.45, 0.26] |
| Outcome or subgroup title | No. of studies | No. of participants | Statistical method | Effect size |
| 1 Mortality Show forest plot | 1 | 3418 | Risk Ratio (M‐H, Fixed, 95% CI) | 1.06 [0.89, 1.26] |
| 1.1 People with HIV on ART or initiating ART | 1 | 3418 | Risk Ratio (M‐H, Fixed, 95% CI) | 1.06 [0.89, 1.26] |
| 2 CD4+ cell count Show forest plot | 1 | 6186 | Mean Difference (IV, Fixed, 95% CI) | ‐8.20 [‐14.08, ‐2.32] |
| 2.1 At baseline | 1 | 3418 | Mean Difference (IV, Fixed, 95% CI) | ‐7.0 [‐13.74, ‐0.26] |
| 2.2 At follow‐up | 1 | 2768 | Mean Difference (IV, Fixed, 95% CI) | ‐12.0 [‐22.00, ‐0.00] |
| 3 Viral load Show forest plot | 1 | Mean Difference (IV, Fixed, 95% CI) | Subtotals only | |
| 3.1 Baseline | 1 | 3418 | Mean Difference (IV, Fixed, 95% CI) | 0.0 [‐0.05, 0.05] |
| 3.2 At follow‐up | 1 | 236 | Mean Difference (IV, Fixed, 95% CI) | ‐0.20 [‐0.51, 0.11] |
| Outcome or subgroup title | No. of studies | No. of participants | Statistical method | Effect size |
| 1 Mortality Show forest plot | 1 | Risk Ratio (M‐H, Random, 95% CI) | Subtotals only | |
| 1.1 People with HIV not on ART and on treatment for active tuberculosis | 1 | 131 | Risk Ratio (M‐H, Random, 95% CI) | 1.15 [0.65, 2.02] |
| Outcome or subgroup title | No. of studies | No. of participants | Statistical method | Effect size |
| 1 Mortality Show forest plot | 3 | 433 | Risk Ratio (M‐H, Random, 95% CI) | 1.24 [0.53, 2.86] |
| 1.1 People with HIV on ART | 1 | 231 | Risk Ratio (M‐H, Random, 95% CI) | 1.39 [0.58, 3.32] |
| 1.2 People with HIV not on ART and on treatment for active tuberculosis | 2 | 202 | Risk Ratio (M‐H, Random, 95% CI) | 1.62 [0.22, 11.89] |
| 2 Persistence of diarrhoea Show forest plot | 1 | 104 | Hazard Ratio (Random, 95% CI) | 0.91 [0.50, 1.66] |
| 2.1 People with HIV not on ART | 1 | 104 | Hazard Ratio (Random, 95% CI) | 0.91 [0.50, 1.66] |
| 3 Rate of diarrhoea Show forest plot | 1 | 231 | Odds Ratio (Random, 95% CI) | 0.40 [0.18, 0.87] |
| 3.1 People with HIV on ART | 1 | 231 | Odds Ratio (Random, 95% CI) | 0.40 [0.18, 0.87] |
| Outcome or subgroup title | No. of studies | No. of participants | Statistical method | Effect size |
| 1 Hospital admissions Show forest plot | 1 | 186 | Risk Ratio (M‐H, Random, 95% CI) | 0.40 [0.21, 0.75] |
| 1.1 People with HIV on ART | 1 | 186 | Risk Ratio (M‐H, Random, 95% CI) | 0.40 [0.21, 0.75] |