Prevención del estrés ocupacional en los trabajadores de la salud
Resumen
Antecedentes
Los trabajadores sanitarios pueden sufrir estrés ocupacional como resultado de la falta de habilidades, de factores organizativos, y del reducido apoyo social en el trabajo. Esto puede provocar angustia, agotamiento y problemas psicosomáticos, y el deterioro de la calidad de vida y de la prestación de servicios.
Objetivos
Evaluar la efectividad de las intervenciones dirigidas al trabajo y a las personas en comparación con ninguna intervención o intervenciones alternativas para la prevención del estrés laboral en los trabajadores de la salud.
Métodos de búsqueda
Se hicieron búsquedas en el Registro Cochrane Central de Ensayos Controlados (Cochrane Central Register of Controlled Trials) (CENTRAL), MEDLINE, EMBASE, PsycINFO, CINAHL, NIOSHTIC‐2 y en la Web of Science hasta noviembre 2013.
Criterios de selección
Ensayos controlados aleatorios (ECA) de intervenciones orientadas a prevenir el estrés psicológico en los trabajadores de la salud. Para las intervenciones organizativas, las series de tiempo interrumpido y los estudios controlados de antes y después (CBA) también fueron aptos.
Obtención y análisis de los datos
Dos autores de la revisión de forma independiente extrajeron los datos y evaluaron la calidad de los ensayos. Se utilizaron las diferencias de medias estandarizadas (DME) cuando los autores de los ensayos habían usado diferentes escalas para medir el estrés o el agotamiento. Se combinaron los estudios que eran similares en metanálisis. Se utilizó el sistema GRADE para evaluar la calidad de las pruebas.
Resultados principales
En esta actualización, se agregaron 39 estudios, lo cual dio lugar a un total de 58 estudios (54 ECA y cuatro estudios CBA), con 7188 participantes. Las intervenciones se categorizaron como entrenamiento cognitivo‐conductual (ECC) (n = 14), relajación mental y física (n = 21), una combinación de ECC y relajación (n = 6) e intervenciones organizativas (n = 20). El seguimiento fue de menos de un mes en 24 estudios, uno a seis en 22 estudios y más de seis meses en 12 estudios. Los resultados se categorizaron como estrés, ansiedad o salud general.
Hubo pruebas de baja calidad de que el ECC con o sin relajación no fue más efectivo para reducir los síntomas de estrés que ninguna intervención al mes de seguimiento en seis estudios (DME ‐0,27; intervalo de confianza [IC] del 95%: ‐0,66 a 0,13; 332 participantes). Sin embargo, del mes a los seis meses de seguimiento en siete estudios (DME ‐0,38; IC del 95%: ‐0,59 a ‐0,16; 549 participantes, reducción del riesgo relativo del 13%) y a más de seis meses de seguimiento en dos estudios (DME ‐1,04; IC del 95%: ‐1,37 a ‐0,70; 157 participantes) el ECC con o sin relajación redujo el estrés más que ninguna intervención.
Las intervenciones con ECC no dieron lugar a un efecto considerablemente mayor que una intervención alternativa, en tres estudios.
La relajación física (p.ej. masaje) fue más efectiva para reducir el estrés que ninguna intervención al mes de seguimiento en cuatro estudios (DME ‐0,48; IC del 95%: ‐0,89 a ‐0,08; 97 participantes) y del mes a los seis meses de seguimiento en seis estudios (DME ‐0,47; IC del 95%: ‐0,70 a ‐0,24; 316 participantes). Dos estudios no encontraron una diferencia considerable en el estrés entre el masaje y la posibilidad de tomar descansos adicionales.
La relajación mental (p.ej. meditación) dio lugar a niveles de los síntomas de estrés similares a ninguna intervención del mes a los seis meses de seguimiento en seis estudios (DME ‐0,50; IC del 95%: ‐1,15 a 0,15; 205 participantes) aunque dio lugar a menos estrés en un estudio en el momento del seguimiento a más de seis de meses. Un estudio reveló que la relajación mental redujo el estrés de forma más efectiva que la asistencia a un curso sobre el análisis de teorías y otro que fue más efectiva que la relajación en una silla solamente.
Las intervenciones organizativas constaron de modificaciones en las condiciones de trabajo, apoyo a la organización, cambio en la atención, aumento de las aptitudes de comunicación y modificación de los esquemas de trabajo. La modificación en los esquemas de trabajo (de continuos a la posibilidad de tener descansos el fin de semana y de un esquema de cuatro semanas a dos semanas) redujo el estrés, con una DME ‐0,55 (IC del 95%: ‐0,84 a ‐0,25; dos ensayos, 180 participantes). Otras intervenciones organizativas no fueron más efectivos que ninguna intervención o una intervención alternativa.
La calidad de las pruebas se calificó como baja para todas las comparaciones excepto una. Para el ECC lo anterior se debió a la posibilidad de sesgo de publicación, y para las otras comparaciones a una falta de precisión y a riesgo de sesgo. Sólo para la relajación versus ninguna intervención hubo pruebas de calidad moderada.
Conclusiones de los autores
Hay pruebas de baja calidad de que el ECC y la relajación mental y física reducen el estrés más que ninguna intervención, pero no más que las intervenciones alternativas. También hay pruebas de baja calidad de que la modificación en los esquemas de trabajo puede dar lugar a una reducción del estrés. Otras intervenciones organizativas no tienen efecto sobre los niveles de estrés. Se necesitan más ensayos controlados aleatorios con al menos 120 participantes que comparen la intervención con una intervención similar al placebo. Las intervenciones organizativas deben centrarse mejor en la reducción de estresantes específicos.
PICOs
Resumen en términos sencillos
Prevención del estrés ocupacional en los trabajadores de la salud
Antecedentes
Los trabajadores sanitarios sufren de estrés laboral u ocupacional. A menudo lo anterior se debe a que los trabajadores de la salud se enfrentan con expectativas altas y pueden no tener tiempo, aptitudes y apoyo social suficiente en el trabajo. Esto puede dar lugar a angustia grave, agotamiento o enfermedades físicas. Como consecuencia, los trabajadores de la salud pueden ser incapaces de prestar servicios de asistencia sanitaria de alta calidad. El estrés y el agotamiento también pueden ser costosos debido a que los trabajadores sanitarios afectados toman licencias por enfermedad e incluso pueden cambiar de trabajo.
Se evaluó el funcionamiento de las diferentes formas de prevención del estrés o el agotamiento de los trabajadores de la salud.
Características de los estudios
Se incluyeron 58 estudios que incluyeron a 7188 participantes en total. Cincuenta y cuatro de los estudios incluidos fueron estudios controlados aleatorios y cuatro fueron estudios no aleatorios. Las intervenciones se categorizaron como entrenamiento cognitivo‐conductual, relajación mental y física o modificación organizativa.
Hallazgos clave y calidad de las pruebas
Intervenciones cognitivoconductuales
Según seis estudios, hubo pruebas de baja calidad de que el entrenamiento cognitivo‐conductual redujo el estrés en alrededor del 13% en comparación con ninguna intervención, y cuando se midió en períodos de seguimiento que variaron de menos de un mes hasta dos años. No está claro cuán relevante es esta reducción para un paciente con estrés. Los resultados fueron similares al combinar el entrenamiento cognitivo‐conductual con relajación. Sin embargo, en tres estudios, los niveles de estrés fueron similares después de un ciclo de entrenamiento cognitivo‐conductual comparado con otro entrenamiento que no se centró en el tratamiento del estrés sino en el contenido de la atención.
Intervenciones de relajación mental y física
En 17 estudios hubo pruebas de calidad baja a moderada de que la relajación tanto mental como física dio lugar a una reducción del 23% en los niveles de estrés en comparación con ninguna intervención.
Intervenciones organizativas
Las intervenciones organizativas tuvieron como finalidad la modificación de las condiciones de trabajo en 20 estudios, la mejoría del apoyo o la tutoría en seis estudios, la modificación del contenido de la atención en cuatro estudios, la mejoría de las aptitudes de comunicación en un estudio y la mejoría de los esquemas de trabajo en dos estudios. Los esquemas de trabajo más cortos o interrumpidos redujeron los niveles de estrés en dos estudios aunque no hubo beneficios claros de ninguna de las otras intervenciones organizativas.
Conclusiones
Se estableció la conclusión de que el entrenamiento cognitivo‐conductual, así como la relajación mental y física, reducen el estrés de forma moderada. La modificación en los esquemas de trabajo también puede reducir el estrés, aunque otras intervenciones organizativas no tienen efectos claros. Se necesitan estudios aleatorios con al menos 120 participantes y preferentemente una intervención de componente único. Las intervenciones organizativas deben estar más centradas en hacer frente a los factores específicos que causan estrés.
Conclusiones de los autores
Summary of findings
| Cognitive‐behavioural intervention compared to no Intervention for reducing stress | ||||||
| Patient or population: Healthcare workers | ||||||
| Outcomes | Illustrative comparative risks* (95% CI) | Relative effect | No of Participants | Quality of the evidence | Comments | |
| Assumed risk | Corresponding risk | |||||
| No Intervention | Cognitive‐behavioural intervention | |||||
| Stress 1 Month | The median stress level across all control groups across all follow‐up times was 24.33 points on the Emotional Exhaustion subscale of the Maslach Burnout Inventory¹ | The mean stress level at 1 month in the intervention groups was 1.22 points lower (2.98 lower to 0.59 higher). | SMD ‐0.27 (‐0.66 to 0.13) | 332 | ⊕⊕⊝⊝ | This meta‐analysis was back transformed to the EE subscale of the MBI by using the median SD of the EE scale across control groups. |
| Stress 1 ‐ 6 months | The median stress level across all control groups across all follow‐up times was 24.33 points on the Emotional Exhaustion subscale of the Maslach Burnout Inventory¹ | The mean stress at 1 ‐ 6 months in the intervention groups was 1.83 points lower (0.77 to 2.85 lower). | SMD ‐0.38 (‐0.59 to ‐0.16) | 549 | ⊕⊕⊝⊝ low²,³ | This meta‐analysis was back transformed to the EE subscale of the MBI by using the median SD of the EE scale across control groups. |
| Stress > 6 months | The median stress level across all control groups across all follow‐up times was 24.33 points on the Emotional Exhaustion subscale of the Maslach Burnout Inventory¹ | The mean stress at more than 6 months in the intervention groups was 11.34 points lower (4.47 to 14.94 lower) | SMD ‐1.04 (‐1.37 to ‐0.70) | 157 | ⊕⊕⊝⊝ low²,³ | This meta‐analysis was back transformed to the EE subscale of the MBI by using the median SD of the EE scale across control groups. |
| *The basis for the assumed risk (e.g. the median control group risk across studies) is provided in footnotes. The corresponding risk (and its 95% confidence interval) is based on the assumed risk in the comparison group and the relative effect of the intervention (and its 95% CI). | ||||||
| GRADE Working Group grades of evidence | ||||||
| 1 This was the median from the control groups of all studies that measured the effect of CBT vs. no intervention on Emotional Exhaustion with the same scale. | ||||||
| Relaxation compared to no intervention (SMD) for | ||||||
| Patient or population: Healthcare workers | ||||||
| Outcomes | Illustrative comparative risks* (95% CI) | Relative effect | No of Participants | Quality of the evidence | Comments | |
| Assumed risk | Corresponding risk | |||||
| no intervention (SMD) | Relaxation | |||||
| Stress 1 month | The median stress level across all control groups across all follow‐up times was 22.17 points on the Emotional Exhaustion subscale of the Maslach Burnout Inventory¹ | The mean stress at 1 month in the intervention groups was 2.14 points lower (0.36 to 3.96 lower). | SMD ‐0.48 (‐0.89 to ‐0.08) | 97 | ⊕⊕⊝⊝ low | This meta‐analysis was back transformed to the EE subscale of the MBI by using the median SD of the EE scale across control groups. |
| Stress 1 ‐ 6 months | The median stress level across all control groups across all follow‐up times was 22.17 points on the Emotional Exhaustion subscale of the Maslach Burnout Inventory¹ | The mean stress at 1 ‐ 6 months in the intervention groups was 4.84 points lower (2.37 to 6.92 lower). | SMD ‐0.49 (‐0.78 to ‐0.21) | 521 | ⊕⊕⊕⊝ moderate | This meta‐analysis was back transformed to the EE subscale of the MBI by using the median SD of the EE scale across control groups. |
| Stress > 6 months | The median stress level across all control groups across all follow‐up times was 22.17 points on the Emotional Exhaustion subscale of the Maslach Burnout Inventory¹ | The mean stress at > 6 months in the intervention groups was 5.67 points lower (3.39 to 7.95 lower). | SMD ‐1.89 (‐2.65 to ‐1.13) | 40 | ⊕⊕⊝⊝ low | This result was back transformed to the EE subscale of the MBI by using the median SD of the EE scale across control groups. |
| *The basis for the assumed risk (e.g. the median control group risk across studies) is provided in footnotes. The corresponding risk (and its 95% confidence interval) is based on the assumed risk in the comparison group and the relative effect of the intervention (and its 95% CI). | ||||||
| GRADE Working Group grades of evidence | ||||||
| 1 This was the median from the control groups of all studies that measured the effect of relaxation vs. no intervention on Emotional Exhaustion with the same scale. | ||||||
Antecedentes
Los trabajadores de la salud pueden presentar estrés laboral u ocupacional como resultado de factores organizativos y de un desequilibrio en las exigencias, las habilidades y el apoyo social en el trabajo, o una combinación de estos. Bajo algunas condiciones, esto puede provocar angustia grave, agotamiento o enfermedades psicosomáticas, y el consiguiente deterioro de la calidad de vida y de la prestación de servicios (Weinberg 2000).
Descripción de la afección
El "síndrome de desgaste profesional" se definió como un estado mental negativo persistente relacionado con el trabajo, en personas "normales", caracterizado principalmente por cansancio excesivo acompañado de angustia, una sensación de reducción de la efectividad, disminución de la motivación y aparición de conductas y actitudes disfuncionales en el trabajo. Esta condición psicológica se desarrolla gradualmente, pero puede pasar inadvertida durante mucho tiempo para la persona implicada. Es el resultado de un desajuste entre las intenciones y la realidad en el trabajo. A menudo el síndrome de desgaste profesional se autoperpetúa debido a inadecuadas estrategias de afrontamiento asociadas con el síndrome(Schaufeli 2003). Se considera que el síndrome de desgaste profesional y el estrés ocupacional son resultado de la exposición a factores estresantes del trabajo; los efectos de dicha exposición están mediados por las estrategias de afrontamiento personales o la habilidad para controlar los factores estresantes ambientales a nivel personal(Cooper 2001; Schaufeli 2003). Esta revisión considera el síndrome de desgaste profesional como un tipo específico de estrés psicológico y no como un diagnóstico clínico (Firth‐Cozens 1999). La repercusión económica de dichas condiciones es alta, como se puede deducir de los datos sobre el ausentismo y la renovación del personal(Jacobson 1996; Raiger 2005). Más del 10% de las reclamaciones con respecto a enfermedades ocupacionales se atribuye al estrés laboral (Williamson 1994). Existen diversos factores de estrés en el ámbito laboral de los trabajadores de la salud que se ha demostrado que aumentan el riesgo de desarrollar angustia y síndrome de desgaste profesional, como el aumento de la carga de trabajo, la respuesta emocional al contacto con pacientes que sufren o que están muriendo, y problemas y conflictos organizativos (Payne 1987; McNeely 2005). Además, muchos estudios mostraron que los niveles de insatisfacción, angustia y síndrome de desgaste profesional en el lugar de trabajo de los trabajadores de la salud son muy altos(Deckard 1994; Karasek 1992; Maslach 1982; Raiger 2005; Ramirez 1996).
Descripción de la intervención
El estrés y el síndrome de desgaste profesional relacionados con el trabajo se pueden analizar con uno o más de los siguientes enfoques: técnicas didácticas cognitivo‐conductuales, participar en la relajación mental o física o mediante el cambio de la organización del trabajo.
De qué manera podría funcionar la intervención
Las técnicas cognitivo‐conductuales funcionan al proporcionar nuevas formas de sentir, pensar y actuar en las situaciones estresantes. Las técnicas de relajación mental y física desvían la atención lejos de los pensamientos y sentimientos estresantes desagradables y refuerzan la adaptabilidad. Las intervenciones organizativas pueden impedir que ocurran eventos estresantes y que aparezca una sensación de estrés o síndrome de desgaste profesional mediante el ajuste de las prácticas laborales para que coincidan y se utilicen mejor las capacidades de los trabajadores.
Por qué es importante realizar esta revisión
Se ha publicado un gran número de revisiones acerca de la efectividad de las intervenciones para prevenir o tratar el estrés(DeFrank 1987; Lamontagne 2007; Murphy 1995; Van der Hek 1997; Van der Klink 2001). Sin embargo, aparte de Jones 2000b y Mimura 2003,no hay otras revisiones que se centren específicamente en las intervenciones dirigidas a la prevención del estrés en los trabajadores sanitarios. Según la Fifth European Working Conditions Survey (Eurofound 2012), el sector de la salud tiene las tasas más altas en dos causas potenciales importantes de estrés laboral ocultar las propias emociones y una conducta social adversa, con una "salud mental de riesgo" a un nivel intermedio en comparación con otros sectores. En el Reino Unido, el sector de la salud tiene la tasa más alta de prevalencia calculada de estrés relacionado con el trabajo (HSE 2013).
Debido a que las características de las intervenciones diseñadas para los trabajadores de la salud pueden diferir de las de otras ocupaciones, el objetivo de esta revisión es determinar la efectividad de las intervenciones para reducir el estrés específicamente en los trabajadores de la salud. Ésta es una versión totalmente actualizada de la revisión que se publicó por primera vez en 2006.
Objetivos
Evaluar la efectividad de las intervenciones dirigidas al trabajo y a las personas en comparación con ninguna intervención o intervenciones alternativas para la prevención del estrés laboral en los trabajadores de la salud.
Métodos
Criterios de inclusión de estudios para esta revisión
Tipos de estudios
Para las intervenciones dirigidas a las personas o al punto de contacto persona / trabajo como las intervenciones de relajación o cognitivo‐conductuales, se consideraron solamente los ensayos controlados aleatorios.
En las intervenciones dirigidas al trabajo, como los cambios organizativos (ver "Tipos de intervenciones"), por lo general es imposible asignar al azar a los participantes de los estudios porque las intervenciones habitualmente se realizan a nivel de ámbito o de grupo. Este impedimento se puede superar con un diseño aleatorio grupal, donde los lugares o departamentos de trabajo se asignan al azar a los grupos de intervención o control. Sin embargo, como este es un diseño difícil y bastante nuevo, también se consideraron para inclusión diseños de estudio adicionales que permiten realizar intervenciones ambientales a nivel de grupo: estudios controlados tipo antes y después (before‐and‐after studies) (también conocidos como estudios de cohortes prospectivos o estudios cuasiexperimentales) y series de tiempo interrumpido. El grupo de revisión Cochrane para una Práctica y Organización Sanitaria Efectivas (Cochrane Effective Practice and Organisation of Care review group) definió al diseño de series de tiempo como una serie de al menos tres mediciones de resultados antes y al menos tres después de la implementación de una intervención (EPOC 2013).
Tipos de participantes
Se incluyeron estudios en los que las intervenciones se dirigieron a los trabajadores que no habían buscado activamente ayuda para afecciones como síndrome de desgaste profesional, depresión o trastorno por ansiedad. Dichos estudios incluyeron intervenciones dirigidas a los trabajadores de la salud oficialmente empleados en cualquier ámbito de asistencia sanitaria, o a estudiantes de enfermería o de medicina que se entrenan en la profesión y que también realizan trabajo clínico. Se excluyeron los estudios en los que los participantes eran solamente cuidadores y donde no estaban empleados por una organización de asistencia sanitaria.
Tipos de intervenciones
Se incluyeron los estudios con cualquier tipo de intervención con el objetivo de prevenir o reducir el estrés que produce el trabajo. Se definió la "prevención" como toda intervención dirigida a individuos sanos sin diagnóstico de una enfermedad específica.
Se clasificaron las intervenciones en tres grupos:
1. Intervenciones cognitivo‐conductuales que intentan cambiar la forma en la que los participantes piensan, sienten y, en consecuencia, se comportan en situaciones estresantes.
2. Intervenciones de relajación que intentan inducir un estado de calma mental o física, o ambas, para contrarrestar la agitación causada por el estrés. Lo anterior se puede lograr, por ejemplo, como receptor pasivo de un masaje o al realizar activamente diversos ejercicios. Por lo tanto, el objetivo se dirige a una actividad de relajamiento específica y alejada de pensamientos y sentimientos desagradables asociados con estrés.
3. Intervenciones organizativas que son medidas para modificar los recursos, el ambiente de trabajo, las tareas de trabajo o los métodos de trabajo. La intención es prevenir o reducir el estrés al asegurar que los trabajadores estén mejor equipados para realizar las tareas asociadas con sus trabajos.
Algunos autores también distinguen las intervenciones multimodales que consisten en intervenciones cognitivo‐conductuales combinadas con, por ejemplo, relajación. Se considera más informativo describir dichos estudios como una combinación de intervenciones cognitivo‐conductuales con relajación.
Para todos los tipos de intervenciones se incluyeron estudios con controles sin intervención y con una o más intervenciones alternativas como grupo control.
En la versión anterior de esta revisión (Marine 2006) se categorizaron las intervenciones en dirigidas a las personas y dirigidas al trabajo. Se considera que la nueva clasificación es más informativa.
Tipos de medida de resultado
Resultados primarios
Como resultados primarios, se consideraron todos los cuestionarios autovalidados que midieron el estrés o el agotamiento. Los mismos incluyeron las siguientes medidas: Maslach Burnout Inventory (MBI) Medidas de resultado principalesla Nursing Stress Scale (Gray‐Toft 1981)y el Karasek's Job Content Questionnaire (Karasek 1998).
Resultados secundarios
Como resultados secundarios, se consideraron todas las medidas de resultado de los efectos perjudiciales del estrés o del síndrome de desgaste profesional. Los mismos incluyeron las siguientes medidas:
(a) Síntomas psicológicos: ansiedad y depresión, como el State Trait Anxiety Inventory (Spielberger 1970), el General Health Questionnaire (Cuestionario de Salud General)(Goldberg 1991),el Beck Depression Inventory (Inventario de Depresión de Beck) (Beck 1961);
(b) Síntomas físicos y parámetros fisiológicos: por ejemplo, los niveles de hormonas como prolactina, corticosteroides u otras;
(c) Medidas de costo eficacia de las intervenciones, como los cocientes graduales de costo‐eficacia, los cocientes graduales de costo‐años de vida ajustados a la calidad y costo‐beneficio.
Se consideraron los efectos sobre las siguientes escalas de tiempo:
(i) Hasta un mes
(ii) De un mes a seis meses
(iii) Más de seis meses
Se consideró que todos los otros resultados que no midieron el estrés o sus efectos sobre los individuos estaban más allá del alcance de esta revisión y, por lo tanto, se excluyeron de los análisis. Ejemplos de los resultados excluidos son: aptitudes de afrontamiento, cambio en el conocimiento o la actitud, desempeño en el trabajo, satisfacción de los pacientes y reclamos de los clientes, ausentismo de los empleados y renovación del personal.
Results
Description of studies
Results of the search
From the initial set of references found with the original systematic searches conducted in 2005, we identified a set of 51 potentially eligible studies (Figure 1). We scrutinised these further, and excluded 31 studies, leaving a total of 20 studies. However, we noticed that two studies actually reported separate sets of results of a single study so we included them as one study and henceforth refer to it as Lökk 2000. Thus, the original sample consisted of 19 studies. The first updated systematic searches conducted in 2008 yielded a set of 8623 references, after excluding duplicates, of which 5334 covered the period of the original search. Screening these references for eligibility resulted in 17 of the 19 studies already included in the original sample and an additional 30 potentially eligible studies for the period covered by the original search. This showed that the original search had not been sensitive enough. The first updated search in 2008 yielded another 34 potential studies that had been published since 2005. Other sources resulted in another six potential studies. We scrutinised the full‐text articles of these 70 new potentially eligible studies with regard to our inclusion and exclusion criteria. Altogether we excluded 56 studies, leaving a total of 14 new studies. However, one of these new studies (Rowe 2006) actually reported new follow‐up data for an earlier study (Rowe 1999). Because the more recent article reported the results of all measurements starting from baseline, we used these data and thus included the study only once. The systematic searches have since been updated three times, in November 2010, May 2012 and November 2013. These yielded altogether 9646 references, excluding duplicates. We assessed 100 full text articles for eligibility and excluded 76. This left 24 new studies. Put together, via four rounds of systematic searches conducted in 2008, 2010, 2012 and 2013, we have identified altogether 58 studies that fulfilled our inclusion criteria and 212 that did not and that we summarily excluded. In addition, we located three ongoing studies (Gomez‐Gascon 2013; Niks 2013; Spoor 2010) for which we could not find published outcome data.

Study flow diagram.
We sought additional information regarding study details and statistical data or both from 18 authors and we received it from 12. Eight of the authors provided data that had not been published in their articles which enabled us to enter two of these studies into the meta‐analyses.
Included studies
Study designs
Of the 58 included studies, 42 were randomised controlled trials, eight were cluster‐randomised trials, four were cross‐over studies and four were controlled before‐and‐after studies of a work‐directed intervention.
Six of the eight included cluster‐randomised trials had a unit of analysis error. In other words, these studies ignored the clustering of the data in their analysis. Hence we had to adjust the data accordingly. See Unit of analysis issues for the formula we used to calculate the design effect based on average cluster size (M) and an intra‐cluster correlation coefficient. We calculated the design effect as 2.01 for the Jensen 2006 study (19 clusters, M = 11.05); 2.2 for the Lökk 2000 study (2 clusters, M = 13); 2.73 for the Schrijnemaekers 2003 study (16 clusters, M = 18.3); 1.72 for the Proctor 1998 study (12 clusters, M = 8.2), 2.7 for Uchiyama 2013 (24 clusters, M = 18.08) and 1.42 for Ketelaar 2013 (58 clusters, M = 5.17). We used the design effect to reduce the number of participants in both intervention and control groups if we were able to use quantitative outcome data in meta‐analyses.
For the four cross‐over studies we wanted to use data from the first period only for Bittman 2003 and Lai 2011, but the studies did not provide these and thus could not contribute to the analysis. Von Baeyer 1983 reported the results of the first period separately and we included these. Lucas 2012 studied the immediate effect of different working schedules and used a washout period of four weeks between the intervention and the control period, which seemed reasonable. For this study we included the post‐intervention results of all participants.
We were aiming also to include studies with interrupted time‐series designs but the final sample contained none of these.
Country and time period
Twelve of the included studies had been conducted before the year 2000, 22 between the years 2000 and 2010, and 24 in 2010 or later. Nineteen studies had been carried out in Europe, another 24 in North America, eight in Asia, three in the Middle East, two in South America and two in Australia.
Type of settings and participants
Altogether 39 of the included studies had been conducted in hospitals, eight in residential care homes for the elderly or the disabled, seven in mixed healthcare settings, three in a secure unit and one in a nursing school. Thirty‐five studies included exclusively nurses (including all institutions), 15 included all healthcare staff, but usually the majority of the staff were nurses and only a small fraction (about 5%) were physicians, six studies exclusively included physicians and two included either physiotherapists or respiratory therapists.
Sample sizes
The total number of participants was 7188, with 3592 in various intervention groups and 3596 in control groups. The number of participants was less than 20 in five studies, more than 20 but less than 60 in 27 studies, more than 60 but less than 300 in 20 studies, and more than 300 in six studies.
Interventions
Thirteen study‐arms (Delvaux 2004; Gardner CBT 2005; Gardner Coping 2005; Ketelaar 2013; Gärtner 2013; Günüsen 2010; Jensen 2006; Kwok 2012; Lee 1994; Lökk 2000; Martins 2011; Rowe 2006; Yamagishi 2008) examined cognitive‐behavioural interventions.
Six studies (Jones 2000a; Norvell 1987; Reynolds 1993; Sood 2011; Von Baeyer 1983; West 1984) assessed a combination of cognitive‐behavioural elements and relaxation.
Twenty‐two study‐arms examined relaxation interventions. We categorised relaxation interventions as: physical: Bittman 2003; Brennan 2006; Griffith 2008; Hansen 2006; Kurebayashi 2012; Lai 2011; Lemaire 2011; McElligott 2003; Palumbo 2012; Saganha 2012; Tsai 1993; Yazdani 2010; Yung 2004; and mental relaxation: Cohen‐Katz 2005; Klatt 2012; Mackenzie 2006; Moody 2013; Oman 2006; Shapiro 2005; Stanton 1988.
Twenty‐one study‐arms examined the effectiveness of organisational interventions. Of these, six tried to improve working conditions with or without the participation of workers (Bourbonnais 2011; Le Blanc 2007; Melchior 1996; Proctor 1998; Romig 2012; Uchiyama 2013). Another seven organised some kind of support, for example peer support groups, to discuss problems at work that increase stress (Carson 1999; Günüsen 2010; Heaney 1995; Leiter 2011; Li 2011; Peterson 2008; Salles 2013). Four studies evaluated the introduction of special care models such as emotion‐oriented care training (Finnema 2005; Razavi 1993; Redhead 2011; Schrijnemaekers 2003). Two studies evaluated the effect of different work schedules on stress (Ali 2011; Lucas 2012), one assessed the effect of improving nurses' knowledge about serious mental illness on stress (Ewers 2002) and another evaluated the effect of communication skills training on stress (Ghazavi 2010).
Type of control group (no intervention versus other active or 'passive' interventions)
Almost all (45) of the included studies used a no‐intervention or waiting‐list control group.
Eleven studies compared an active intervention to a 'passive' intervention aiming to control for the Hawthorne effect, etc. (Brennan 2006; Carson 1999; Finnema 2005; Jensen 2006; Lai 2011; Lee 1994; Lökk 2000; Moyle 2013; McElligott 2003; Salles 2013; Tsai 1993).
Two studies (Ali 2011; Lucas 2012) compared only active interventions, that is, different work schedules with one another.
Multiple Intervention Arms
Seven studies (Gardner CBT 2005; Gärtner 2013; Günüsen 2010; Kurebayashi 2012; Rowe 2006; West 1984; Yung 2004) compared one or more active stress management interventions. Gardner CBT 2005 included an arm with CBT content and an arm aimed at improving coping with stress with relaxation and other individual self‐management interventions (time management, assertion, problem‐solving, etc.). We used both arms in different subgroups. Ketelaar 2013 and Gärtner 2013 evaluated two interventions with a similar content but with different modes of providing the intervention. We therefore combined those in the same comparison and again halved the numbers in the control group. Günüsen 2010 provided a coping and work support intervention and these were entered in separate comparisons. With Kurebayashi 2012, we entered both interventions in the same comparison of physical relaxation. West 1984 had five study arms but finally reported data only on one study arm versus a no‐intervention or no‐effect condition. We used this as an intervention versus no‐intervention comparison.
Outcomes
Altogether 21 studies used the Maslach Burnout Inventory (MBI) or one of its subscales as their main outcome measure. However, the MBI was only reported as a sum score in Shapiro 2005, and we used the Perceived Stress Scale (PSS) for that study instead of the MBI. Six studies used the Perceived Stress Scale (Brennan 2006; Griffith 2008; Lee 1994; Li 2011; Palumbo 2012; Sood 2011). Four studies used their own definition of burnout (Ali 2011; Bourbonnais 2011; Romig 2012; Salles 2013). Two studies used the Nurse Stress Scale (Delvaux 2004; Razavi 1993). Two studies used the General Health Questionnaire (GHQ) (Reynolds 1993; Yung 2004) and another two used the Profile of Moods States (POMS) (Bittman 2003; Moyle 2013). Two studies used their own developed stress scale (Ghazavi 2010; Lemaire 2011). The other outcome measures were each used by one study only: 4‐dimension complaint checklist (Ketelaar 2013), Brief Job Stress Questionaire (Yamagishi 2008), Depression Anxiety Stress Scale (Yazdani 2010), Derogatis Stress Profile (Jones 2000a), Effort Reward Imbalance Questionnaire (Uchiyama 2013), Job Stress Questionnaire (Hansen 2006), The Mental Health Professional Stress Scale (Gardner CBT 2005), Nurse Stress Checklist (see Benoliel 1990) (Tsai 1993), Occupational Stress Indicator (see Cooper 1988) (Proctor 1998), Organisation and Stress Scale (Finnema 2005), The General Nordic Questionnaire for Psychological and Social Factors at Work (QPS Nordic) (Peterson 2008), Symptom Checklist‐90 (see Derogatis 1976; Derogatis 1983) (Heaney 1995), Somatic Stress (Kwok 2012), Stress Profile (Stanton 1988), Stress Symptom Checklist (Kurebayashi 2012), Structured Stress Questionnaire (Lökk 2000), and Stress Visual Analogue Scale (Lai 2011). Two studies measured only anxiety (McElligott 2003; Von Baeyer 1983).
Altogether 22 studies used more than one of the stress measures listed above.
None of the studies measured the cost effectiveness of interventions.
Follow‐up
(i)Short‐Term:
There were 24 studies in which the last outcome measurement was either at the end of the intervention (Ewers 2002; Finnema 2005; Ghazavi 2010; Griffith 2008; Hansen 2006; Kurebayashi 2012; Lai 2011; Lemaire 2011; Li 2011; Lucas 2012; Mackenzie 2006; Martins 2011; McElligott 2003; Moyle 2013; Norvell 1987; Palumbo 2012; Proctor 1998; Saganha 2012; Shapiro 2005; Sood 2011; Von Baeyer 1983; Yamagishi 2008) or at less than a month after intervention (Brennan 2006; Tsai 1993).
(ii) Medium‐Term :
In another 22 studies the last follow‐up measurement was between one and six months after intervention (Bittman 2003; Carson 1999; Cohen‐Katz 2005; Delvaux 2004; Gardner CBT 2005; Günüsen 2010; Heaney 1995; Klatt 2012; Kwok 2012; Le Blanc 2007; Lee 1994; Leiter 2011; Lökk 2000; Moody 2013; Oman 2006; Razavi 1993; Reynolds 1993; Romig 2012; Salles 2013; West 1984; Yazdani 2010; Yung 2004).
(iii) Long Term :
There were also 12 studies in which the last follow‐up measurement was at six months after intervention or later (Ali 2011; Bourbonnais 2011; Jensen 2006; Jones 2000a; Ketelaar 2013; Melchior 1996; Peterson 2008; Redhead 2011; Rowe 2006; Schrijnemaekers 2003; Stanton 1988; Uchiyama 2013).
Excluded studies
Excluded studies
The main reasons for excluding studies from this review were the following, as illustrated by selected examples of each category (see Characteristics of excluded studies):
-
No control group: Andersen 2010; Cohen 2005; Elo 2000; Michie 1992; Petterson 2006; Schaufeli 1995; Yamagishi 2007.
-
Non‐randomised study design and intervention directed at persons or the person/work interface: Bourbonnais 2006a; Holt 2006; Michie 1994; Petterson 1998; Young 2001; Zimber 2001.
-
No intervention aimed at preventing or treating stress or burnout: Bourbonnais 2006b; Brinkborg 2011; Cámara Conde 2009; Ridge 2011; Wetzel 2011.
-
The intervention is primarily aimed at people with dementia at a care home and not the staff caring for them, although the effects were measured also for the latter: Baldelli 2004.
-
No primary outcome measure of stress or burnout: Bay 2010; Lai 2012; Pipe 2009; Saadat 2012; Sharif 2013; Villani 2012.
-
Participants were not healthcare workers or nursing students with clinical duties: Drain 1991.
-
Participants were nursing students but did not have clinical duties: Johansson 1991; Russler 1991; Sharif 2004.
-
Participants were victims of assault and deemed not healthy as per inclusion criteria: Nhiwatiwa 2003.
-
Participants had been diagnosed with burnout syndrome: Diaz‐Rodriguez 2011a; Diaz‐Rodriguez 2011b.
Risk of bias in included studies
In general, most studies were of low methodological quality, with at least several items that we judged to put them at a high risk of bias (Figure 2). We judged only one study (Günüsen 2010) to be at low risk of bias in randomisation, allocation concealment, incomplete data, selective reporting or other risks of bias. Blinding was consistently problematic in all studies because self report was used to assess stress levels as the outcome and the providers could not be blinded to the intervention. We therefore did not use this item to make a distinction between studies at high or low risk of bias.
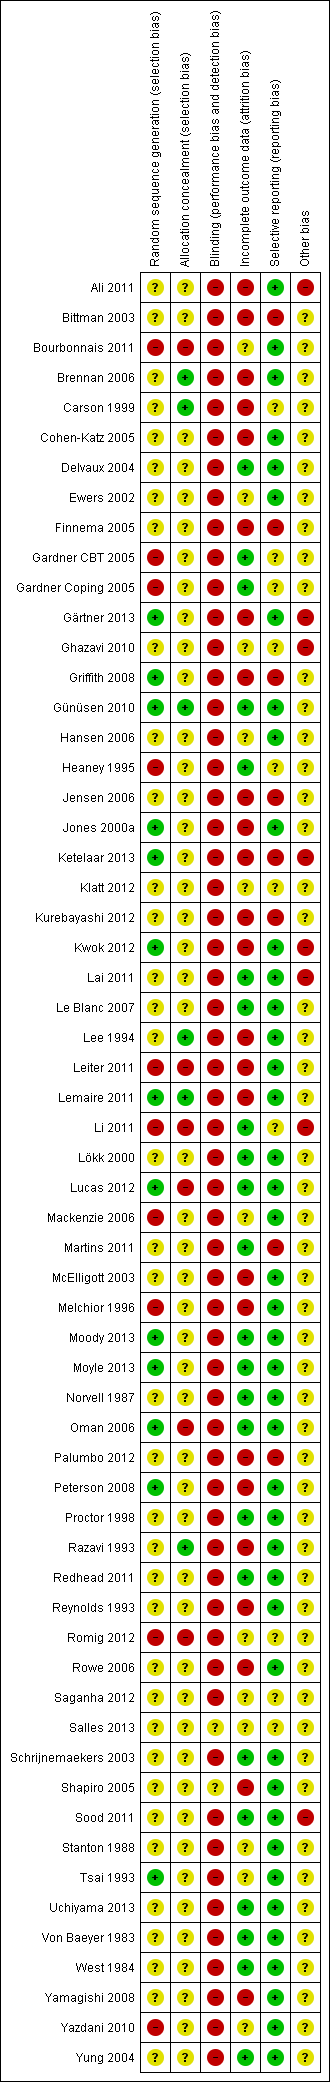
Risk of bias summary: review authors' judgements about each risk of bias item for each included study.
Allocation
Only 12 out of the 58 studies clearly described the method for generating random numbers, with the newer studies being better in this regard than the older studies. It is still surprising to note that most studies just describe the whole process as "We randomised participants". The large number of studies that did not report details prevented us from asking all authors to provide better information. Details of allocation concealment were lacking even more often, with only six studies giving an adequate description. Even though many other risks of bias are difficult to avoid in stress management studies, these items can clearly be improved for any study. The fact that a minority of studies reported sufficient detail and content to justify an assessment of low risk of bias means that it is feasible for all.
Blinding
We considered the reporting of stress by questionnaires as an outcome assessment that could be biased by knowledge of the intervention. We judged that it could be possible that a participant in the intervention group, knowing that they have gone through a six‐week course of stress management, would rate their stress symptoms more favourably than a person in the control group. This would create an overestimation of the effect of the intervention. Very few authors mentioned that blinding could be an issue, but said also that they thought that blinding is impossible here. We agree that this is not possible but that does not eliminate the risk of bias and we therefore rated all studies with self reports as being at high risk of bias.
Incomplete outcome data
The loss of participants was mostly low. However, 12 studies (Brennan 2006; Carson 1999; Finnema 2005; Ketelaar 2013; Gärtner 2013; Griffith 2008; Jensen 2006; McElligott 2003; Melchior 1996; Palumbo 2012; Peterson 2008; Tsai 1993) suffered a loss exceeding 20% of the initial sample. These were labelled as being at high risk of bias. Also one study (Bittman 2003) reported the reasons for participants not completing the study but not separately for the two groups. As the reasons listed were not entirely random (e.g. poor attendance and refusal to participate) we judged this study to be at high risk of attrition bias. In six studies (Jones 2000a; Lee 1994; Razavi 1993; Reynolds 1993; Rowe 2006; Shapiro 2005) results were analysed only for participants who provided complete data sets. We labelled these studies as being at high risk of bias. In two studies (Mackenzie 2006; Stanton 1988) it was unclear whether any participants dropped out and the studies were therefore labelled as being at unclear risk of bias.
Selective reporting
In the absence of a protocol, it is difficult to judge if outcomes are reported as planned. If the authors mentioned a protocol, we checked the protocol. If there was no mention of a protocol we judged if the methods and results sections reported the same outcomes. In most (41) of the studies all outcomes were reported as planned and consequently we judged them as being at low risk of bias. In one study (Carson 1999) two of the outcomes (Minnesota Job Satisfaction scale and the Cooper Coping Skills scale) were administered but their results were not reported. We judged this to be a sign of a high risk of bias. In two studies (Gardner CBT 2005; Jensen 2006) only significant differences were reported, which we also took to be a sign of a high risk of bias. In Finnema 2005 the results for nursing assistants consisted of covariance analyses that were not prespecified and because of this we judged the study to be at high risk of bias. In Rowe 2006 authors report only the results of the Maslach Burnout Inventory (MBI) at each follow‐up point, but when we made contact the author explained that this was the plan all along. We therefore assessed the study as being at low risk of bias.
Other potential sources of bias
There were several risks of bias that came up in addition to the risks mentioned above, such as an unclear washout period in a cross‐over trial (Lai 2011), very low compliance with the intervention (Ketelaar 2013) or a loosely validated outcome measure (Ghazavi 2010). If we found nothing else then we left the other potential source of bias as unclear in the 'Risk of bias' tool.
Effects of interventions
See: Summary of findings for the main comparison Cognitive‐behavioural intervention compared to no Intervention for reducing stress; Summary of findings 2 Relaxation compared to no intervention (SMD) for reducing stress
Cognitive‐behavioural interventions
1. Cognitive‐behavioural intervention vs. no intervention
1.1. Any stress‐related outcome (Follow‐up to one month)
1.1.1 Cognitive‐behavioural intervention only vs. no intervention
We could combine the results of four studies (Gardner CBT 2005; Martins 2011; Rowe 2006; Yamagishi 2008) (Analysis 1.1; 248 participants ). There was a standardised mean difference (SMD) of ‐0.25 (95% confidence interval (CI) ‐0.60 to 0.11) showing no difference in stress between the cognitive‐behavioural training (CBT) intervention and no intervention at up to one month follow‐up. The meta‐analysis of this subgroup did not have considerable heterogeneity (I² = 43%).
1.1.2 Cognitive‐behavioural intervention and relaxation vs. no intervention
According to three studies (Gardner Coping 2005; Norvell 1987; Sood 2011) stress levels were similar for the combined cognitive‐behavioural plus relaxation intervention when compared with no intervention at up to one month follow‐up (SMD ‐0.45; 95% CI ‐1.61 to 0.70; Analysis 1.1; 84 participants).
When the above seven studies are combined, stress levels are similar following cognitive‐behavioural intervention with or without relaxation and no intervention (SMD ‐0.27; 95% CI ‐0.66 to 0.13) at up to one month follow‐up (Analysis 1.1). Because of the sizeable heterogeneity (I² = 81%) caused by Gardner Coping 2005, we employed the random effects model in this meta‐analysis.
The funnel plot revealed a lack of studies in the right lower quadrant of the funnel where the small negative studies would be expected, indicating that there could be publication bias (Figure 3). The meta‐analysis combining both subgroups also suffered from considerable heterogeneity (I² = 63%) that was entirely due to Gardner Coping 2005.

Funnel plot of comparison: 1 Cognitive‐behavioural intervention vs no Intervention (SMD), outcome: 1.1 Any Stress‐related Outcome (follow‐up up to 1 month).
1.2 Any stress‐related outcome (Follow‐up from one to six months)
1.2.1 Cognitive‐behavioural intervention only vs. no intervention
According to six studies (Delvaux 2004; Ketelaar 2013; Gärtner 2013; Günüsen 2010; Kwok 2012; Rowe 2006), a cognitive‐behavioural intervention decreased stress more than no intervention (SMD ‐0.28; 95% CI ‐0.47 to ‐0.09; 439 participants) at one to six months follow‐up (Analysis 1.2).
1.2.2 Cognitive‐behavioural intervention and relaxation vs. no intervention
Another two studies (Reynolds 1993; West 1984) showed that cognitive‐behavioural intervention combined with relaxation decreased stress more than no intervention (SMD ‐0.78; 95% CI ‐1.38 to ‐0.18; 110 participants) at one to six months follow‐up (Analysis 1.2).
When the above eight studies are combined, cognitive‐behavioural intervention with or without relaxation reduces stress when compared to no intervention (SMD ‐0.38; 95% CI ‐0.59 to ‐0.16) at one to six months follow‐up (Analysis 1.2).
Also here the funnel plot indicated the potential presence of publication bias (Figure 4). There was some heterogeneity (I² = 33%) that could be explained by the greater effect in studies that combined CBT with relaxation.

Funnel plot of comparison: 1 Cognitive‐behavioural intervention vs no Intervention (SMD), outcome: 1.2 Any Stress‐related Outcome (follow‐up 1 ‐ 6 months).
1.3 Any stress‐related outcome (Follow‐up more than six months)
1.3.1 Cognitive‐behavioural intervention with or without relaxation vs. no intervention
One study (Rowe 2006) showed that a cognitive‐behavioural intervention decreased stress more than no intervention (SMD ‐1.18; 95% CI ‐1.64 to ‐0.71; 84 participants) at more than six months follow‐up (Analysis 1.3). The intervention consisted of refresher courses at regular intervals and the effect was measured at two‐year follow‐up.
The results of another study (Jones 2000a) favoured a cognitive‐behavioural intervention combined with relaxation in reducing stress when compared to no intervention (SMD ‐0.89; 95% CI ‐1.37 to ‐0.41; 73 participants) at more than six months follow‐up (Analysis 1.3).
When the above two studies are combined, cognitive‐behavioural intervention with or without relaxation appears to reduce stress when compared to no intervention (SMD ‐1.04; 95% CI ‐1.37 to ‐0.70) at more than six months follow‐up (Analysis 1.3). Given the lack of heterogeneity in results (I² = 0%), we employed the fixed‐effect model in this meta‐analysis.
1.4 Anxiety (Follow‐up to one month)
Both state and trait anxiety decreased in the CBT plus relaxation intervention studies (Jones 2000a; Von Baeyer 1983; West 1984; 135 participants) more than after no intervention: mean difference (MD) ‐11.07; 95% CI ‐18.39 to ‐3.75 and MD ‐8.36; 95% CI ‐10.02 to ‐6.70 at one month follow‐up (Analysis 1.4).
1.5 Anxiety (Follow‐up one to six months)
Also at six months follow‐up there was a similar difference for both state and trait anxiety between CBT plus relaxation (Jones 2000a; 73 participants) and no intervention in one study: MD ‐8.05; 95% CI ‐12.10 to ‐4.00; and MD ‐6.00; 95% CI ‐10.30 to ‐1.70 at one to six months follow‐up (Analysis 1.5).
1.6 General Health Questionnaire (FU up to one month)
There was no effect in one study of CBT plus relaxation on the General Health Questionnaire score compared to no intervention (Gardner CBT 2005) (MD 0.29; 95% CI ‐1.96 to 2.54; 27 participants) (Analysis 1.6).
2. Cognitive‐behavioural intervention vs. non‐stress‐management intervention
2.1 Any stress scale (Follow‐up from one to six months)
Two studies (Lee 1994; Lökk 2000) measured the effects of a cognitive‐behavioural intervention on decreasing stress when compared to an alternative intervention (computer training or passive attendance of psychologist at staff meetings) by using different stress measures with one to six months follow‐up. The stress levels after the intervention and the control condition were similar (SMD ‐0.54 95% CI ‐1.16 to 0.08; 83 participants) (Analysis 2.1). Given the differences in interventions and outcome measures, we employed the random effects model in this meta‐analysis.
2.2 Any stress scale (Follow‐up more than six months)
One study (Jensen 2006) did not find a considerable effect of a cognitive‐behavioural intervention compared to an alternative intervention (lessons of the participant's own choice on e.g. skin care, proper treatment of a person with diabetes, work and asthma, and safety procedures in chemicals handling) on decreasing stress at more than six months follow‐up (SMD 0.03; 95% CI ‐0.53 to ‐0.59; 49 participants) (Analysis 2.2).
2.3 Anxiety (Follow‐up one to six months)
One study measured anxiety but did not find a considerable effect on anxiety of CBT compared to an alternative intervention (MD ‐0.12; 95% CI ‐1.94 to 1.70; 26 participants) (Analysis 2.3).
Relaxation interventions
3. Relaxation vs. no intervention
3.1 Any stress outcome (Follow‐up to one month)
3.1.1 Physical relaxation vs. no intervention
Four studies (Hansen 2006; Lemaire 2011; Palumbo 2012; Saganha 2012) compared physical relaxation with no intervention at decreasing stress at up to a month follow‐up. The pooled SMD (‐0.48; 95% CI ‐0.89 to ‐0.08; 97 participants) favoured physical relaxation and there was no heterogeneity (Analysis 3.1).
3.2 Any stress outcome (Follow‐up from one to six months)
3.2.1 Mental relaxation vs. no intervention
Six studies (Cohen‐Katz 2005; Mackenzie 2006; Moody 2013; Oman 2006; Shapiro 2005; Stanton 1988) found that mental relaxation was not more effective than no intervention at decreasing stress (SMD ‐0.50; 95% CI ‐1.15 to 0.15; 205 participants) at one to six months follow‐up (Analysis 3.2).
3.2.2 Physical relaxation vs. no intervention
Six studies (7 comparisons) (Bittman 2003; Griffith 2008; Hansen 2006; Kurebayashi 2012 (two arms); Palumbo 2012; Yazdani 2010) found that physical relaxation was more effective than no intervention at decreasing stress (SMD ‐0.47; 95% CI ‐0.70 to ‐0.24; 316 participants) at one to six months follow‐up (Analysis 3.2)
Pooling the results of both mental and physical relaxation gives a SMD of ‐0.49 (95% CI ‐0.78 to ‐0.21) but with substantial heterogeneity (I² = 57%), which is mostly due to the oldest study (Stanton 1988). If we remove this outlier study from the meta‐analysis, the magnitude of effect reduces to SMD ‐0.38 ; 95% CI ‐0.59 to ‐0.17) whilst bringing I² value down to 18%. The funnel plot does not indicate publication bias (Figure 5)
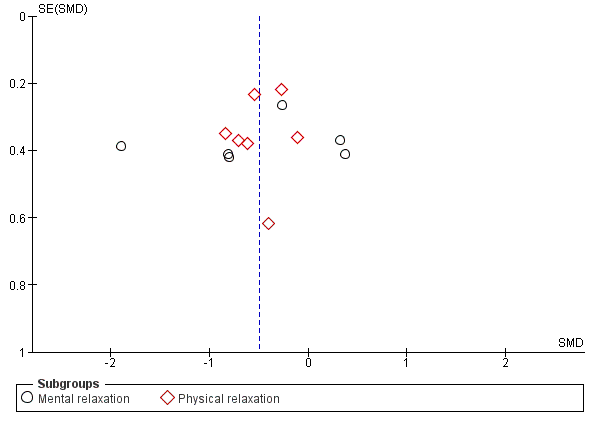
Funnel plot of comparison: 3 Relaxation vs. no intervention (SMD), outcome: 3.2 Any stress outcome (follow‐up 1 ‐ 6 months).
3.3 Any stress outcome (Follow‐up more than 6 months)
3.3.1 Mental relaxation vs. no intervention
According to one study (Stanton 1988) mental relaxation was more effective than no intervention at decreasing stress (SMD ‐1.89; 95% CI ‐2.65 to ‐1.13; 40 participants) at more than six months follow‐up (Analysis 3.3).
3.4 Any anxiety outcome (Follow‐up time from 1 to 6 months)
3.4.1 Mental relaxation vs. no intervention
One study (Yung 2004; 65 participants) found a difference in State Anxiety between participants in the control group and participants that received a cognitive relaxation intervention (Analysis 3.4), but not on Trait Anxiety (Analysis 3.5)
3.4.2 Physical relaxation vs. no intervention
The same study (Yung 2004) also found a difference in State Anxiety between participants in the control group and participants that received a stretch‐release relaxation intervention (Analysis 3.4), but again not on Trait Anxiety (Analysis 3.5).
However, when we combined the data from the two interventions (making sure we included control group data only once), we found that relaxation decreased State Anxiety when compared to no intervention (SMD ‐7.79; 95% CI ‐11.24 to ‐4.34) at one to six months follow‐up (Analysis 3.4) but not Trait Anxiety (SMD ‐1.09; 95% CI ‐4.53 to 2.36) (Analysis 3.5).
4. Relaxation vs. other intervention
4.1 Any stress outcome
4.1.1 Mental relaxation vs. in‐service education (Follow‐up from one to six months)
One study (Tsai 1993) showed that mental relaxation reduced stress more effectively than attending a course on theory analysis (SMD ‐0.61; 95% CI ‐0.97 to ‐0.24; 122 participants) when measured at five weeks after the intervention (Analysis 4.1).
4.1.2 Mental relaxation versus relaxing in a chair (Follow‐up to one month)
Lai 2011 found listening to music more effective in reducing stress levels than just relaxing in a chair (SMD ‐1.14; 95% CI ‐1.55 to ‐0.73; 108 participants) (Analysis 4.1)
4.1.3 Physical relaxation vs. a break (Follow‐up to one month)
Another study (Brennan 2006; 82 participants ) found similar stress levels in participants that were given a 10‐minute massage and in those that took a self‐directed 10‐minute break when measured directly following the intervention. Moyle 2013 compared foot‐massage to silent resting under similar conditions and found resting to be more effective but there were only 19 participants (Analysis 4.1)
4.2 Any anxiety outcome
4.2.1 Physical relaxation vs. standard touch therapy
One study (McElligott 2003) did not find a significant difference in anxiety between participants who had received AMMA therapeutic massage and those who had received the control procedure where the practitioners only held their hands on certain areas of the participants' bodies (SMD ‐0.17; 95% CI ‐1.15 to 0.82; 18 participants) (Analysis 4.2).
4.3 General Health Questionnaire
Tsai 1993 did not find a reduction in the score of the General Health Questionnaire (SMD ‐0.28; 95% CI ‐0.63 to 0.08; 122 participants) after mental relaxation compared to training in theory analysis (Analysis 4.3).
Organisational interventions
5. Organisational intervention vs. no intervention
5.1 Any stress‐related outcome (Follow‐up to one month)
5.1.1 Support interventions vs. no intervention
Li 2011 ( 49 participants) organised a peer‐support mentoring scheme among nurses and did not find a substantive difference between the intervention and no‐intervention control group (SMD ‐0.35; 95% CI ‐0.95 to 0.24) (Analysis 5.1). Salles 2013 reported beneficial effects on 'rates of burnout' in an RCT of an intervention aimed at preventing surgery residents from leaving the specialty by providing them with anecdotes on career choices from their seniors. Despite trying to contact the authors, we were not able to get enough information to include this study in the meta‐analysis.
5.1.2 Communication skills versus no intervention
Another study (Ghazavi 2010) compared the training of communication skills with the no‐intervention control group but did not find a difference at short‐term follow‐up (SMD ‐0.07; 95% CI ‐0.65 to 0.52; 45 participants)(Analysis 5.1).
5.1.3 Special care vs. no intervention
Ewers 2002 evaluated a special training programme called 'psychosocial intervention training' aimed at better handling of behaviorally problematic patients, and found a significant improvement in stress levels after the programme (SMD ‐1.23; 95% CI ‐2.21 to ‐0.26; 20 participants) (Analysis 5.1).
5.1.4 Changing working conditions vs. no intervention
Romig 2012 evaluated the use of telemedicine to decrease the work load of intensivists working at the Intensive Care Unit, but did not find a statistically significant change in the questions used to measure burnout. Because of the lack of reported data we could not include the study in a meta‐analysis. Proctor 1998 evaluated a training programme to improve work but did not find an effect on any of the six subscales of the occupational stress indicator. We could not combine these six subscales into one outcome and therefore could not include this study in the meta‐analysis.
5.2 Any stress‐related outcome (Follow‐up one to six months)
5.2.1 Changing working conditions vs. no intervention
Two studies (Le Blanc 2007; Uchiyama 2013) compared an intensive participatory programme of improving psychosocial working conditions with no intervention, but there was no considerable effect on stress levels in the meta‐analysis (SMD ‐0.12; 95% CI ‐0.30 to 0.05; 525 participants) (Analysis 5.2).
5.2.2 Special care vs. no intervention
One study introduced special care (Razavi 1993) based on a 24‐hour training programme but did not find an effect on stress levels compared to no intervention (SMD ‐0.13; 95% CI ‐0.60 to 0.33; 71 participants) (Analysis 5.2).
5.2.3 Support organisation vs. no intervention
Two studies (Günüsen 2010; Leiter 2011) organised peer support to ameliorate psychosocial stressors but did not find a considerable effect on stress levels (SMD 0.07; 95% CI ‐0.09 to 0.23; 952 participants) (Analysis 5.2). One other RCT (Heaney 1995) found that the intervention did not significantly improve psychological well‐being measured as depressive symptoms and somatization compared to the no‐intervention control group. The study could not be included in the meta‐analysis because the authors reported only regression coefficients,
5.3 Any stress‐related outcome (Follow‐up more than six months)
5.3.1. Changing working conditions vs. no intervention: RCT
Melchior 1996 improved quality of care in an RCT but there was no considerable effect on stress levels compared to no intervention (SMD ‐0.23; 95% CI ‐0.55 to 0.09; 161 participants) (Analysis 5.3).
5.3.2 Changing working conditions vs. no intervention: CCT:
Another study (Bourbonnais 2011) compared an intervention programme aimed at reducing psychosocial stressors at work with no intervention in a non‐randomised controlled design and found a lower level of stress at three years' follow‐up (SMD ‐0.38; 95% CI ‐0.56 to ‐0.20; 488 participants) (Analysis 5.3).
5.3.3 Special Care vs. no intervention
Redhead 2011 organised special care for managing symptoms in patients but the stress levels in staff were similar in the no‐intervention control group (SMD 0.08; 95% CI ‐0.78 to 0.95; 21 participants) (Analysis 5.3). Another study (Schrijnemaekers 2003) evaluated emotion‐oriented care for professional caregivers in homes for elderly persons. Due to a lack of detail in reporting of the data, we could not include the study in the meta‐analysis. At twelve months follow‐up, they reported a non‐significant difference between intervention and control group of 1.85 score points on the emotional exhaustion subscale of the Maslach Burnout Inventory (range 0 ‐ 48) in favour of the intervention group. For depersonalisation the score difference was 0.55 score points and also non‐significant. For personal accomplishment the score difference was 1.46 in favour of the intervention group and this was statistically significant.
5.3.4 Support vs. no intervention
In one RCT (Peterson 2008), the organisation of peer‐support groups led to a decrease of stress levels compared to no intervention (SMD ‐0.38; 95% CI ‐0.73 to ‐0.03; 131 participants) (Analysis 5.3)) at long‐term follow‐up. The same study found an increase on The Short Form Health Survey (SF‐36) score (MD 7.40; 95% CI 0.79 to 14.01) (Analysis 5.4).
6. Organisational intervention vs. other intervention
6.1 Any stress‐related outcome (Follow‐up time up to one month)
6.1.1 Special care vs. usual care
One study (Finnema 2005) found similar levels of nurses' stress following the implementation of integrated emotion‐oriented care vs. care as usual (SMD 0.07; 95% CI ‐0.60 to 0.75; 46 participants) (Analysis 6.1).
6.2 Any stress‐related outcome (Follow‐up from one to six months)
6.2.1 Support intervention vs. feedback only
One study (Carson 1999) compared a course underlining the importance of social support as a key coping strategy when dealing with stress to only giving participants feedback on their baseline stress questionnaire results. They found similar levels of stress following the intervention and feedback only (SMD 0.53; 95% CI ‐0.02 to 1.08; 53 participants) (Analysis 6.2).
6.3 Any stress‐related outcome (Follow‐up time more than six months)
6.3.1 Shorter vs. longer working schedules
Ali 2011 compared a work schedule with weekend breaks to a continuous schedule among intensive care staff, and Lucas 2012 compared a two‐week with a four‐week schedule among resident physicians. We combined the results of the two studies because the interventions had a similar objective and they both measured emotional exhaustion as an outcome, even though it was measured in different ways. The results showed that the shorter schedule reduced stress (SMD ‐0.55; 95% CI ‐0.84 to ‐0.25; 180 participants) (Analysis 6.3).
6.4 General Health Questionnaire
Carson 1999 measured whether support decreased the score on the GHQ more than after feedback only, but results were similar in both groups (MD ‐0.57; 95% CI ‐3.34 to 2.20; 53 participants) (Analysis 6.4). Finnema 2005 also found no difference on the GHQ after introducing special care compared to care as usual (MD ‐4.48; 95% CI ‐10.46 to 1.50; 47 participants) .
GRADE assessment
For all major comparisons we made an assessment of the quality of the evidence. The arguments on which our decisions were based are given in Table 1 for the major comparisons which included more than three studies. For all the other comparisons, with fewer than three studies and fewer than 400 participants we decided to downgrade by two levels, because of risk of bias and imprecision, to low‐quality evidence.
| Comparison | Risk of Bias | Inconsistency | Indirectness | Imprecision | Publication Bias | Level of Evidence |
| CBT vs no intervention 1 mo follow‐up | 5 out of 6 studies high risk of bias: 1 level down | I² = 64%: no downgrading | No | 332 participants No downgrading | Yes in funnel plot: 1 level down | Low Quality |
| CBT vs no intervention 1 ‐ 6 mo follow‐up | 5 out of 8 studies high risk of bias: 1 level down | I² = 54%: no downgrading | No | 549 participants No downgrading | Yes in funnel plot: 1 level down | Low Quality |
| CBT vs no intervention > 6 months follow‐up | 2 studies high risk of bias: 1 level down | I² = 38%: no downgrading | No | 157 participants 1 level down | Not apparent | Low Quality |
| Relaxation vs no intervention 1 mo follow‐up | 3 out 4 studies high risk of bias: 1 level down | I² = 0%: no downgrading | No | 97 participants 1 level down | Not apparent | Low Quality |
| Relaxation vs no intervention 1 ‐ 6 mo follow‐up | 10 out of 13 studies high risk of bias: 1 level down | I² = 57%: no downgrading | No | 521 participants no downgrading | Not apparent | Moderate Quality |
| Relaxation vs no intervention > 6 mo follow‐up | 1 study: no downgrading | N/A | No | 40 participants 2 levels down | Not apparent | Low Quality |
Sensitivity analysis
Influence of study risk of bias
We defined low‐quality studies as those that had one or more domains at high risk of bias or no domain with a low risk of bias (i.e. all domains had an unclear or high risk of bias). We ignored the blinding issues here, because this applied similarly to all studies. This left us with 40 low‐quality studies, 17 moderate‐quality studies and one high‐quality study (Günüsen 2010).
Removing low‐quality studies from the comparison of CBT versus no intervention left only one study at less than one month follow‐up (Norvell 1987); the SMD was ‐1.20 (95% CI ‐2.47 to 0.08), i.e. substantially greater than with low‐quality studies included (SMD ‐0.25; 95% CI ‐0.60 to 0.11). Doing the same with the comparison at one to six months follow‐up left three studies (Delvaux 2004; Günüsen 2010; West 1984) with an SMD of ‐0.62 (95% CI ‐1.04 to ‐0.19), compared with SMD ‐0.28 (95% CI ‐0.47 to ‐0.09) across six studies. At six months' follow‐up there was only one study, so no sensitivity analysis was possible.
Removing low‐quality studies from the comparison relaxation versus no intervention left only one study at one month follow‐up, with an SMD of ‐0.71 (95% CI ‐1.43 to 0.02), compared with SMD ‐0.48 (95% CI ‐0.89 to ‐0.08) across four studies. At one to six months follow‐up, there were three studies left (Hansen 2006; Moody 2013; Stanton 1988) with an SMD of ‐0.79 (95% CI ‐1.23 to ‐0.35), compared to an SMD of ‐0.49 (95% CI ‐1.15 to 0.15) across 12 studies. Heterogeneity, however, remained high, with an I² of 88%, due to the presence of one study with a large effect (Stanton 1988). At six months follow‐up there was again only one study and thus sensitivity analysis was not possible.
For all the other comparisons there were too few studies to meaningfully re‐analyse the findings.
Influence of similarity of stress measurement instruments assumption
We checked the assumption that various stress measurement instruments measure the same stress concept and can be pooled with SMDs. We redid the analyses with only those studies that measured stress with the MBI. For CBT versus no intervention with a follow‐up of one month, there were two studies that could be included which showed significant improvements in emotional exhaustion (Analysis 7.1). However, the results on the other two subscales depersonalisation and lack of personal accomplishment were too heterogeneous to combine (Analysis 7.1). At medium‐term follow‐up there were two studies that could be included and that showed positive results for emotional exhaustion, non‐significant results for depersonalisation and for the lack of personal accomplishment subscale the results were too heterogeneous to combine (Analysis 7.2). The results for CBT including relaxation showed a decrease in emotional exhaustion but not for personal accomplishment. Results for the depersonalisation were not reported in these studies (Analysis 8.1). In the long‐term comparison of CBT versus another intervention, in one study, none of the scales showed significant differences (Analysis 9.1). Relaxation did not show beneficial effects on any of the subscales but an increase in the score on lack of personal accomplishment compared to no intervention at one to six months follow‐up (Analysis 10.1). Organisational interventions compared to no intervention showed favourable effects on the emotional exhaustion and depersonalisation subscales but not on the personal accomplishment subscale at less than a month's follow‐up (Analysis 11.1). At one to six months' follow‐up however, effects were non‐significant on the emotional exhaustion and depersonalisation subscales and the results were too heterogeneous to combine in meta‐analysis (Analysis 11.2). At more than six months' follow‐up, organisational interventions again yielded favourable effects on the emotional exhaustion and depersonalisation subscales but not on lack of personal accomplishment (Analysis 11.3). However, the one study that could not be included in the meta‐analyses (Schrijnemaekers 2003) yielded a significant effect on the personal accomplishment scale but not on the two other scales at the end of 12 months follow‐up. There was only one study that compared an organisation intervention with an alternative intervention and the results did not reach significance on any of the three subscales of the MBI (Analysis 12.1).
All in all, this analysis shows that meta‐analysis results are similar when combining all stress‐related measures or when using the emotional exhaustion or the depersonalisation subscale, but not when using the personal accomplishment subscale. It could be that it is more difficult to change someone's score on the personal accomplishment subscale with an intervention. Another possible explanation is that with healthcare workers this domain is the least affected to begin with.
Subgroup analysis and explanation of heterogeneity
Since working conditions differ considerable between various occupations in health care, we analysed if there were differences in the effects of CBT and relaxation between various occupations. We did so only for comparisons with sufficient studies: CBT vs. no intervention and relaxation vs. no intervention (Analysis 13.1; Analysis 13.2; Analysis 14.1; Analysis 14.2). We ignored the previous subgroups in the CBT and relaxation intervention categories and divided the studies according to the occupation of the participants into nurses, physicians, all staff and other healthcare professionals. There were no differences between these subgroups. Within the subgroups however, there was still considerable statistical heterogeneity. We therefore do not think that the occupation of the participants explains statistical heterogeneity between studies.
Discusión
Resumen de los resultados principales
Se encontraron pruebas de baja calidad de que las intervenciones de entrenamiento cognitivo‐conductual (ECC) con o sin técnicas de relajación en los trabajadores de la salud reducen los niveles de síntomas del síndrome de desgaste profesional en comparación con ninguna intervención entre uno y seis meses en ocho estudios con 549 personas (diferencia de medias estandarizadas [DME] ‐0,38) y luego de más de seis meses de seguimiento en dos estudios con 157 personas (DME ‐1,04). Con menos de un mes de seguimiento la diferencia no fue significativa. Lo anterior no se modificó al excluir los estudios de baja calidad ni por tipos de participantes.
Traducido a la subescala emotional exhaustion (EE) (cansancio emocional excesivo) del Maslach Burnout Inventory (MBI), y al suponer una desviación estándar (DE) de 7,1 (la mediana de todos los grupos de intervención y control que utilizaron la subescala EE del MBI), una DME de ‐0,38 significa una disminución en el grupo de intervención de 2,7 puntos en la puntuación de la subescala EE del MBI. La mediana de la puntuación de todos los grupos control en esta escala del MBI fue 21. Por lo tanto, la intervención disminuye los niveles de estrés en el 13% (intervalo de confianza [IC] del 95%: 5% a 20%). Debido a que no se conocen diferencias clínica o mínimamente importantes del MBI, probablemente se pueda considerar mejor un efecto moderado. En las comparaciones del ECC con otras intervenciones activas no hubo diferencias considerables. Fue difícil establecer conclusiones porque variaron los controles y la mayoría se utilizó en estudios únicos solamente.
Con las intervenciones de relajación las reducciones de los niveles de estrés fueron comparables a las del ECC. Hubo pruebas de calidad baja a moderada de que los niveles de estrés permanecieron más bajos al mes de seguimiento, en cuatro estudios con 97 personas (DME ‐0,48), entre uno y seis meses en 12 estudios con 521 personas (DME ‐0,49) y luego de más de seis meses en un estudio con 40 personas (DME ‐1,89). No hubo diferencias significativas entre la relajación física como los masajes, o la relajación mental como la meditación de conciencia plena. Las comparaciones de la relajación versus otras intervenciones fueron difíciles de evaluar porque los grupos control variaron y no se pudieron agrupar. Los resultados fueron en el mejor de los casos inconsistentes.
Hubo pruebas de baja calidad en dos estudios de que la modificación de los esquemas de trabajo redujo los niveles de estrés. Otras intervenciones organizativas no provocaron reducciones considerables de los niveles de estrés en cualquiera de los tres períodos de seguimiento. Sin embargo, esta conclusión se basa fundamentalmente en estudios únicos solamente.
Compleción y aplicabilidad general de las pruebas
Se han realizado estudios en muchos países y en casi todos los continentes, a excepción de África. Aunque no se realizó un análisis de subgrupos específico, no parece que haya diferencias en el efecto entre culturas diferentes. Las técnicas chinas de relajación como Qigong son igualmente aplicables en Europa, y a la inversa, el ECC parece dar lugar a efectos en el personal de enfermería japonés similares a los del personal de enfermería de los EE.UU.
Los estudios se han realizado en diversas ocupaciones de asistencia sanitaria. En la versión anterior de esta revisión, las intervenciones de tratamiento del estrés se estudiaron casi exclusivamente en el personal de enfermería, pero actualmente también se han realizado algunos estudios con médicos. Se considera que es importante porque es concebible que las intervenciones tendrían un efecto diferente entre los médicos. Se realizó un análisis de subgrupos formal del efecto en diversas ocupaciones de asistencia sanitaria. No hubo diferencias en el efecto entre los subgrupos, pero el poder estadístico de la prueba para detectar estas diferencias es bajo.
En la actualidad, el número de estudios ha aumentado enormemente y la mayoría de los estudios se ha publicado después de 2010. Lo anterior significa que las pruebas son recientes y aplicables a situaciones actuales de la asistencia sanitaria.
Se ha estudiado una variedad amplia de intervenciones dirigidas a la persona, que van desde aromaterapia, masaje, musicoterapia y Qigong hasta técnicas de ECC más formales que abordan la relación entre los pensamientos y las emociones. También cuando se trata de intervenciones organizativas se ha estudiado un rango amplio, que varía desde la creación de grupos de apoyo hasta cambiar el contenido de la atención.
Al igual que para los resultados, no está claro cuál es el objetivo principal de las intervenciones. Por ejemplo, el MBI discierne tres aspectos específicos del síndrome de desgaste profesional: el cansancio emocional excesivo, la despersonalización y la falta de realización personal. No está claro si las diversas intervenciones tienen como objetivo prevenir aspectos específicos del síndrome de desgaste profesional o solamente intentan reducir el cansancio emocional excesivo.
Calidad de la evidencia
La calidad de las pruebas que se encontraron no fue muy alta. Algunos estudios aplicaron métodos rigurosos pero enfrentaron problemas de deserción. La mayoría de los ensayos controlados aleatorios (ECA) tuvo menos de 120 participantes, especialmente los que examinaron técnicas de relajación. Para una DME de ‐0,38 y con el uso de la fórmula de Lehr, un tamaño de la muestra de 110 es suficiente para encontrar una diferencia significativa con p < 0,05 y un poder estadístico del 80% (Petrie 2006). La calidad del informe fue baja y la mayoría de los estudios no informó adecuadamente sobre la generación de números aleatorios ni la ocultación de la asignación. Se supone que los resultados medidos con un cuestionario se les informaron de forma ciega a los investigadores, pero no es posible asegurarlo.
En muchos estudios, al parecer los propios trabajadores de la salud están muy interesados en los efectos de las intervenciones de tratamiento de estrés sobre ellos mismos y sus colegas. Lo anterior no siempre da lugar a estudios de mejor calidad. Con frecuencia faltan cálculos formales del poder estadístico y el personal de un único departamento se asigna al azar a un grupo de intervención y a un grupo control. Debido al gran interés en la prevención de estrés en el personal de salud, sería apropiado que los que realicen estudios nuevos estén mejor educados en cómo diseñar y realizar estudios para reducir al mínimo el riesgo de sesgo.
A pesar de que se encontraron resultados significativos, no es posible determinar cómo este hecho se relaciona con la relevancia clínica de los cambios logrados en los estudios. Con el MBI (Maslach 1996), por ejemplo, no existen cambios generalmente aceptados que se considerarían pertinentes desde el punto de vista clínico. Se estableció contacto con los autores del cuestionario pero no pudieron ayudar a aclarar este tema.
Sesgos potenciales en el proceso de revisión
Se supuso que los diversos instrumentos de medición del estrés midieron el mismo aspecto del estrés percibido. Hay algunas pruebas de que la escala de cansancio emocional excesivo del MBI se puede reemplazar con una pregunta de un ítem único sobre el síndrome de desgaste profesional autodefinido (Rohland 2004). Debido a que se encontró heterogeneidad considerable entre los estudios, este supuesto no está apoyado por pruebas. Sin embargo, los resultados también se presentaron por separado para los estudios que utilizaron el MBI y se presentaron como las escalas originales del MBI, no transformados a DME. Incluso aunque solo fue posible incluir una fracción de todos los estudios, este análisis mostró resultados similares. Por lo tanto, se considera que los resultados basados en las DME son confiables.
Las intervenciones se debieron categorizar. No hay un marco principal disponible para la categorización de las intervenciones de prevención del estrés. Se considera que la clasificación principal en intervenciones dirigidas al trabajo y a las personas es útil porque es considerablemente más difícil modificar las estructuras organizativas o introducir nuevos elementos organizativos que organizar un curso individual de tratamiento del estrés. Sin embargo, muchas intervenciones como la organización de grupos de apoyo de compañeros o los esquemas de tutoría son difíciles de clasificar como intervenciones dirigidas al trabajo y a las personas. Si la clasificación de las intervenciones hubiera sido diferente, entonces también podrían haber cambiado los resultados. Sin embargo, no se considera que lo anterior hubiera afectado a las conclusiones principales basadas en las intervenciones de ECC, relajación y organizativas.
Se tuvieron en cuenta los períodos de seguimiento cuando se agruparon los diversos resultados de los estudios. Esta consideración dio lugar a que los estudios se distribuyeran entre diferentes períodos de seguimiento. Con diferentes categorías de períodos de seguimiento, las comparaciones habrían sido diferentes y posiblemente también los resultados. Faltaron recursos para evaluar los efectos de estas suposiciones. No se sabe como varían los efectos de las intervenciones de tratamiento del estrés en diversos períodos de seguimiento. Es posible que también sea prudente combinar todos los estudios con un seguimiento mayor de un mes. Se considera que se justifica un enfoque más conservador si no se dispone de pruebas claras de efectos similares.
Se incluyeron informes de estudios en todos los idiomas, por lo que se piensa que no hay sesgo de idioma en esta revisión.
El sesgo de publicación se evaluó basado en muestras muy pequeñas de los estudios (siete, ocho y 13 respectivamente) y se disminuyó la calificación del nivel de las pruebas en dos comparaciones debido a la sospecha de sesgo de publicación. Como The Cochrane Handbook (Higgins 2011) recomienda utilizar un mínimo de diez estudios para evaluar el sesgo de publicación, este puede haber dado lugar a un cálculo demasiado conservador de la calidad de las pruebas.
Acuerdos y desacuerdos con otros estudios o revisiones
Revisiones sobre prevención del estrés en el personal de enfermería
Cuando se compara con una revisión anterior como Mimura 2003, esta revisión, aunque utilizó los criterios de inclusión más rigurosos, y sólo se aceptaron ensayos controlados aleatorios para las intervenciones dirigidas a las personas, encontró 51 ensayos más. Aunque Mimura 2003 se abstuvo de establecer conclusiones claras basadas en los estudios encontrados, fue posible realizar mejores inferencias. Jones 2000brevisó estudios en personal de enfermería y estudiantes de enfermería, pero solamente en el período de 1992 a 1999 y es fundamentalmente narrativa. Gilbody 2006 revisó intervenciones para mejorar la moral del personal, limitadas a los trabajadores de salud mental solamente. Se estableció casi la misma conclusión que la de esta revisión, aunque el número de estudios incluidos fue inferior y utilizaron un rango mayor de medidas de resultado y de diseños de estudio. Paris 2010 revisó la efectividad de la intervención en trabajadores de salud mental, pero identificó solamente dos estudios de intervención no aleatorios. Los autores concluyen que no se han evaluado muchas estrategias para prevenir el síndrome de desgaste profesional que se mencionan en la bibliografía, como la introducción de sueldos competitivos, incentivos económicos y no económicos, oportunidades para la promoción y el ascenso profesional, aumento del nivel en el personal, descripciones o expectativas claras del puesto y políticas de puerta abierta con el tratamiento. De otras intervenciones posibles que mencionan se encontraron pruebas en esta revisión: entrenamiento del personal en estrategias de autocuidado, supervisión y tutoría clínica adicional, evaluación regular del síndrome de desgaste profesional, esquemas de trabajo flexibles, eventos sociales y apoyo informal, así como el entrenamiento en el servicio. Galbraith 2011 estudió los efectos de la intervención en estudiantes de enfermería. La revisión identificó 16 estudios y concluyó que la relajación y las aptitudes para cambiar las cogniciones maladaptativas fueron eficaces. Además, los autores concluyeron que las intervenciones que promovieron las aptitudes para reducir los factores estresantes también fueron exitosas, pero que no hubo efectos sobre el rendimiento académico. Los autores coinciden con las conclusiones de esta revisión en que el diseño de las intervenciones para el estrés debería basarse más en la teoría. Pulido‐Martos 2012revisó 23 estudios sobre las fuentes de estrés en estudiantes de enfermería y encontró que, además del estrés por el rendimiento académico, los estudiantes percibieron el estrés de las situaciones clínicas como el temor a las situaciones desconocidas, las equivocaciones con los pacientes o la manipulación del equipo técnico. No está claro si las intervenciones actuales también abordarían estos factores, aunque en general un mejor tratamiento individual del estrés probablemente también funcione en estas situaciones.
Revisiones sobre la prevención del estrés en todas las ocupaciones
La calidad de las pruebas que se encontró en esta revisión también fue mejor que la que se encontró en Michie 2003, ya que su muestra consistió casi completamente en estudios transversales. Otra revisión de Van der Klink 2001 incluyó un metanálisis de intervenciones para prevenir o tratar el estrés en todas las ocupaciones. De acuerdo con los resultados de esta versión de la revisión,Van der Klink 2001 concluyó que no hubo pruebas a favor de las intervenciones dirigidas al trabajo. Richardson 2008 realizó una revisión sistemática y metanálisis de ECA de intervenciones de tratamiento del estrés en cualquier ocupación. Encontró y agrupó 36 estudios y obtuvo una DME de 0,526 (IC del 95%: 0,36 a 0,69). En su análisis, los programas cognitivo‐conductuales produjeron efectos mayores que otros tipos de intervenciones. La duración del tratamiento, el tipo de resultado y la ocupación no mostraron variaciones significativas en el tamaño del efecto por tipo de intervención. Estos resultados son comparables a los de esta revisión, pero aquí se encontró que los efectos de la relajación y el ECC fueron similares. La revisión perdió muchos estudios realizados en la atención sanitaria porque los autores no buscaron en MEDLINE; la suya fue la única revisión que evaluó el sesgo de publicación. Mediante el método de cortar y completar, encontraron solamente una indicación débil de sesgo de publicación en los estudios de ECC. Awa 2010 revisó, hasta 2007, 25 estudios de intervención encaminados a prevenir el síndrome de desgaste profesional. Los autores incluyeron todas las evaluaciones antes y después, pero solamente con medidas de resultado similares al síndrome de desgaste profesional como el MBI. Concluyeron que las intervenciones dirigidas a la persona redujeron el síndrome de desgaste profesional a corto plazo (seis meses o menos), mientras que una combinación de intervenciones dirigidas a la persona y organizativas tuvo efectos positivos más duraderos (12 meses y más). En todos los casos, los efectos positivos de la intervención disminuyeron con el transcurso del tiempo. Estas conclusiones no están claras en esta revisión. Lo anterior se podría deber a la clasificación diferente de las intervenciones, pero también al hecho de que los autores no realizaron un metanálisis. Chiesa 2009identificó diez estudios que evaluaron la reducción del estrés basada en la conciencia plena y encontró que las intervenciones basadas en la conciencia plena son eficaces para reducir el estrés. Según un estudio concluyeron, de acuerdo con esta revisión, que las intervenciones basadas en la conciencia plena produjeron efectos similares a la relajación física. Calificaron la calidad de las pruebas como baja y propusieron comparar las intervenciones basadas en la conciencia plena con otras intervenciones no específicas. Malgorzata 2010 proporcionó un resumen general de intervenciones organizativas encaminadas a reducir el estrés, pero no fue una revisión sistemática.
Resúmenes de revisiones sistemáticas
Günthner 2010proporcionó un resumen de revisiones sistemáticas sobre el tratamiento del estrés como prevención del síndrome de desgaste profesional. Concluyó que el ECC es la intervención más eficaz, aunque no realizó un metanálisis de redes. Concluyó que las sesiones de refuerzo son beneficiosas. Bhui 2012también proporcionó un resumen narrativo de la efectividad de las intervenciones individuales, organizativas y mixtas sobre la salud mental basado en 23 revisiones sistemáticas. Concluyó que los metanálisis encontraron un mayor tamaño del efecto de las intervenciones individuales sobre los resultados individuales. Las intervenciones organizativas mostraron pruebas mixtas de beneficio. A diferencia de esta revisión, encontró que los programas cognitivo‐conductuales produjeron efectos más grandes a nivel individual en comparación con otras intervenciones. No consideró la posibilidad de sesgo de publicación.
Por lo tanto, al parecer ninguna revisión ha analizado todos los estudios recientes sobre el tratamiento del estrés en el personal de la salud publicados después de 2010. La mayoría de las otras revisiones no examinó la posibilidad de sesgo de publicación que favoreciera los resultados beneficiosos. En comparación con otras revisiones, las conclusiones de esta revisión son más cautelosas.
Risk of bias summary: review authors' judgements about each risk of bias item for each included study.
Funnel plot of comparison: 1 Cognitive‐behavioural intervention vs no Intervention (SMD), outcome: 1.1 Any Stress‐related Outcome (follow‐up up to 1 month).
Funnel plot of comparison: 1 Cognitive‐behavioural intervention vs no Intervention (SMD), outcome: 1.2 Any Stress‐related Outcome (follow‐up 1 ‐ 6 months).
Funnel plot of comparison: 3 Relaxation vs. no intervention (SMD), outcome: 3.2 Any stress outcome (follow‐up 1 ‐ 6 months).

Comparison 1 Cognitive‐behavioural intervention vs no Intervention (SMD), Outcome 1 Any Stress‐related Outcome (follow‐up up to 1 month).
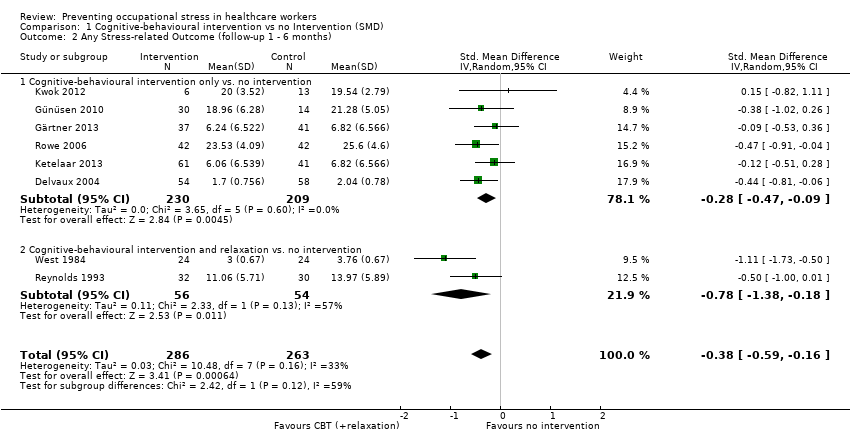
Comparison 1 Cognitive‐behavioural intervention vs no Intervention (SMD), Outcome 2 Any Stress‐related Outcome (follow‐up 1 ‐ 6 months).
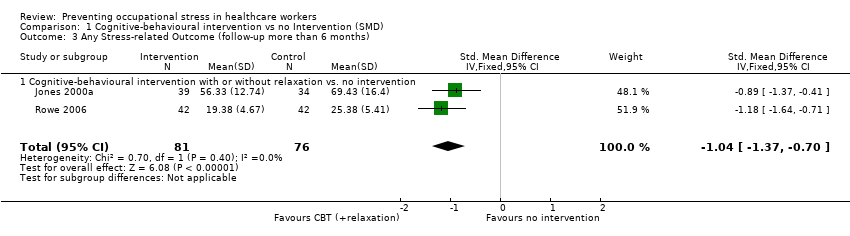
Comparison 1 Cognitive‐behavioural intervention vs no Intervention (SMD), Outcome 3 Any Stress‐related Outcome (follow‐up more than 6 months).

Comparison 1 Cognitive‐behavioural intervention vs no Intervention (SMD), Outcome 4 State‐Trait Anxiety Inventory (follow‐up up to 1 month).
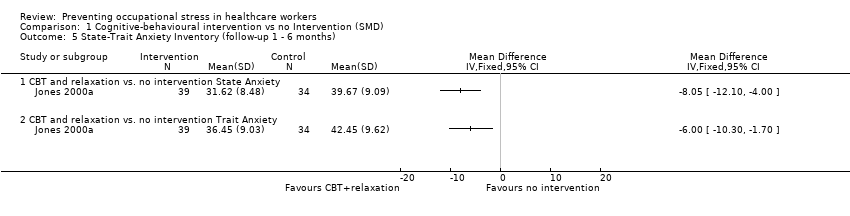
Comparison 1 Cognitive‐behavioural intervention vs no Intervention (SMD), Outcome 5 State‐Trait Anxiety Inventory (follow‐up 1 ‐ 6 months).

Comparison 1 Cognitive‐behavioural intervention vs no Intervention (SMD), Outcome 6 General Health Questionnaire (follow‐up up to 1 month).

Comparison 2 Cognitive‐behavioural intervention vs. non‐stress management intervention (SMD), Outcome 1 Any stress scale (follow‐up 1 ‐ 6 months).

Comparison 2 Cognitive‐behavioural intervention vs. non‐stress management intervention (SMD), Outcome 2 Any stress scale (follow‐up more than 6 months).

Comparison 2 Cognitive‐behavioural intervention vs. non‐stress management intervention (SMD), Outcome 3 Anxiety (follow‐up 1 ‐ 6 months).

Comparison 3 Relaxation vs. no intervention (SMD), Outcome 1 Any stress outcome (follow‐up up to 1 month).

Comparison 3 Relaxation vs. no intervention (SMD), Outcome 2 Any stress outcome (follow‐up 1 ‐ 6 months).

Comparison 3 Relaxation vs. no intervention (SMD), Outcome 3 Any stress outcome (follow‐up more than 6 months).

Comparison 3 Relaxation vs. no intervention (SMD), Outcome 4 State Anxiety (follow‐up 1 ‐ 6 months).
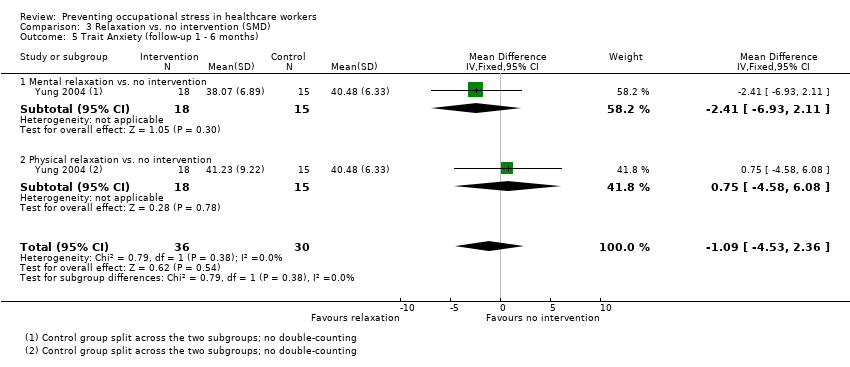
Comparison 3 Relaxation vs. no intervention (SMD), Outcome 5 Trait Anxiety (follow‐up 1 ‐ 6 months).

Comparison 3 Relaxation vs. no intervention (SMD), Outcome 6 General Health (follow‐up 1 ‐ 6 months).

Comparison 4 Relaxation vs. other intervention (SMD), Outcome 1 Any stress outcome.

Comparison 4 Relaxation vs. other intervention (SMD), Outcome 2 Any anxiety outcome.
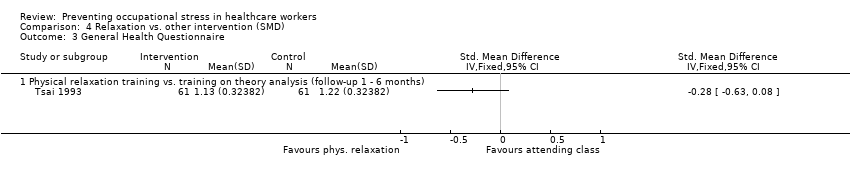
Comparison 4 Relaxation vs. other intervention (SMD), Outcome 3 General Health Questionnaire.
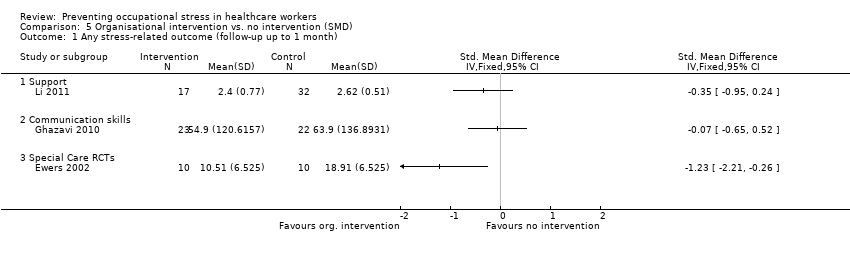
Comparison 5 Organisational intervention vs. no intervention (SMD), Outcome 1 Any stress‐related outcome (follow‐up up to 1 month).

Comparison 5 Organisational intervention vs. no intervention (SMD), Outcome 2 Any stress‐related outcome RCTs (follow‐up 1 ‐ 6 months).

Comparison 5 Organisational intervention vs. no intervention (SMD), Outcome 3 Any stress‐related outcome (follow‐up more than 6 months).

Comparison 5 Organisational intervention vs. no intervention (SMD), Outcome 4 The Short Form Health Survey (SF‐36) (follow‐up more than 6 months).

Comparison 6 Organisational intervention vs. other intervention (SMD), Outcome 1 Any stress‐related outcome (follow‐up up to 1 month).

Comparison 6 Organisational intervention vs. other intervention (SMD), Outcome 2 Any stress‐related outcome (follow‐up 1 ‐ 6 months).

Comparison 6 Organisational intervention vs. other intervention (SMD), Outcome 3 Any stress‐related outcome (follow‐up more than 6 months).
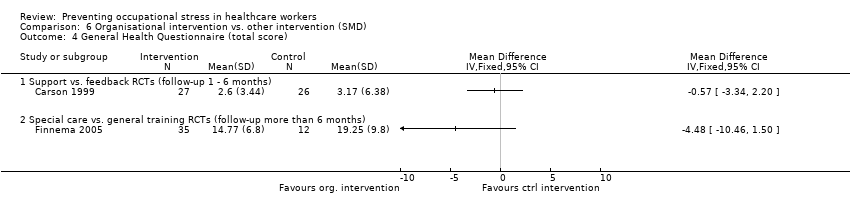
Comparison 6 Organisational intervention vs. other intervention (SMD), Outcome 4 General Health Questionnaire (total score).
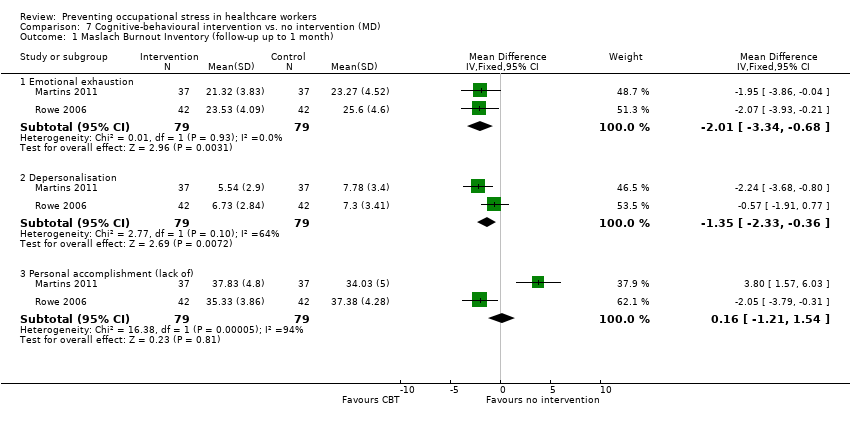
Comparison 7 Cognitive‐behavioural intervention vs. no intervention (MD), Outcome 1 Maslach Burnout Inventory (follow‐up up to 1 month).

Comparison 7 Cognitive‐behavioural intervention vs. no intervention (MD), Outcome 2 Maslach Burnout Inventory (follow‐up 1 to 6 months).

Comparison 8 Cognitive‐behavioural intervention and relaxation vs. no intervention (MD), Outcome 1 Maslach Burnout Inventory (follow‐up up to 1 month).
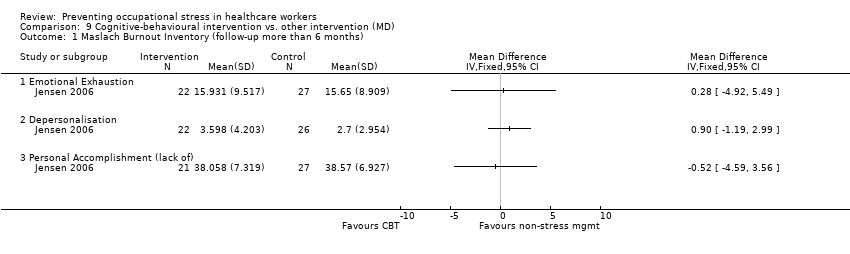
Comparison 9 Cognitive‐behavioural intervention vs. other intervention (MD), Outcome 1 Maslach Burnout Inventory (follow‐up more than 6 months).

Comparison 10 Relaxation vs. no intervention (MD), Outcome 1 Maslach Burnout Inventory (follow‐up 1 ‐ 6 months).
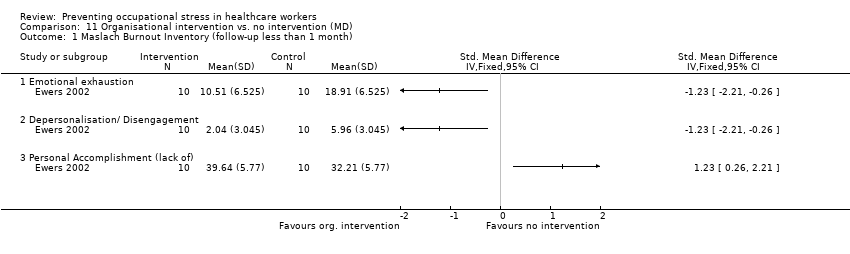
Comparison 11 Organisational intervention vs. no intervention (MD), Outcome 1 Maslach Burnout Inventory (follow‐up less than 1 month).
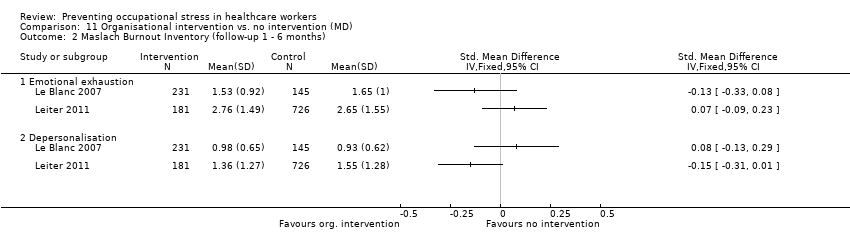
Comparison 11 Organisational intervention vs. no intervention (MD), Outcome 2 Maslach Burnout Inventory (follow‐up 1 ‐ 6 months).

Comparison 11 Organisational intervention vs. no intervention (MD), Outcome 3 Maslach Burnout Inventory or Oldenburg Burnout Inventory (follow‐up more than 6 months).

Comparison 12 Organisational intervention vs. other intervention (MD), Outcome 1 Maslach Burnout Inventory (follow‐up 1 ‐ 6 months).

Comparison 13 Cognitive‐behavioural intervention vs. no Intervention (SUBGROUPS) (SMD), Outcome 1 Any Stress‐related Outcome (follow‐up up to 1 month).
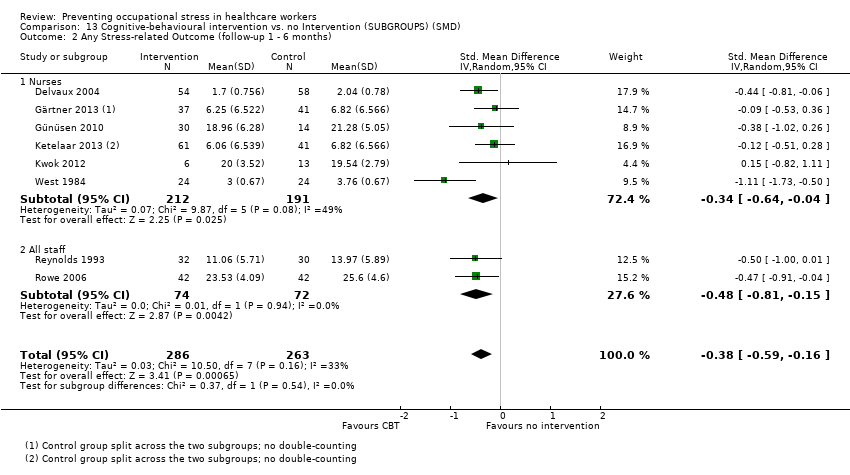
Comparison 13 Cognitive‐behavioural intervention vs. no Intervention (SUBGROUPS) (SMD), Outcome 2 Any Stress‐related Outcome (follow‐up 1 ‐ 6 months).

Comparison 14 Relaxation vs. no intervention (SUBGROUPS) (SMD), Outcome 1 Any stress outcome (follow‐up to 1 month).
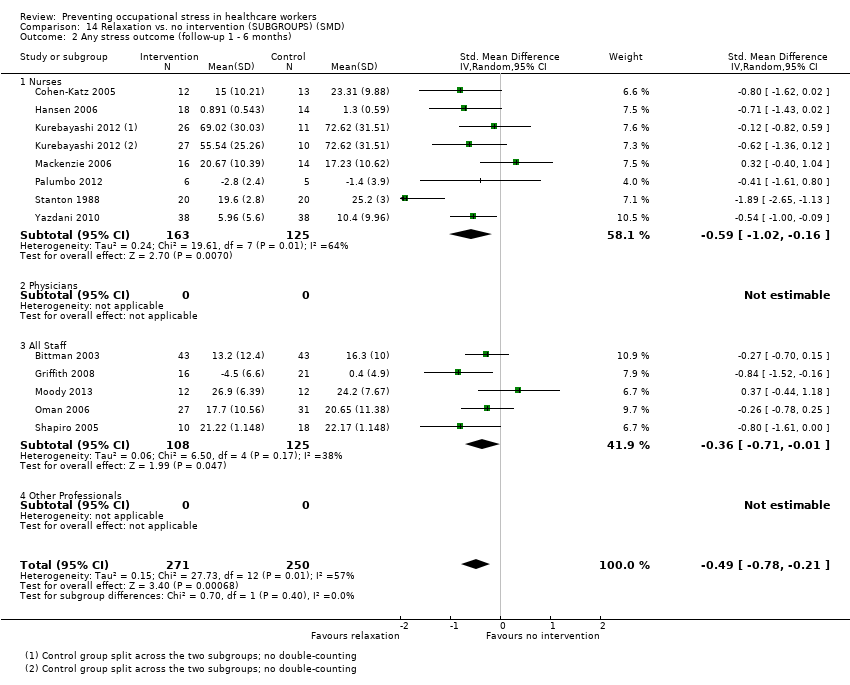
Comparison 14 Relaxation vs. no intervention (SUBGROUPS) (SMD), Outcome 2 Any stress outcome (follow‐up 1 ‐ 6 months).
| Cognitive‐behavioural intervention compared to no Intervention for reducing stress | ||||||
| Patient or population: Healthcare workers | ||||||
| Outcomes | Illustrative comparative risks* (95% CI) | Relative effect | No of Participants | Quality of the evidence | Comments | |
| Assumed risk | Corresponding risk | |||||
| No Intervention | Cognitive‐behavioural intervention | |||||
| Stress 1 Month | The median stress level across all control groups across all follow‐up times was 24.33 points on the Emotional Exhaustion subscale of the Maslach Burnout Inventory¹ | The mean stress level at 1 month in the intervention groups was 1.22 points lower (2.98 lower to 0.59 higher). | SMD ‐0.27 (‐0.66 to 0.13) | 332 | ⊕⊕⊝⊝ | This meta‐analysis was back transformed to the EE subscale of the MBI by using the median SD of the EE scale across control groups. |
| Stress 1 ‐ 6 months | The median stress level across all control groups across all follow‐up times was 24.33 points on the Emotional Exhaustion subscale of the Maslach Burnout Inventory¹ | The mean stress at 1 ‐ 6 months in the intervention groups was 1.83 points lower (0.77 to 2.85 lower). | SMD ‐0.38 (‐0.59 to ‐0.16) | 549 | ⊕⊕⊝⊝ low²,³ | This meta‐analysis was back transformed to the EE subscale of the MBI by using the median SD of the EE scale across control groups. |
| Stress > 6 months | The median stress level across all control groups across all follow‐up times was 24.33 points on the Emotional Exhaustion subscale of the Maslach Burnout Inventory¹ | The mean stress at more than 6 months in the intervention groups was 11.34 points lower (4.47 to 14.94 lower) | SMD ‐1.04 (‐1.37 to ‐0.70) | 157 | ⊕⊕⊝⊝ low²,³ | This meta‐analysis was back transformed to the EE subscale of the MBI by using the median SD of the EE scale across control groups. |
| *The basis for the assumed risk (e.g. the median control group risk across studies) is provided in footnotes. The corresponding risk (and its 95% confidence interval) is based on the assumed risk in the comparison group and the relative effect of the intervention (and its 95% CI). | ||||||
| GRADE Working Group grades of evidence | ||||||
| 1 This was the median from the control groups of all studies that measured the effect of CBT vs. no intervention on Emotional Exhaustion with the same scale. | ||||||
| Relaxation compared to no intervention (SMD) for | ||||||
| Patient or population: Healthcare workers | ||||||
| Outcomes | Illustrative comparative risks* (95% CI) | Relative effect | No of Participants | Quality of the evidence | Comments | |
| Assumed risk | Corresponding risk | |||||
| no intervention (SMD) | Relaxation | |||||
| Stress 1 month | The median stress level across all control groups across all follow‐up times was 22.17 points on the Emotional Exhaustion subscale of the Maslach Burnout Inventory¹ | The mean stress at 1 month in the intervention groups was 2.14 points lower (0.36 to 3.96 lower). | SMD ‐0.48 (‐0.89 to ‐0.08) | 97 | ⊕⊕⊝⊝ low | This meta‐analysis was back transformed to the EE subscale of the MBI by using the median SD of the EE scale across control groups. |
| Stress 1 ‐ 6 months | The median stress level across all control groups across all follow‐up times was 22.17 points on the Emotional Exhaustion subscale of the Maslach Burnout Inventory¹ | The mean stress at 1 ‐ 6 months in the intervention groups was 4.84 points lower (2.37 to 6.92 lower). | SMD ‐0.49 (‐0.78 to ‐0.21) | 521 | ⊕⊕⊕⊝ moderate | This meta‐analysis was back transformed to the EE subscale of the MBI by using the median SD of the EE scale across control groups. |
| Stress > 6 months | The median stress level across all control groups across all follow‐up times was 22.17 points on the Emotional Exhaustion subscale of the Maslach Burnout Inventory¹ | The mean stress at > 6 months in the intervention groups was 5.67 points lower (3.39 to 7.95 lower). | SMD ‐1.89 (‐2.65 to ‐1.13) | 40 | ⊕⊕⊝⊝ low | This result was back transformed to the EE subscale of the MBI by using the median SD of the EE scale across control groups. |
| *The basis for the assumed risk (e.g. the median control group risk across studies) is provided in footnotes. The corresponding risk (and its 95% confidence interval) is based on the assumed risk in the comparison group and the relative effect of the intervention (and its 95% CI). | ||||||
| GRADE Working Group grades of evidence | ||||||
| 1 This was the median from the control groups of all studies that measured the effect of relaxation vs. no intervention on Emotional Exhaustion with the same scale. | ||||||
| Comparison | Risk of Bias | Inconsistency | Indirectness | Imprecision | Publication Bias | Level of Evidence |
| CBT vs no intervention 1 mo follow‐up | 5 out of 6 studies high risk of bias: 1 level down | I² = 64%: no downgrading | No | 332 participants No downgrading | Yes in funnel plot: 1 level down | Low Quality |
| CBT vs no intervention 1 ‐ 6 mo follow‐up | 5 out of 8 studies high risk of bias: 1 level down | I² = 54%: no downgrading | No | 549 participants No downgrading | Yes in funnel plot: 1 level down | Low Quality |
| CBT vs no intervention > 6 months follow‐up | 2 studies high risk of bias: 1 level down | I² = 38%: no downgrading | No | 157 participants 1 level down | Not apparent | Low Quality |
| Relaxation vs no intervention 1 mo follow‐up | 3 out 4 studies high risk of bias: 1 level down | I² = 0%: no downgrading | No | 97 participants 1 level down | Not apparent | Low Quality |
| Relaxation vs no intervention 1 ‐ 6 mo follow‐up | 10 out of 13 studies high risk of bias: 1 level down | I² = 57%: no downgrading | No | 521 participants no downgrading | Not apparent | Moderate Quality |
| Relaxation vs no intervention > 6 mo follow‐up | 1 study: no downgrading | N/A | No | 40 participants 2 levels down | Not apparent | Low Quality |
| Outcome or subgroup title | No. of studies | No. of participants | Statistical method | Effect size |
| 1 Any Stress‐related Outcome (follow‐up up to 1 month) Show forest plot | 7 | 332 | Std. Mean Difference (IV, Random, 95% CI) | ‐0.27 [‐0.66, 0.13] |
| 1.1 Cognitive‐behavioural intervention only vs. no intervention | 4 | 248 | Std. Mean Difference (IV, Random, 95% CI) | ‐0.25 [‐0.60, 0.11] |
| 1.2 Cognitive‐behavioural intervention and relaxation vs. no intervention | 3 | 84 | Std. Mean Difference (IV, Random, 95% CI) | ‐0.45 [‐1.61, 0.70] |
| 2 Any Stress‐related Outcome (follow‐up 1 ‐ 6 months) Show forest plot | 8 | 549 | Std. Mean Difference (IV, Random, 95% CI) | ‐0.38 [‐0.59, ‐0.16] |
| 2.1 Cognitive‐behavioural intervention only vs. no intervention | 6 | 439 | Std. Mean Difference (IV, Random, 95% CI) | ‐0.28 [‐0.47, ‐0.09] |
| 2.2 Cognitive‐behavioural intervention and relaxation vs. no intervention | 2 | 110 | Std. Mean Difference (IV, Random, 95% CI) | ‐0.78 [‐1.38, ‐0.18] |
| 3 Any Stress‐related Outcome (follow‐up more than 6 months) Show forest plot | 2 | 157 | Std. Mean Difference (IV, Fixed, 95% CI) | ‐1.04 [‐1.37, ‐0.70] |
| 3.1 Cognitive‐behavioural intervention with or without relaxation vs. no intervention | 2 | 157 | Std. Mean Difference (IV, Fixed, 95% CI) | ‐1.04 [‐1.37, ‐0.70] |
| 4 State‐Trait Anxiety Inventory (follow‐up up to 1 month) Show forest plot | 3 | Mean Difference (IV, Random, 95% CI) | Subtotals only | |
| 4.1 CBT and relaxation vs. no intervention State Anxiety | 3 | 135 | Mean Difference (IV, Random, 95% CI) | ‐11.07 [‐18.39, ‐3.75] |
| 4.2 CBT and relaxation vs. no intervention Trait Anxiety | 3 | 135 | Mean Difference (IV, Random, 95% CI) | ‐8.36 [‐10.02, ‐6.70] |
| 5 State‐Trait Anxiety Inventory (follow‐up 1 ‐ 6 months) Show forest plot | 1 | Mean Difference (IV, Fixed, 95% CI) | Totals not selected | |
| 5.1 CBT and relaxation vs. no intervention State Anxiety | 1 | Mean Difference (IV, Fixed, 95% CI) | 0.0 [0.0, 0.0] | |
| 5.2 CBT and relaxation vs. no intervention Trait Anxiety | 1 | Mean Difference (IV, Fixed, 95% CI) | 0.0 [0.0, 0.0] | |
| 6 General Health Questionnaire (follow‐up up to 1 month) Show forest plot | 1 | Mean Difference (IV, Fixed, 95% CI) | Totals not selected | |
| 6.1 CBT and relaxation vs. no intervention | 1 | Mean Difference (IV, Fixed, 95% CI) | 0.0 [0.0, 0.0] | |
| Outcome or subgroup title | No. of studies | No. of participants | Statistical method | Effect size |
| 1 Any stress scale (follow‐up 1 ‐ 6 months) Show forest plot | 2 | 83 | Std. Mean Difference (IV, Random, 95% CI) | ‐0.54 [‐1.16, 0.08] |
| 2 Any stress scale (follow‐up more than 6 months) Show forest plot | 1 | Std. Mean Difference (IV, Random, 95% CI) | Totals not selected | |
| 3 Anxiety (follow‐up 1 ‐ 6 months) Show forest plot | 1 | Mean Difference (IV, Fixed, 95% CI) | Totals not selected | |
| 3.1 CBT vs. passive support by a psychologist | 1 | Mean Difference (IV, Fixed, 95% CI) | 0.0 [0.0, 0.0] | |
| Outcome or subgroup title | No. of studies | No. of participants | Statistical method | Effect size |
| 1 Any stress outcome (follow‐up up to 1 month) Show forest plot | 4 | 97 | Std. Mean Difference (IV, Random, 95% CI) | ‐0.48 [‐0.89, ‐0.08] |
| 1.1 Physical relaxation (follow‐up up to 1 month) | 4 | 97 | Std. Mean Difference (IV, Random, 95% CI) | ‐0.48 [‐0.89, ‐0.08] |
| 2 Any stress outcome (follow‐up 1 ‐ 6 months) Show forest plot | 12 | 521 | Std. Mean Difference (IV, Random, 95% CI) | ‐0.49 [‐0.78, ‐0.21] |
| 2.1 Mental relaxation | 6 | 205 | Std. Mean Difference (IV, Random, 95% CI) | ‐0.50 [‐1.15, 0.15] |
| 2.2 Physical relaxation | 6 | 316 | Std. Mean Difference (IV, Random, 95% CI) | ‐0.47 [‐0.70, ‐0.24] |
| 3 Any stress outcome (follow‐up more than 6 months) Show forest plot | 1 | Std. Mean Difference (IV, Fixed, 95% CI) | Totals not selected | |
| 3.1 Mental relaxation | 1 | Std. Mean Difference (IV, Fixed, 95% CI) | 0.0 [0.0, 0.0] | |
| 4 State Anxiety (follow‐up 1 ‐ 6 months) Show forest plot | 1 | 66 | Mean Difference (IV, Fixed, 95% CI) | ‐7.79 [‐11.24, ‐4.34] |
| 4.1 Mental relaxation vs. no intervention | 1 | 33 | Mean Difference (IV, Fixed, 95% CI) | ‐8.74 [‐13.94, ‐3.54] |
| 4.2 Physical relaxation vs. no intervention | 1 | 33 | Mean Difference (IV, Fixed, 95% CI) | ‐7.04 [‐11.65, ‐2.43] |
| 5 Trait Anxiety (follow‐up 1 ‐ 6 months) Show forest plot | 1 | 66 | Mean Difference (IV, Fixed, 95% CI) | ‐1.09 [‐4.53, 2.36] |
| 5.1 Mental relaxation vs. no intervention | 1 | 33 | Mean Difference (IV, Fixed, 95% CI) | ‐2.41 [‐6.93, 2.11] |
| 5.2 Physical relaxation vs. no intervention | 1 | 33 | Mean Difference (IV, Fixed, 95% CI) | 0.75 [‐4.58, 6.08] |
| 6 General Health (follow‐up 1 ‐ 6 months) Show forest plot | 2 | Mean Difference (IV, Fixed, 95% CI) | Subtotals only | |
| 6.1 Mental relaxation vs. no intervention | 1 | 33 | Mean Difference (IV, Fixed, 95% CI) | ‐7.10 [‐11.39, ‐2.81] |
| 6.2 Physical relaxation vs. no intervention | 2 | 70 | Mean Difference (IV, Fixed, 95% CI) | ‐3.22 [‐6.53, 0.08] |
| Outcome or subgroup title | No. of studies | No. of participants | Statistical method | Effect size |
| 1 Any stress outcome Show forest plot | 4 | Std. Mean Difference (IV, Fixed, 95% CI) | Totals not selected | |
| 1.1 Mental relaxation training vs. training on theory analysis (follow‐up 1 ‐ 6 months) | 1 | Std. Mean Difference (IV, Fixed, 95% CI) | 0.0 [0.0, 0.0] | |
| 1.2 Mental relaxation vs. relaxing in a chair (follow‐up to 1 month) | 1 | Std. Mean Difference (IV, Fixed, 95% CI) | 0.0 [0.0, 0.0] | |
| 1.3 Physical relaxation vs. break (follow‐up to 1 month) | 2 | Std. Mean Difference (IV, Fixed, 95% CI) | 0.0 [0.0, 0.0] | |
| 2 Any anxiety outcome Show forest plot | 1 | Std. Mean Difference (IV, Random, 95% CI) | Totals not selected | |
| 2.1 AMMA touch therapy vs. touch therapy without intent (follow‐up to 1 month) | 1 | Std. Mean Difference (IV, Random, 95% CI) | 0.0 [0.0, 0.0] | |
| 3 General Health Questionnaire Show forest plot | 1 | Std. Mean Difference (IV, Fixed, 95% CI) | Totals not selected | |
| 3.1 Physical relaxation training vs. training on theory analysis (follow‐up 1 ‐ 6 months) | 1 | Std. Mean Difference (IV, Fixed, 95% CI) | 0.0 [0.0, 0.0] | |
| Outcome or subgroup title | No. of studies | No. of participants | Statistical method | Effect size |
| 1 Any stress‐related outcome (follow‐up up to 1 month) Show forest plot | 3 | Std. Mean Difference (IV, Fixed, 95% CI) | Totals not selected | |
| 1.1 Support | 1 | Std. Mean Difference (IV, Fixed, 95% CI) | 0.0 [0.0, 0.0] | |
| 1.2 Communication skills | 1 | Std. Mean Difference (IV, Fixed, 95% CI) | 0.0 [0.0, 0.0] | |
| 1.3 Special Care RCTs | 1 | Std. Mean Difference (IV, Fixed, 95% CI) | 0.0 [0.0, 0.0] | |
| 2 Any stress‐related outcome RCTs (follow‐up 1 ‐ 6 months) Show forest plot | 5 | Std. Mean Difference (IV, Fixed, 95% CI) | Subtotals only | |
| 2.1 Working conditions RCTs | 2 | 525 | Std. Mean Difference (IV, Fixed, 95% CI) | ‐0.12 [‐0.30, 0.05] |
| 2.2 Special Care RCTs | 1 | 71 | Std. Mean Difference (IV, Fixed, 95% CI) | ‐0.13 [‐0.60, 0.33] |
| 2.3 Support RCTs | 2 | 952 | Std. Mean Difference (IV, Fixed, 95% CI) | 0.07 [‐0.09, 0.23] |
| 3 Any stress‐related outcome (follow‐up more than 6 months) Show forest plot | 4 | Std. Mean Difference (IV, Fixed, 95% CI) | Totals not selected | |
| 3.1 Working conditions RCTs | 1 | Std. Mean Difference (IV, Fixed, 95% CI) | 0.0 [0.0, 0.0] | |
| 3.2 Working conditions CCTs | 1 | Std. Mean Difference (IV, Fixed, 95% CI) | 0.0 [0.0, 0.0] | |
| 3.3 Special Care RCTs | 1 | Std. Mean Difference (IV, Fixed, 95% CI) | 0.0 [0.0, 0.0] | |
| 3.4 Support RCTs | 1 | Std. Mean Difference (IV, Fixed, 95% CI) | 0.0 [0.0, 0.0] | |
| 4 The Short Form Health Survey (SF‐36) (follow‐up more than 6 months) Show forest plot | 1 | Mean Difference (IV, Fixed, 95% CI) | Totals not selected | |
| Outcome or subgroup title | No. of studies | No. of participants | Statistical method | Effect size |
| 1 Any stress‐related outcome (follow‐up up to 1 month) Show forest plot | 1 | Std. Mean Difference (IV, Fixed, 95% CI) | Totals not selected | |
| 1.1 Special care vs. usual training and support RCTs | 1 | Std. Mean Difference (IV, Fixed, 95% CI) | 0.0 [0.0, 0.0] | |
| 2 Any stress‐related outcome (follow‐up 1 ‐ 6 months) Show forest plot | 1 | Std. Mean Difference (IV, Fixed, 95% CI) | Totals not selected | |
| 2.1 Support vs. feedback only RCTs | 1 | Std. Mean Difference (IV, Fixed, 95% CI) | 0.0 [0.0, 0.0] | |
| 3 Any stress‐related outcome (follow‐up more than 6 months) Show forest plot | 2 | Std. Mean Difference (IV, Fixed, 95% CI) | Subtotals only | |
| 3.1 Shorter vs longer working schedules RCTs | 2 | 180 | Std. Mean Difference (IV, Fixed, 95% CI) | ‐0.55 [‐0.84, ‐0.25] |
| 4 General Health Questionnaire (total score) Show forest plot | 2 | Mean Difference (IV, Fixed, 95% CI) | Totals not selected | |
| 4.1 Support vs. feedback RCTs (follow‐up 1 ‐ 6 months) | 1 | Mean Difference (IV, Fixed, 95% CI) | 0.0 [0.0, 0.0] | |
| 4.2 Special care vs. general training RCTs (follow‐up more than 6 months) | 1 | Mean Difference (IV, Fixed, 95% CI) | 0.0 [0.0, 0.0] | |
| Outcome or subgroup title | No. of studies | No. of participants | Statistical method | Effect size |
| 1 Maslach Burnout Inventory (follow‐up up to 1 month) Show forest plot | 2 | Mean Difference (IV, Fixed, 95% CI) | Subtotals only | |
| 1.1 Emotional exhaustion | 2 | 158 | Mean Difference (IV, Fixed, 95% CI) | ‐2.01 [‐3.34, ‐0.68] |
| 1.2 Depersonalisation | 2 | 158 | Mean Difference (IV, Fixed, 95% CI) | ‐1.35 [‐2.33, ‐0.36] |
| 1.3 Personal accomplishment (lack of) | 2 | 158 | Mean Difference (IV, Fixed, 95% CI) | 0.16 [‐1.21, 1.54] |
| 2 Maslach Burnout Inventory (follow‐up 1 to 6 months) Show forest plot | 2 | Mean Difference (IV, Fixed, 95% CI) | Subtotals only | |
| 2.1 Emotional exhaustion | 2 | 128 | Mean Difference (IV, Fixed, 95% CI) | ‐2.13 [‐3.77, ‐0.49] |
| 2.2 Depersonalisation | 2 | 142 | Mean Difference (IV, Fixed, 95% CI) | ‐0.47 [‐1.53, 0.59] |
| 2.3 Personal accomplishment (lack of) | 2 | 143 | Mean Difference (IV, Fixed, 95% CI) | ‐0.62 [‐1.83, 0.59] |
| Outcome or subgroup title | No. of studies | No. of participants | Statistical method | Effect size |
| 1 Maslach Burnout Inventory (follow‐up up to 1 month) Show forest plot | 2 | Mean Difference (IV, Fixed, 95% CI) | Totals not selected | |
| 1.1 Emotional Exhaustion | 2 | Mean Difference (IV, Fixed, 95% CI) | 0.0 [0.0, 0.0] | |
| 1.2 Personal Accomplishment (lack of) | 2 | Mean Difference (IV, Fixed, 95% CI) | 0.0 [0.0, 0.0] | |
| Outcome or subgroup title | No. of studies | No. of participants | Statistical method | Effect size |
| 1 Maslach Burnout Inventory (follow‐up more than 6 months) Show forest plot | 1 | Mean Difference (IV, Fixed, 95% CI) | Totals not selected | |
| 1.1 Emotional Exhaustion | 1 | Mean Difference (IV, Fixed, 95% CI) | 0.0 [0.0, 0.0] | |
| 1.2 Depersonalisation | 1 | Mean Difference (IV, Fixed, 95% CI) | 0.0 [0.0, 0.0] | |
| 1.3 Personal Accomplishment (lack of) | 1 | Mean Difference (IV, Fixed, 95% CI) | 0.0 [0.0, 0.0] | |
| Outcome or subgroup title | No. of studies | No. of participants | Statistical method | Effect size |
| 1 Maslach Burnout Inventory (follow‐up 1 ‐ 6 months) Show forest plot | 4 | Mean Difference (IV, Random, 95% CI) | Subtotals only | |
| 1.1 Emotional Exhaustion | 4 | 137 | Mean Difference (IV, Random, 95% CI) | ‐1.06 [‐5.98, 3.87] |
| 1.2 Depersonalisation | 4 | 137 | Mean Difference (IV, Random, 95% CI) | ‐1.03 [‐2.70, 0.64] |
| 1.3 Personal Accomplishment (lack of) | 4 | 137 | Mean Difference (IV, Random, 95% CI) | 3.96 [0.70, 7.21] |
| Outcome or subgroup title | No. of studies | No. of participants | Statistical method | Effect size |
| 1 Maslach Burnout Inventory (follow‐up less than 1 month) Show forest plot | 1 | Std. Mean Difference (IV, Fixed, 95% CI) | Totals not selected | |
| 1.1 Emotional exhaustion | 1 | Std. Mean Difference (IV, Fixed, 95% CI) | 0.0 [0.0, 0.0] | |
| 1.2 Depersonalisation/ Disengagement | 1 | Std. Mean Difference (IV, Fixed, 95% CI) | 0.0 [0.0, 0.0] | |
| 1.3 Personal Accomplishment (lack of) | 1 | Std. Mean Difference (IV, Fixed, 95% CI) | 0.0 [0.0, 0.0] | |
| 2 Maslach Burnout Inventory (follow‐up 1 ‐ 6 months) Show forest plot | 2 | Std. Mean Difference (IV, Fixed, 95% CI) | Totals not selected | |
| 2.1 Emotional exhaustion | 2 | Std. Mean Difference (IV, Fixed, 95% CI) | 0.0 [0.0, 0.0] | |
| 2.2 Depersonalisation | 2 | Std. Mean Difference (IV, Fixed, 95% CI) | 0.0 [0.0, 0.0] | |
| 3 Maslach Burnout Inventory or Oldenburg Burnout Inventory (follow‐up more than 6 months) Show forest plot | 3 | Std. Mean Difference (IV, Fixed, 95% CI) | Subtotals only | |
| 3.1 Emotional exhaustion | 3 | 313 | Std. Mean Difference (IV, Fixed, 95% CI) | ‐0.27 [‐0.50, ‐0.04] |
| 3.2 Depersonalisation/ Disengagement | 3 | 313 | Std. Mean Difference (IV, Fixed, 95% CI) | ‐0.33 [‐0.56, ‐0.10] |
| 3.3 Personal Accomplishment (lack of) | 2 | 182 | Std. Mean Difference (IV, Fixed, 95% CI) | 0.08 [‐0.22, 0.38] |
| Outcome or subgroup title | No. of studies | No. of participants | Statistical method | Effect size |
| 1 Maslach Burnout Inventory (follow‐up 1 ‐ 6 months) Show forest plot | 1 | Mean Difference (IV, Fixed, 95% CI) | Totals not selected | |
| 1.1 Emotional Exhaustion | 1 | Mean Difference (IV, Fixed, 95% CI) | 0.0 [0.0, 0.0] | |
| 1.2 Depersonalisation | 1 | Mean Difference (IV, Fixed, 95% CI) | 0.0 [0.0, 0.0] | |
| 1.3 Personal Accomplishment (lack of) | 1 | Mean Difference (IV, Fixed, 95% CI) | 0.0 [0.0, 0.0] | |
| Outcome or subgroup title | No. of studies | No. of participants | Statistical method | Effect size |
| 1 Any Stress‐related Outcome (follow‐up up to 1 month) Show forest plot | 7 | 332 | Std. Mean Difference (IV, Random, 95% CI) | ‐0.27 [‐0.66, 0.13] |
| 1.1 Nurses | 1 | 36 | Std. Mean Difference (IV, Random, 95% CI) | ‐0.18 [‐0.84, 0.48] |
| 1.2 Physicians | 2 | 106 | Std. Mean Difference (IV, Random, 95% CI) | ‐0.59 [‐1.00, ‐0.18] |
| 1.3 All staff | 3 | 178 | Std. Mean Difference (IV, Random, 95% CI) | 0.11 [‐0.57, 0.80] |
| 1.4 Other professionals | 1 | 12 | Std. Mean Difference (IV, Random, 95% CI) | ‐1.20 [‐2.47, 0.08] |
| 2 Any Stress‐related Outcome (follow‐up 1 ‐ 6 months) Show forest plot | 8 | 549 | Std. Mean Difference (IV, Random, 95% CI) | ‐0.38 [‐0.59, ‐0.16] |
| 2.1 Nurses | 6 | 403 | Std. Mean Difference (IV, Random, 95% CI) | ‐0.34 [‐0.64, ‐0.04] |
| 2.2 All staff | 2 | 146 | Std. Mean Difference (IV, Random, 95% CI) | ‐0.48 [‐0.81, ‐0.15] |
| Outcome or subgroup title | No. of studies | No. of participants | Statistical method | Effect size |
| 1 Any stress outcome (follow‐up to 1 month) Show forest plot | 4 | 97 | Std. Mean Difference (IV, Fixed, 95% CI) | ‐0.48 [‐0.89, ‐0.08] |
| 1.1 Nurses | 2 | 43 | Std. Mean Difference (IV, Fixed, 95% CI) | ‐0.70 [‐1.32, ‐0.07] |
| 1.2 Physicians | 1 | 38 | Std. Mean Difference (IV, Fixed, 95% CI) | ‐0.18 [‐0.81, 0.46] |
| 1.3 Other Professionals | 1 | 16 | Std. Mean Difference (IV, Fixed, 95% CI) | ‐0.70 [‐1.71, 0.32] |
| 2 Any stress outcome (follow‐up 1 ‐ 6 months) Show forest plot | 12 | 521 | Std. Mean Difference (IV, Random, 95% CI) | ‐0.49 [‐0.78, ‐0.21] |
| 2.1 Nurses | 7 | 288 | Std. Mean Difference (IV, Random, 95% CI) | ‐0.59 [‐1.02, ‐0.16] |
| 2.2 Physicians | 0 | 0 | Std. Mean Difference (IV, Random, 95% CI) | 0.0 [0.0, 0.0] |
| 2.3 All Staff | 5 | 233 | Std. Mean Difference (IV, Random, 95% CI) | ‐0.36 [‐0.71, ‐0.01] |
| 2.4 Other Professionals | 0 | 0 | Std. Mean Difference (IV, Random, 95% CI) | 0.0 [0.0, 0.0] |