Preventing occupational stress in healthcare workers
Information
- DOI:
- https://doi.org/10.1002/14651858.CD002892.pub4Copy DOI

- Database:
-
- Cochrane Database of Systematic Reviews
- Version published:
-
- 08 December 2014see what's new
- Type:
-
- Intervention
- Stage:
-
- Review
- Cochrane Editorial Group:
-
Cochrane Work Group
- Copyright:
-
- Copyright © 2014 The Cochrane Collaboration. Published by John Wiley & Sons, Ltd.
Article metrics
Altmetric:
Cited by:
Authors
Contributions of authors
Jani Ruotsalainen, Albert Mariné, Jos Verbeek and Consol Serra screened the systematic search results for potential new studies to include. Jani Ruotsalainen, Albert Mariné, Consol Serra and Jos Verbeek extracted data from new included studies and also assessed the risk of bias of the previously included studies. Jani Ruotsalainen and Jos Verbeek rebuilt the comparisons and ran the analyses. Jos Verbeek and Jani Ruotsalainen wrote the first draft of the updated review text. All authors commented on the draft. Jani Ruotsalainen is the guarantor of the review.
Sources of support
Internal sources
-
Cochrane Occupational Safety and Health Review Group, Finland.
-
Finnish Institute of Occupational Health, Finland.
-
Corporació Parc Taulí (Sabadell), Spain.
-
Network of Centers for Research on Epidemiology and Public Health, Spain.
External sources
-
Ministry of Social Affairs and Health, Finland.
Declarations of interest
Jani Ruotsalainen: None known.
Jos Verbeek: None known.
Consol Serra: None known.
Albert Marine: None known.
Acknowledgements
We thank Merja Jauhiainen, at the time the Cochrane Occupational Health Field Trials Search Coordinator, for completely rebuilding the systematic searches to replace the ones run for the first published version of this review. We thank the Cochrane Occupational Safety and Health Review Group's Trials Search Co‐ordinator Leena Isotalo for conducting the many rounds of update searches. We thank Brian Lucas, Lone Donbæk Jensen, Ulla Peterson, Veron Schrijnemaekers, Andrea Martins, Ingalill Rahm Hallberg, Dirk von Dierendonck, Martyn Jones, Deborah McElligott, Michelle Rowe and Joanne Cohen‐Katz for providing further information about their studies and Albert Westergren for kindly facilitating contact with one of the authors. We thank Joan Martí and to Hugh McGuire for their support in identifying studies for this review. We thank Marjo Pulliainen for performing study selection on a study published in Finnish (Elo 2000). We thank Brian van Wyk and Victoria Pillay‐van Wyk for their work on their review titled Preventive staff‐support interventions for health workers (van Wyk 2010) that we merged with this review. We thank Johannes Siegrist, Diego Montano, Steven Pryjmachuk, Anneli Ojajärvi, Kaisa Neuvonen and Jukka Vuori for their valuable comments and Malcolm Sim for his worthy contribution as stand‐in Co‐ordinating Editor. Finally, we thank Kate Cahill for copy editing the text.
Version history
| Published | Title | Stage | Authors | Version |
| 2023 May 12 | Individual‐level interventions for reducing occupational stress in healthcare workers | Review | Sietske J Tamminga, Lima M Emal, Julitta S Boschman, Alice Levasseur, Anilkrishna Thota, Jani H Ruotsalainen, Roosmarijn MC Schelvis, Karen Nieuwenhuijsen, Henk F Molen | |
| 2015 Apr 07 | Preventing occupational stress in healthcare workers | Review | Jani H Ruotsalainen, Jos H Verbeek, Albert Mariné, Consol Serra | |
| 2014 Dec 08 | Preventing occupational stress in healthcare workers | Review | Jani H Ruotsalainen, Jos H Verbeek, Albert Mariné, Consol Serra | |
| 2014 Nov 13 | Preventing occupational stress in healthcare workers | Review | Jani H Ruotsalainen, Jos H Verbeek, Albert Mariné, Consol Serra | |
| 2006 Oct 18 | Preventing occupational stress in healthcare workers | Review | Albert Marine, Jani H Ruotsalainen, Consol Serra, Jos H Verbeek | |
| 2000 Apr 24 | Effectiveness of occupational stress management programmes | Protocol | M arine A, Consol CS Serra, Albert Marine | |
Differences between protocol and review
In the previous version of this review (Marine 2006) we categorised interventions as person‐ and work‐directed. We think the new categorisation into cognitive‐behavioural, mental and physical relaxation and organisational interventions is more informative.
Notes
The title of this review has changed from Effectiveness of occupational stress management programmes to Preventing occupational stress in healthcare workers. The review entitled Preventive staff‐support interventions for health workers by Brian van Wyk and Victoria Pillay‐van Wyk has been merged with this review and therefore will not be updated separately.
Keywords
MeSH
Medical Subject Headings (MeSH) Keywords
Medical Subject Headings Check Words
Humans;
PICOs
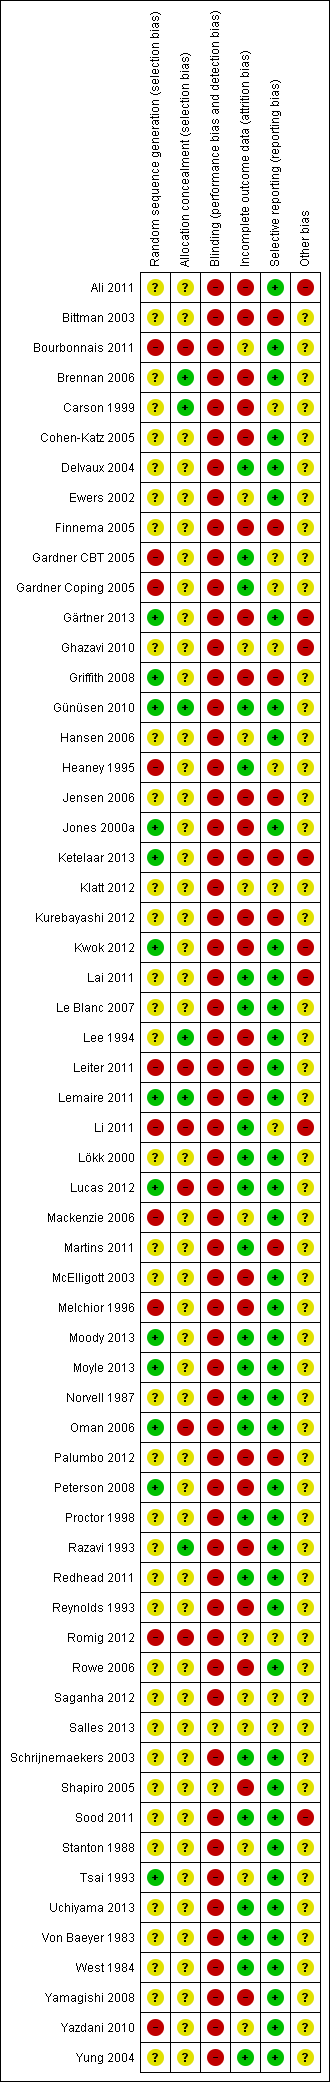
Risk of bias summary: review authors' judgements about each risk of bias item for each included study.

Funnel plot of comparison: 1 Cognitive‐behavioural intervention vs no Intervention (SMD), outcome: 1.1 Any Stress‐related Outcome (follow‐up up to 1 month).

Funnel plot of comparison: 1 Cognitive‐behavioural intervention vs no Intervention (SMD), outcome: 1.2 Any Stress‐related Outcome (follow‐up 1 ‐ 6 months).

Funnel plot of comparison: 3 Relaxation vs. no intervention (SMD), outcome: 3.2 Any stress outcome (follow‐up 1 ‐ 6 months).

Comparison 1 Cognitive‐behavioural intervention vs no Intervention (SMD), Outcome 1 Any Stress‐related Outcome (follow‐up up to 1 month).
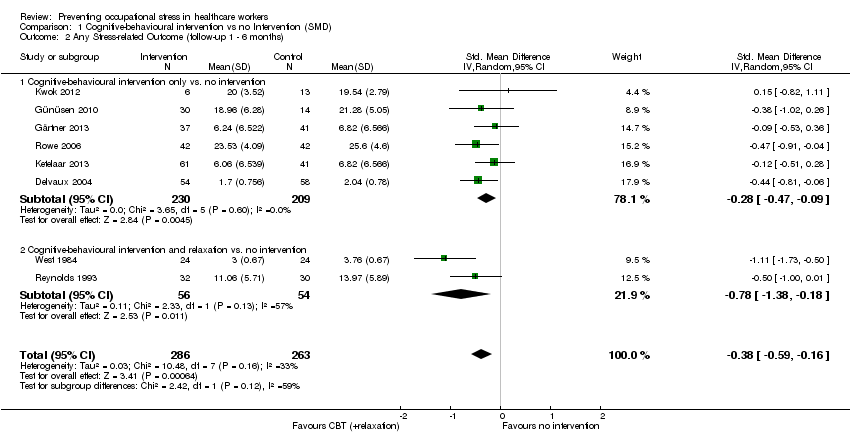
Comparison 1 Cognitive‐behavioural intervention vs no Intervention (SMD), Outcome 2 Any Stress‐related Outcome (follow‐up 1 ‐ 6 months).

Comparison 1 Cognitive‐behavioural intervention vs no Intervention (SMD), Outcome 3 Any Stress‐related Outcome (follow‐up more than 6 months).
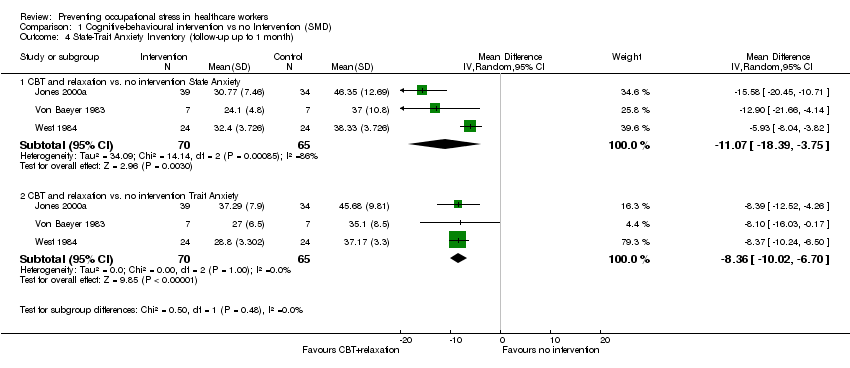
Comparison 1 Cognitive‐behavioural intervention vs no Intervention (SMD), Outcome 4 State‐Trait Anxiety Inventory (follow‐up up to 1 month).

Comparison 1 Cognitive‐behavioural intervention vs no Intervention (SMD), Outcome 5 State‐Trait Anxiety Inventory (follow‐up 1 ‐ 6 months).

Comparison 1 Cognitive‐behavioural intervention vs no Intervention (SMD), Outcome 6 General Health Questionnaire (follow‐up up to 1 month).

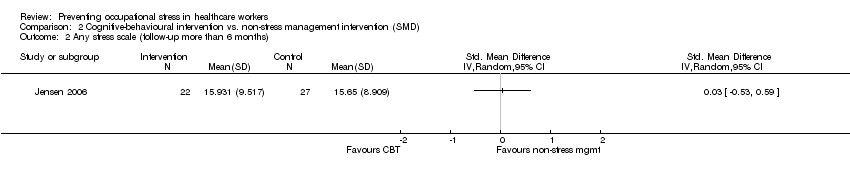
Comparison 2 Cognitive‐behavioural intervention vs. non‐stress management intervention (SMD), Outcome 1 Any stress scale (follow‐up 1 ‐ 6 months).
Comparison 2 Cognitive‐behavioural intervention vs. non‐stress management intervention (SMD), Outcome 2 Any stress scale (follow‐up more than 6 months).

Comparison 2 Cognitive‐behavioural intervention vs. non‐stress management intervention (SMD), Outcome 3 Anxiety (follow‐up 1 ‐ 6 months).

Comparison 3 Relaxation vs. no intervention (SMD), Outcome 1 Any stress outcome (follow‐up up to 1 month).
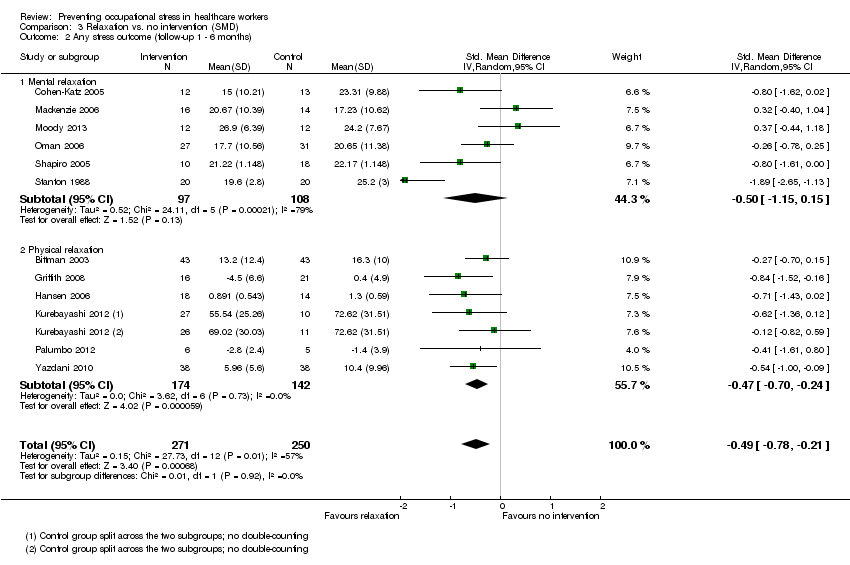
Comparison 3 Relaxation vs. no intervention (SMD), Outcome 2 Any stress outcome (follow‐up 1 ‐ 6 months).

Comparison 3 Relaxation vs. no intervention (SMD), Outcome 3 Any stress outcome (follow‐up more than 6 months).
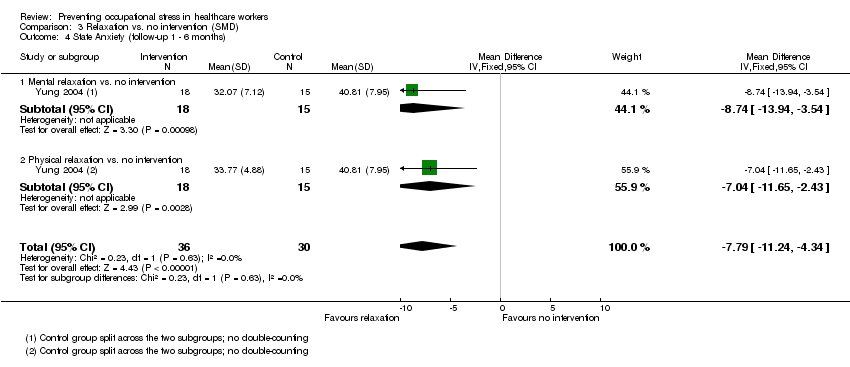
Comparison 3 Relaxation vs. no intervention (SMD), Outcome 4 State Anxiety (follow‐up 1 ‐ 6 months).

Comparison 3 Relaxation vs. no intervention (SMD), Outcome 5 Trait Anxiety (follow‐up 1 ‐ 6 months).

Comparison 3 Relaxation vs. no intervention (SMD), Outcome 6 General Health (follow‐up 1 ‐ 6 months).

Comparison 4 Relaxation vs. other intervention (SMD), Outcome 1 Any stress outcome.

Comparison 4 Relaxation vs. other intervention (SMD), Outcome 2 Any anxiety outcome.
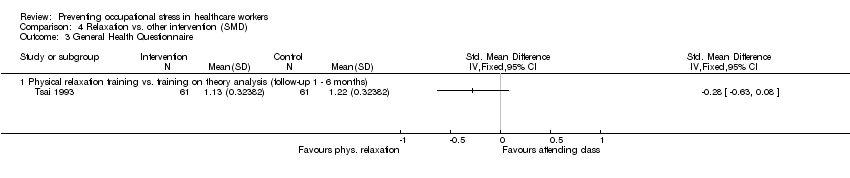
Comparison 4 Relaxation vs. other intervention (SMD), Outcome 3 General Health Questionnaire.

Comparison 5 Organisational intervention vs. no intervention (SMD), Outcome 1 Any stress‐related outcome (follow‐up up to 1 month).
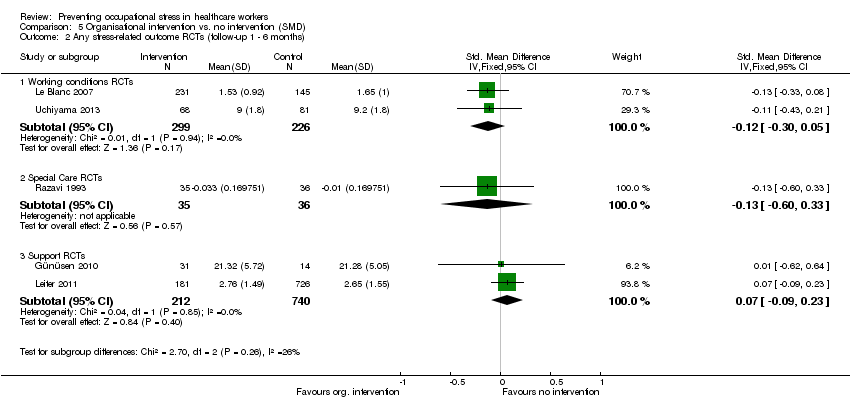
Comparison 5 Organisational intervention vs. no intervention (SMD), Outcome 2 Any stress‐related outcome RCTs (follow‐up 1 ‐ 6 months).
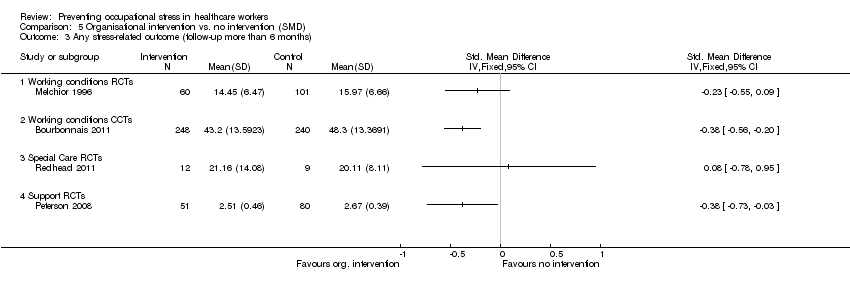
Comparison 5 Organisational intervention vs. no intervention (SMD), Outcome 3 Any stress‐related outcome (follow‐up more than 6 months).

Comparison 5 Organisational intervention vs. no intervention (SMD), Outcome 4 General Health Questionnaire total score (follow‐up more than 6 months).

Comparison 6 Organisational intervention vs. other intervention (SMD), Outcome 1 Any stress‐related outcome (follow‐up up to 1 month).
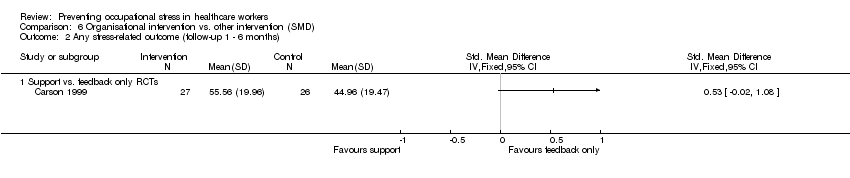
Comparison 6 Organisational intervention vs. other intervention (SMD), Outcome 2 Any stress‐related outcome (follow‐up 1 ‐ 6 months).

Comparison 6 Organisational intervention vs. other intervention (SMD), Outcome 3 Any stress‐related outcome (follow‐up more than 6 months).
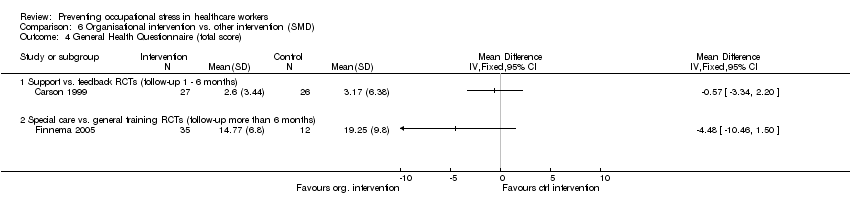
Comparison 6 Organisational intervention vs. other intervention (SMD), Outcome 4 General Health Questionnaire (total score).
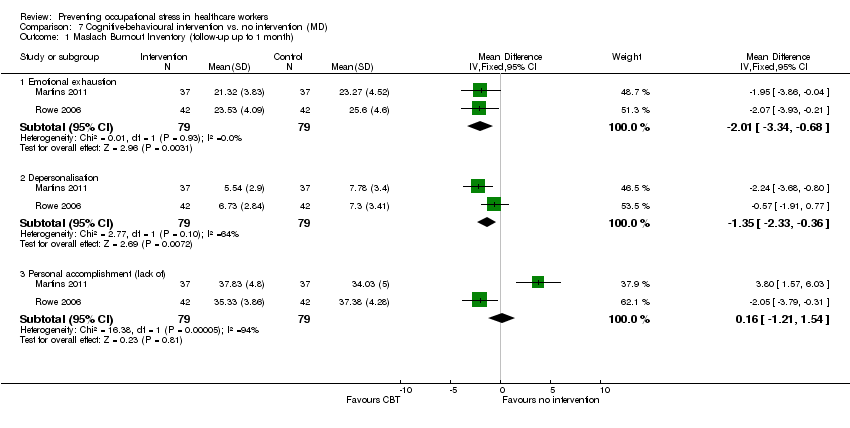
Comparison 7 Cognitive‐behavioural intervention vs. no intervention (MD), Outcome 1 Maslach Burnout Inventory (follow‐up up to 1 month).
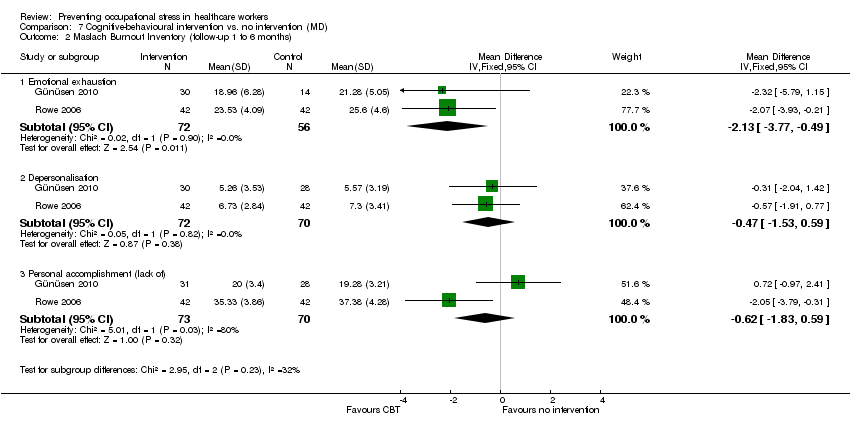
Comparison 7 Cognitive‐behavioural intervention vs. no intervention (MD), Outcome 2 Maslach Burnout Inventory (follow‐up 1 to 6 months).
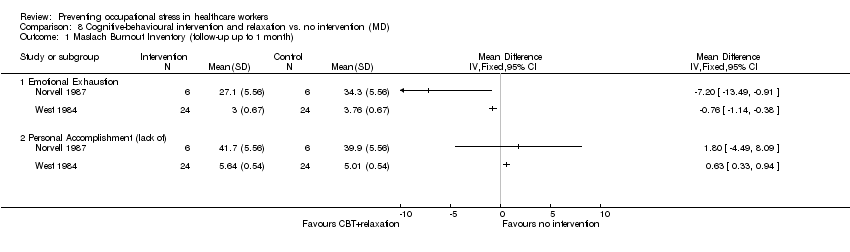
Comparison 8 Cognitive‐behavioural intervention and relaxation vs. no intervention (MD), Outcome 1 Maslach Burnout Inventory (follow‐up up to 1 month).

Comparison 9 Cognitive‐behavioural intervention vs. other intervention (MD), Outcome 1 Maslach Burnout Inventory (follow‐up more than 6 months).
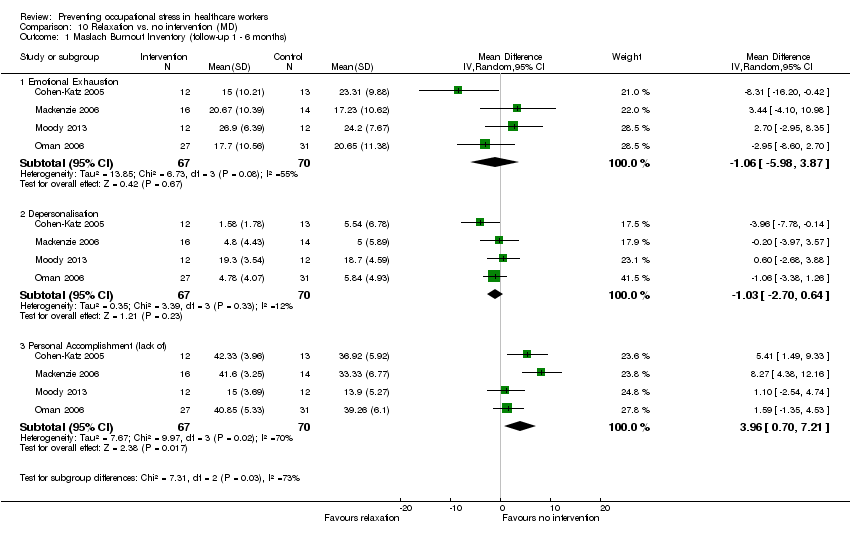
Comparison 10 Relaxation vs. no intervention (MD), Outcome 1 Maslach Burnout Inventory (follow‐up 1 ‐ 6 months).

Comparison 11 Organisational intervention vs. no intervention (MD), Outcome 1 Maslach Burnout Inventory (follow‐up less than 1 month).

Comparison 11 Organisational intervention vs. no intervention (MD), Outcome 2 Maslach Burnout Inventory (follow‐up 1 ‐ 6 months).
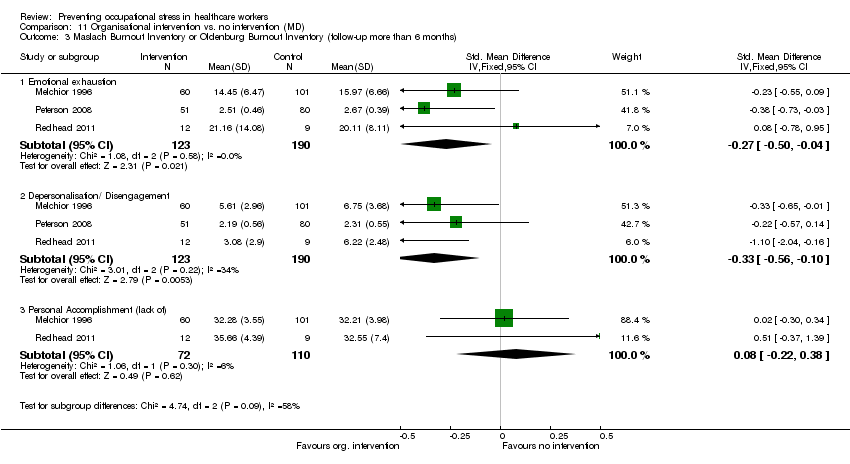
Comparison 11 Organisational intervention vs. no intervention (MD), Outcome 3 Maslach Burnout Inventory or Oldenburg Burnout Inventory (follow‐up more than 6 months).

Comparison 12 Organisational intervention vs. other intervention (MD), Outcome 1 Maslach Burnout Inventory (follow‐up 1 ‐ 6 months).
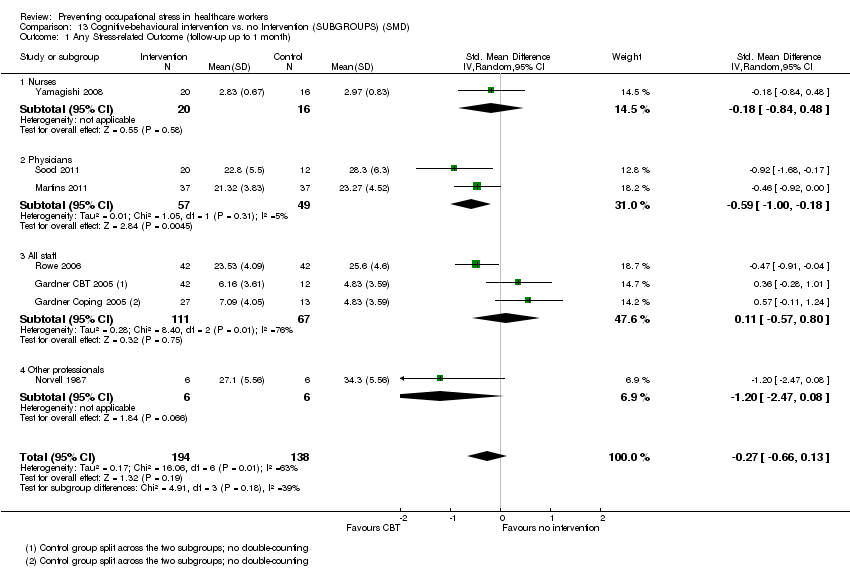
Comparison 13 Cognitive‐behavioural intervention vs. no Intervention (SUBGROUPS) (SMD), Outcome 1 Any Stress‐related Outcome (follow‐up up to 1 month).
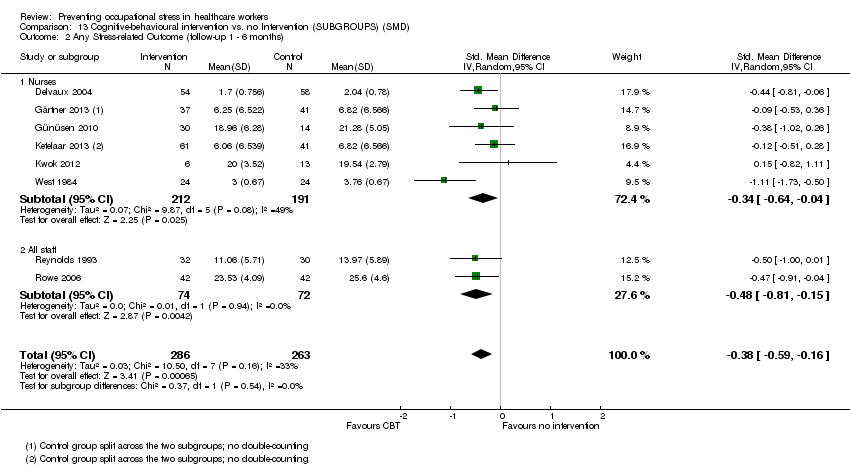
Comparison 13 Cognitive‐behavioural intervention vs. no Intervention (SUBGROUPS) (SMD), Outcome 2 Any Stress‐related Outcome (follow‐up 1 ‐ 6 months).
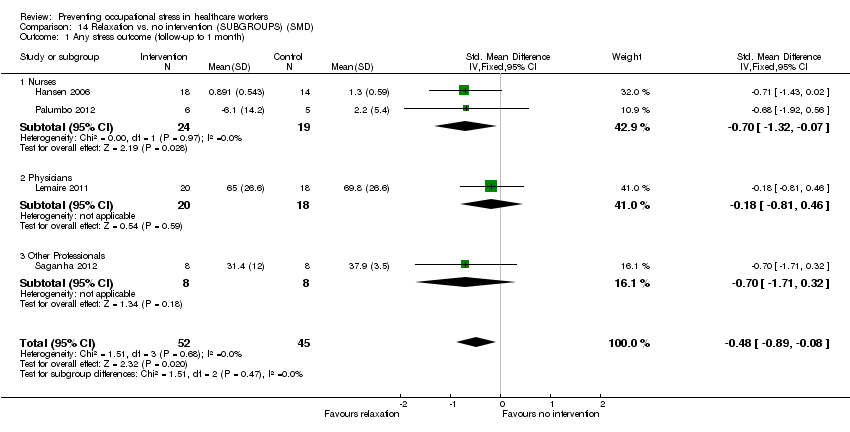
Comparison 14 Relaxation vs. no intervention (SUBGROUPS) (SMD), Outcome 1 Any stress outcome (follow‐up to 1 month).
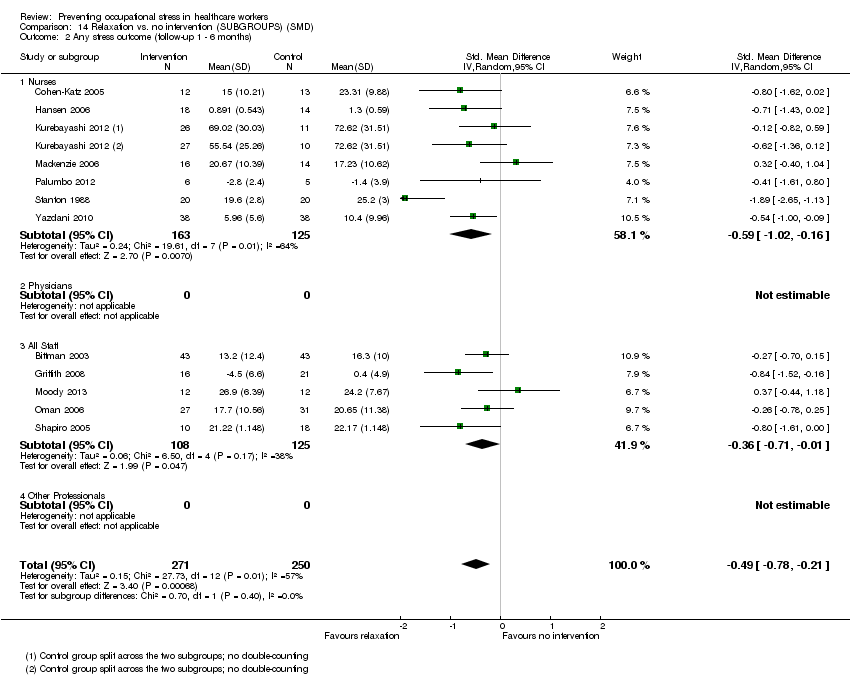
Comparison 14 Relaxation vs. no intervention (SUBGROUPS) (SMD), Outcome 2 Any stress outcome (follow‐up 1 ‐ 6 months).
| Cognitive‐behavioural intervention compared to no Intervention for reducing stress | ||||||
| Patient or population: Healthcare workers | ||||||
| Outcomes | Illustrative comparative risks* (95% CI) | Relative effect | No of Participants | Quality of the evidence | Comments | |
| Assumed risk | Corresponding risk | |||||
| No Intervention | Cognitive‐behavioural intervention | |||||
| Stress 1 Month | The median stress level across all control groups across all follow‐up times was 24.33 points on the Emotional Exhaustion subscale of the Maslach Burnout Inventory¹ | The mean stress level at 1 month in the intervention groups was 1.22 points lower (2.98 lower to 0.59 higher). | SMD ‐0.27 (‐0.66 to 0.13) | 332 | ⊕⊕⊝⊝ | This meta‐analysis was back transformed to the EE subscale of the MBI by using the median SD of the EE scale across control groups. |
| Stress 1 ‐ 6 months | The median stress level across all control groups across all follow‐up times was 24.33 points on the Emotional Exhaustion subscale of the Maslach Burnout Inventory¹ | The mean stress at 1 ‐ 6 months in the intervention groups was 1.83 points lower (0.77 to 2.85 lower). | SMD ‐0.38 (‐0.59 to ‐0.16) | 549 | ⊕⊕⊝⊝ low²,³ | This meta‐analysis was back transformed to the EE subscale of the MBI by using the median SD of the EE scale across control groups. |
| Stress > 6 months | The median stress level across all control groups across all follow‐up times was 24.33 points on the Emotional Exhaustion subscale of the Maslach Burnout Inventory¹ | The mean stress at more than 6 months in the intervention groups was 11.34 points lower (4.47 to 14.94 lower) | SMD ‐1.04 (‐1.37 to ‐0.70) | 157 | ⊕⊕⊝⊝ low²,³ | This meta‐analysis was back transformed to the EE subscale of the MBI by using the median SD of the EE scale across control groups. |
| *The basis for the assumed risk (e.g. the median control group risk across studies) is provided in footnotes. The corresponding risk (and its 95% confidence interval) is based on the assumed risk in the comparison group and the relative effect of the intervention (and its 95% CI). | ||||||
| GRADE Working Group grades of evidence | ||||||
| 1 This was the median from the control groups of all studies that measured the effect of CBT vs. no intervention on Emotional Exhaustion with the same scale. | ||||||
| Relaxation compared to no intervention (SMD) for | ||||||
| Patient or population: Healthcare workers | ||||||
| Outcomes | Illustrative comparative risks* (95% CI) | Relative effect | No of Participants | Quality of the evidence | Comments | |
| Assumed risk | Corresponding risk | |||||
| no intervention (SMD) | Relaxation | |||||
| Stress 1 month | The median stress level across all control groups across all follow‐up times was 22.17 points on the Emotional Exhaustion subscale of the Maslach Burnout Inventory¹ | The mean stress at 1 month in the intervention groups was 2.14 points lower (0.36 to 3.96 lower). | SMD ‐0.48 (‐0.89 to ‐0.08) | 97 | ⊕⊕⊝⊝ low | This meta‐analysis was back transformed to the EE subscale of the MBI by using the median SD of the EE scale across control groups. |
| Stress 1 ‐ 6 months | The median stress level across all control groups across all follow‐up times was 22.17 points on the Emotional Exhaustion subscale of the Maslach Burnout Inventory¹ | The mean stress at 1 ‐ 6 months in the intervention groups was 4.84 points lower (2.37 to 6.92 lower). | SMD ‐0.49 (‐0.78 to ‐0.21) | 521 | ⊕⊕⊕⊝ moderate | This meta‐analysis was back transformed to the EE subscale of the MBI by using the median SD of the EE scale across control groups. |
| Stress > 6 months | The median stress level across all control groups across all follow‐up times was 22.17 points on the Emotional Exhaustion subscale of the Maslach Burnout Inventory¹ | The mean stress at > 6 months in the intervention groups was 5.67 points lower (3.39 to 7.95 lower). | SMD ‐1.89 (‐2.65 to ‐1.13) | 40 | ⊕⊕⊝⊝ low | This result was back transformed to the EE subscale of the MBI by using the median SD of the EE scale across control groups. |
| *The basis for the assumed risk (e.g. the median control group risk across studies) is provided in footnotes. The corresponding risk (and its 95% confidence interval) is based on the assumed risk in the comparison group and the relative effect of the intervention (and its 95% CI). | ||||||
| GRADE Working Group grades of evidence | ||||||
| 1 This was the median from the control groups of all studies that measured the effect of relaxation vs. no intervention on Emotional Exhaustion with the same scale. | ||||||
| Comparison | Risk of Bias | Inconsistency | Indirectness | Imprecision | Publication Bias | Level of Evidence |
| CBT vs no intervention 1 mo follow‐up | 5 out of 6 studies high risk of bias: 1 level down | I² = 64%: no downgrading | No | 332 participants No downgrading | Yes in funnel plot: 1 level down | Low Quality |
| CBT vs no intervention 1 ‐ 6 mo follow‐up | 5 out of 8 studies high risk of bias: 1 level down | I² = 54%: no downgrading | No | 549 participants No downgrading | Yes in funnel plot: 1 level down | Low Quality |
| CBT vs no intervention > 6 months follow‐up | 2 studies high risk of bias: 1 level down | I² = 38%: no downgrading | No | 157 participants 1 level down | Not apparent | Low Quality |
| Relaxation vs no intervention 1 mo follow‐up | 3 out 4 studies high risk of bias: 1 level down | I² = 0%: no downgrading | No | 97 participants 1 level down | Not apparent | Low Quality |
| Relaxation vs no intervention 1 ‐ 6 mo follow‐up | 10 out of 13 studies high risk of bias: 1 level down | I² = 57%: no downgrading | No | 521 participants no downgrading | Not apparent | Moderate Quality |
| Relaxation vs no intervention > 6 mo follow‐up | 1 study: no downgrading | N/A | No | 40 participants 2 levels down | Not apparent | Low Quality |
| Outcome or subgroup title | No. of studies | No. of participants | Statistical method | Effect size |
| 1 Any Stress‐related Outcome (follow‐up up to 1 month) Show forest plot | 7 | 332 | Std. Mean Difference (IV, Random, 95% CI) | ‐0.27 [‐0.66, 0.13] |
| 1.1 Cognitive‐behavioural intervention only vs. no intervention | 4 | 248 | Std. Mean Difference (IV, Random, 95% CI) | ‐0.25 [‐0.60, 0.11] |
| 1.2 Cognitive‐behavioural intervention and relaxation vs. no intervention | 3 | 84 | Std. Mean Difference (IV, Random, 95% CI) | ‐0.45 [‐1.61, 0.70] |
| 2 Any Stress‐related Outcome (follow‐up 1 ‐ 6 months) Show forest plot | 8 | 549 | Std. Mean Difference (IV, Random, 95% CI) | ‐0.38 [‐0.59, ‐0.16] |
| 2.1 Cognitive‐behavioural intervention only vs. no intervention | 6 | 439 | Std. Mean Difference (IV, Random, 95% CI) | ‐0.28 [‐0.47, ‐0.09] |
| 2.2 Cognitive‐behavioural intervention and relaxation vs. no intervention | 2 | 110 | Std. Mean Difference (IV, Random, 95% CI) | ‐0.78 [‐1.38, ‐0.18] |
| 3 Any Stress‐related Outcome (follow‐up more than 6 months) Show forest plot | 2 | 157 | Std. Mean Difference (IV, Fixed, 95% CI) | ‐1.04 [‐1.37, ‐0.70] |
| 3.1 Cognitive‐behavioural intervention with or without relaxation vs. no intervention | 2 | 157 | Std. Mean Difference (IV, Fixed, 95% CI) | ‐1.04 [‐1.37, ‐0.70] |
| 4 State‐Trait Anxiety Inventory (follow‐up up to 1 month) Show forest plot | 3 | Mean Difference (IV, Random, 95% CI) | Subtotals only | |
| 4.1 CBT and relaxation vs. no intervention State Anxiety | 3 | 135 | Mean Difference (IV, Random, 95% CI) | ‐11.07 [‐18.39, ‐3.75] |
| 4.2 CBT and relaxation vs. no intervention Trait Anxiety | 3 | 135 | Mean Difference (IV, Random, 95% CI) | ‐8.36 [‐10.02, ‐6.70] |
| 5 State‐Trait Anxiety Inventory (follow‐up 1 ‐ 6 months) Show forest plot | 1 | Mean Difference (IV, Fixed, 95% CI) | Totals not selected | |
| 5.1 CBT and relaxation vs. no intervention State Anxiety | 1 | Mean Difference (IV, Fixed, 95% CI) | 0.0 [0.0, 0.0] | |
| 5.2 CBT and relaxation vs. no intervention Trait Anxiety | 1 | Mean Difference (IV, Fixed, 95% CI) | 0.0 [0.0, 0.0] | |
| 6 General Health Questionnaire (follow‐up up to 1 month) Show forest plot | 1 | Mean Difference (IV, Fixed, 95% CI) | Totals not selected | |
| 6.1 CBT and relaxation vs. no intervention | 1 | Mean Difference (IV, Fixed, 95% CI) | 0.0 [0.0, 0.0] | |
| Outcome or subgroup title | No. of studies | No. of participants | Statistical method | Effect size |
| 1 Any stress scale (follow‐up 1 ‐ 6 months) Show forest plot | 2 | 83 | Std. Mean Difference (IV, Random, 95% CI) | ‐0.54 [‐1.16, 0.08] |
| 2 Any stress scale (follow‐up more than 6 months) Show forest plot | 1 | Std. Mean Difference (IV, Random, 95% CI) | Totals not selected | |
| 3 Anxiety (follow‐up 1 ‐ 6 months) Show forest plot | 1 | Mean Difference (IV, Fixed, 95% CI) | Totals not selected | |
| 3.1 CBT vs. passive support by a psychologist | 1 | Mean Difference (IV, Fixed, 95% CI) | 0.0 [0.0, 0.0] | |
| Outcome or subgroup title | No. of studies | No. of participants | Statistical method | Effect size |
| 1 Any stress outcome (follow‐up up to 1 month) Show forest plot | 4 | 97 | Std. Mean Difference (IV, Random, 95% CI) | ‐0.48 [‐0.89, ‐0.08] |
| 1.1 Physical relaxation (follow‐up up to 1 month) | 4 | 97 | Std. Mean Difference (IV, Random, 95% CI) | ‐0.48 [‐0.89, ‐0.08] |
| 2 Any stress outcome (follow‐up 1 ‐ 6 months) Show forest plot | 12 | 521 | Std. Mean Difference (IV, Random, 95% CI) | ‐0.49 [‐0.78, ‐0.21] |
| 2.1 Mental relaxation | 6 | 205 | Std. Mean Difference (IV, Random, 95% CI) | ‐0.50 [‐1.15, 0.15] |
| 2.2 Physical relaxation | 6 | 316 | Std. Mean Difference (IV, Random, 95% CI) | ‐0.47 [‐0.70, ‐0.24] |
| 3 Any stress outcome (follow‐up more than 6 months) Show forest plot | 1 | Std. Mean Difference (IV, Fixed, 95% CI) | Totals not selected | |
| 3.1 Mental relaxation | 1 | Std. Mean Difference (IV, Fixed, 95% CI) | 0.0 [0.0, 0.0] | |
| 4 State Anxiety (follow‐up 1 ‐ 6 months) Show forest plot | 1 | 66 | Mean Difference (IV, Fixed, 95% CI) | ‐7.79 [‐11.24, ‐4.34] |
| 4.1 Mental relaxation vs. no intervention | 1 | 33 | Mean Difference (IV, Fixed, 95% CI) | ‐8.74 [‐13.94, ‐3.54] |
| 4.2 Physical relaxation vs. no intervention | 1 | 33 | Mean Difference (IV, Fixed, 95% CI) | ‐7.04 [‐11.65, ‐2.43] |
| 5 Trait Anxiety (follow‐up 1 ‐ 6 months) Show forest plot | 1 | 66 | Mean Difference (IV, Fixed, 95% CI) | ‐1.09 [‐4.53, 2.36] |
| 5.1 Mental relaxation vs. no intervention | 1 | 33 | Mean Difference (IV, Fixed, 95% CI) | ‐2.41 [‐6.93, 2.11] |
| 5.2 Physical relaxation vs. no intervention | 1 | 33 | Mean Difference (IV, Fixed, 95% CI) | 0.75 [‐4.58, 6.08] |
| 6 General Health (follow‐up 1 ‐ 6 months) Show forest plot | 2 | Mean Difference (IV, Fixed, 95% CI) | Subtotals only | |
| 6.1 Mental relaxation vs. no intervention | 1 | 33 | Mean Difference (IV, Fixed, 95% CI) | ‐7.10 [‐11.39, ‐2.81] |
| 6.2 Physical relaxation vs. no intervention | 2 | 70 | Mean Difference (IV, Fixed, 95% CI) | ‐3.22 [‐6.53, 0.08] |
| Outcome or subgroup title | No. of studies | No. of participants | Statistical method | Effect size |
| 1 Any stress outcome Show forest plot | 4 | Std. Mean Difference (IV, Fixed, 95% CI) | Totals not selected | |
| 1.1 Mental relaxation training vs. training on theory analysis (follow‐up 1 ‐ 6 months) | 1 | Std. Mean Difference (IV, Fixed, 95% CI) | 0.0 [0.0, 0.0] | |
| 1.2 Mental relaxation vs. relaxing in a chair (follow‐up to 1 month) | 1 | Std. Mean Difference (IV, Fixed, 95% CI) | 0.0 [0.0, 0.0] | |
| 1.3 Physical relaxation vs. break (follow‐up to 1 month) | 2 | Std. Mean Difference (IV, Fixed, 95% CI) | 0.0 [0.0, 0.0] | |
| 2 Any anxiety outcome Show forest plot | 1 | Std. Mean Difference (IV, Random, 95% CI) | Totals not selected | |
| 2.1 AMMA touch therapy vs. touch therapy without intent (follow‐up to 1 month) | 1 | Std. Mean Difference (IV, Random, 95% CI) | 0.0 [0.0, 0.0] | |
| 3 General Health Questionnaire Show forest plot | 1 | Std. Mean Difference (IV, Fixed, 95% CI) | Totals not selected | |
| 3.1 Physical relaxation training vs. training on theory analysis (follow‐up 1 ‐ 6 months) | 1 | Std. Mean Difference (IV, Fixed, 95% CI) | 0.0 [0.0, 0.0] | |
| Outcome or subgroup title | No. of studies | No. of participants | Statistical method | Effect size |
| 1 Any stress‐related outcome (follow‐up up to 1 month) Show forest plot | 3 | Std. Mean Difference (IV, Fixed, 95% CI) | Totals not selected | |
| 1.1 Support | 1 | Std. Mean Difference (IV, Fixed, 95% CI) | 0.0 [0.0, 0.0] | |
| 1.2 Communication skills | 1 | Std. Mean Difference (IV, Fixed, 95% CI) | 0.0 [0.0, 0.0] | |
| 1.3 Special Care RCTs | 1 | Std. Mean Difference (IV, Fixed, 95% CI) | 0.0 [0.0, 0.0] | |
| 2 Any stress‐related outcome RCTs (follow‐up 1 ‐ 6 months) Show forest plot | 5 | Std. Mean Difference (IV, Fixed, 95% CI) | Subtotals only | |
| 2.1 Working conditions RCTs | 2 | 525 | Std. Mean Difference (IV, Fixed, 95% CI) | ‐0.12 [‐0.30, 0.05] |
| 2.2 Special Care RCTs | 1 | 71 | Std. Mean Difference (IV, Fixed, 95% CI) | ‐0.13 [‐0.60, 0.33] |
| 2.3 Support RCTs | 2 | 952 | Std. Mean Difference (IV, Fixed, 95% CI) | 0.07 [‐0.09, 0.23] |
| 3 Any stress‐related outcome (follow‐up more than 6 months) Show forest plot | 4 | Std. Mean Difference (IV, Fixed, 95% CI) | Totals not selected | |
| 3.1 Working conditions RCTs | 1 | Std. Mean Difference (IV, Fixed, 95% CI) | 0.0 [0.0, 0.0] | |
| 3.2 Working conditions CCTs | 1 | Std. Mean Difference (IV, Fixed, 95% CI) | 0.0 [0.0, 0.0] | |
| 3.3 Special Care RCTs | 1 | Std. Mean Difference (IV, Fixed, 95% CI) | 0.0 [0.0, 0.0] | |
| 3.4 Support RCTs | 1 | Std. Mean Difference (IV, Fixed, 95% CI) | 0.0 [0.0, 0.0] | |
| 4 General Health Questionnaire total score (follow‐up more than 6 months) Show forest plot | 1 | Mean Difference (IV, Fixed, 95% CI) | Totals not selected | |
| Outcome or subgroup title | No. of studies | No. of participants | Statistical method | Effect size |
| 1 Any stress‐related outcome (follow‐up up to 1 month) Show forest plot | 1 | Std. Mean Difference (IV, Fixed, 95% CI) | Totals not selected | |
| 1.1 Special care vs. usual training and support RCTs | 1 | Std. Mean Difference (IV, Fixed, 95% CI) | 0.0 [0.0, 0.0] | |
| 2 Any stress‐related outcome (follow‐up 1 ‐ 6 months) Show forest plot | 1 | Std. Mean Difference (IV, Fixed, 95% CI) | Totals not selected | |
| 2.1 Support vs. feedback only RCTs | 1 | Std. Mean Difference (IV, Fixed, 95% CI) | 0.0 [0.0, 0.0] | |
| 3 Any stress‐related outcome (follow‐up more than 6 months) Show forest plot | 2 | Std. Mean Difference (IV, Fixed, 95% CI) | Subtotals only | |
| 3.1 Shorter vs longer working schedules RCTs | 2 | 180 | Std. Mean Difference (IV, Fixed, 95% CI) | ‐0.55 [‐0.84, ‐0.25] |
| 4 General Health Questionnaire (total score) Show forest plot | 2 | Mean Difference (IV, Fixed, 95% CI) | Totals not selected | |
| 4.1 Support vs. feedback RCTs (follow‐up 1 ‐ 6 months) | 1 | Mean Difference (IV, Fixed, 95% CI) | 0.0 [0.0, 0.0] | |
| 4.2 Special care vs. general training RCTs (follow‐up more than 6 months) | 1 | Mean Difference (IV, Fixed, 95% CI) | 0.0 [0.0, 0.0] | |
| Outcome or subgroup title | No. of studies | No. of participants | Statistical method | Effect size |
| 1 Maslach Burnout Inventory (follow‐up up to 1 month) Show forest plot | 2 | Mean Difference (IV, Fixed, 95% CI) | Subtotals only | |
| 1.1 Emotional exhaustion | 2 | 158 | Mean Difference (IV, Fixed, 95% CI) | ‐2.01 [‐3.34, ‐0.68] |
| 1.2 Depersonalisation | 2 | 158 | Mean Difference (IV, Fixed, 95% CI) | ‐1.35 [‐2.33, ‐0.36] |
| 1.3 Personal accomplishment (lack of) | 2 | 158 | Mean Difference (IV, Fixed, 95% CI) | 0.16 [‐1.21, 1.54] |
| 2 Maslach Burnout Inventory (follow‐up 1 to 6 months) Show forest plot | 2 | Mean Difference (IV, Fixed, 95% CI) | Subtotals only | |
| 2.1 Emotional exhaustion | 2 | 128 | Mean Difference (IV, Fixed, 95% CI) | ‐2.13 [‐3.77, ‐0.49] |
| 2.2 Depersonalisation | 2 | 142 | Mean Difference (IV, Fixed, 95% CI) | ‐0.47 [‐1.53, 0.59] |
| 2.3 Personal accomplishment (lack of) | 2 | 143 | Mean Difference (IV, Fixed, 95% CI) | ‐0.62 [‐1.83, 0.59] |
| Outcome or subgroup title | No. of studies | No. of participants | Statistical method | Effect size |
| 1 Maslach Burnout Inventory (follow‐up up to 1 month) Show forest plot | 2 | Mean Difference (IV, Fixed, 95% CI) | Totals not selected | |
| 1.1 Emotional Exhaustion | 2 | Mean Difference (IV, Fixed, 95% CI) | 0.0 [0.0, 0.0] | |
| 1.2 Personal Accomplishment (lack of) | 2 | Mean Difference (IV, Fixed, 95% CI) | 0.0 [0.0, 0.0] | |
| Outcome or subgroup title | No. of studies | No. of participants | Statistical method | Effect size |
| 1 Maslach Burnout Inventory (follow‐up more than 6 months) Show forest plot | 1 | Mean Difference (IV, Fixed, 95% CI) | Totals not selected | |
| 1.1 Emotional Exhaustion | 1 | Mean Difference (IV, Fixed, 95% CI) | 0.0 [0.0, 0.0] | |
| 1.2 Depersonalisation | 1 | Mean Difference (IV, Fixed, 95% CI) | 0.0 [0.0, 0.0] | |
| 1.3 Personal Accomplishment (lack of) | 1 | Mean Difference (IV, Fixed, 95% CI) | 0.0 [0.0, 0.0] | |
| Outcome or subgroup title | No. of studies | No. of participants | Statistical method | Effect size |
| 1 Maslach Burnout Inventory (follow‐up 1 ‐ 6 months) Show forest plot | 4 | Mean Difference (IV, Random, 95% CI) | Subtotals only | |
| 1.1 Emotional Exhaustion | 4 | 137 | Mean Difference (IV, Random, 95% CI) | ‐1.06 [‐5.98, 3.87] |
| 1.2 Depersonalisation | 4 | 137 | Mean Difference (IV, Random, 95% CI) | ‐1.03 [‐2.70, 0.64] |
| 1.3 Personal Accomplishment (lack of) | 4 | 137 | Mean Difference (IV, Random, 95% CI) | 3.96 [0.70, 7.21] |
| Outcome or subgroup title | No. of studies | No. of participants | Statistical method | Effect size |
| 1 Maslach Burnout Inventory (follow‐up less than 1 month) Show forest plot | 1 | Std. Mean Difference (IV, Fixed, 95% CI) | Totals not selected | |
| 1.1 Emotional exhaustion | 1 | Std. Mean Difference (IV, Fixed, 95% CI) | 0.0 [0.0, 0.0] | |
| 1.2 Depersonalisation/ Disengagement | 1 | Std. Mean Difference (IV, Fixed, 95% CI) | 0.0 [0.0, 0.0] | |
| 1.3 Personal Accomplishment (lack of) | 1 | Std. Mean Difference (IV, Fixed, 95% CI) | 0.0 [0.0, 0.0] | |
| 2 Maslach Burnout Inventory (follow‐up 1 ‐ 6 months) Show forest plot | 2 | Std. Mean Difference (IV, Fixed, 95% CI) | Totals not selected | |
| 2.1 Emotional exhaustion | 2 | Std. Mean Difference (IV, Fixed, 95% CI) | 0.0 [0.0, 0.0] | |
| 2.2 Depersonalisation | 2 | Std. Mean Difference (IV, Fixed, 95% CI) | 0.0 [0.0, 0.0] | |
| 3 Maslach Burnout Inventory or Oldenburg Burnout Inventory (follow‐up more than 6 months) Show forest plot | 3 | Std. Mean Difference (IV, Fixed, 95% CI) | Subtotals only | |
| 3.1 Emotional exhaustion | 3 | 313 | Std. Mean Difference (IV, Fixed, 95% CI) | ‐0.27 [‐0.50, ‐0.04] |
| 3.2 Depersonalisation/ Disengagement | 3 | 313 | Std. Mean Difference (IV, Fixed, 95% CI) | ‐0.33 [‐0.56, ‐0.10] |
| 3.3 Personal Accomplishment (lack of) | 2 | 182 | Std. Mean Difference (IV, Fixed, 95% CI) | 0.08 [‐0.22, 0.38] |
| Outcome or subgroup title | No. of studies | No. of participants | Statistical method | Effect size |
| 1 Maslach Burnout Inventory (follow‐up 1 ‐ 6 months) Show forest plot | 1 | Mean Difference (IV, Fixed, 95% CI) | Totals not selected | |
| 1.1 Emotional Exhaustion | 1 | Mean Difference (IV, Fixed, 95% CI) | 0.0 [0.0, 0.0] | |
| 1.2 Depersonalisation | 1 | Mean Difference (IV, Fixed, 95% CI) | 0.0 [0.0, 0.0] | |
| 1.3 Personal Accomplishment (lack of) | 1 | Mean Difference (IV, Fixed, 95% CI) | 0.0 [0.0, 0.0] | |
| Outcome or subgroup title | No. of studies | No. of participants | Statistical method | Effect size |
| 1 Any Stress‐related Outcome (follow‐up up to 1 month) Show forest plot | 7 | 332 | Std. Mean Difference (IV, Random, 95% CI) | ‐0.27 [‐0.66, 0.13] |
| 1.1 Nurses | 1 | 36 | Std. Mean Difference (IV, Random, 95% CI) | ‐0.18 [‐0.84, 0.48] |
| 1.2 Physicians | 2 | 106 | Std. Mean Difference (IV, Random, 95% CI) | ‐0.59 [‐1.00, ‐0.18] |
| 1.3 All staff | 3 | 178 | Std. Mean Difference (IV, Random, 95% CI) | 0.11 [‐0.57, 0.80] |
| 1.4 Other professionals | 1 | 12 | Std. Mean Difference (IV, Random, 95% CI) | ‐1.20 [‐2.47, 0.08] |
| 2 Any Stress‐related Outcome (follow‐up 1 ‐ 6 months) Show forest plot | 8 | 549 | Std. Mean Difference (IV, Random, 95% CI) | ‐0.38 [‐0.59, ‐0.16] |
| 2.1 Nurses | 6 | 403 | Std. Mean Difference (IV, Random, 95% CI) | ‐0.34 [‐0.64, ‐0.04] |
| 2.2 All staff | 2 | 146 | Std. Mean Difference (IV, Random, 95% CI) | ‐0.48 [‐0.81, ‐0.15] |
| Outcome or subgroup title | No. of studies | No. of participants | Statistical method | Effect size |
| 1 Any stress outcome (follow‐up to 1 month) Show forest plot | 4 | 97 | Std. Mean Difference (IV, Fixed, 95% CI) | ‐0.48 [‐0.89, ‐0.08] |
| 1.1 Nurses | 2 | 43 | Std. Mean Difference (IV, Fixed, 95% CI) | ‐0.70 [‐1.32, ‐0.07] |
| 1.2 Physicians | 1 | 38 | Std. Mean Difference (IV, Fixed, 95% CI) | ‐0.18 [‐0.81, 0.46] |
| 1.3 Other Professionals | 1 | 16 | Std. Mean Difference (IV, Fixed, 95% CI) | ‐0.70 [‐1.71, 0.32] |
| 2 Any stress outcome (follow‐up 1 ‐ 6 months) Show forest plot | 12 | 521 | Std. Mean Difference (IV, Random, 95% CI) | ‐0.49 [‐0.78, ‐0.21] |
| 2.1 Nurses | 7 | 288 | Std. Mean Difference (IV, Random, 95% CI) | ‐0.59 [‐1.02, ‐0.16] |
| 2.2 Physicians | 0 | 0 | Std. Mean Difference (IV, Random, 95% CI) | 0.0 [0.0, 0.0] |
| 2.3 All Staff | 5 | 233 | Std. Mean Difference (IV, Random, 95% CI) | ‐0.36 [‐0.71, ‐0.01] |
| 2.4 Other Professionals | 0 | 0 | Std. Mean Difference (IV, Random, 95% CI) | 0.0 [0.0, 0.0] |