| 1 Lung function ‐ chest physiotherapy including directed cough Show forest plot | 3 | | Std. Mean Difference (IV, Fixed, 95% CI) | Subtotals only |
|
| 1.1 FEV1 | 3 | 118 | Std. Mean Difference (IV, Fixed, 95% CI) | ‐0.05 [‐0.41, 0.31] |
| 1.2 FVC | 3 | 118 | Std. Mean Difference (IV, Fixed, 95% CI) | 0.02 [‐0.35, 0.38] |
| 1.3 FEF25‐75 | 3 | 118 | Std. Mean Difference (IV, Fixed, 95% CI) | ‐0.03 [‐0.39, 0.33] |
| 2 Lung function ‐ chest physiotherapy including PEP Show forest plot | 3 | | Std. Mean Difference (IV, Fixed, 95% CI) | Subtotals only |
|
| 2.1 FEV1 | 3 | 118 | Std. Mean Difference (IV, Fixed, 95% CI) | ‐0.06 [‐0.43, 0.30] |
| 2.2 FVC | 3 | 118 | Std. Mean Difference (IV, Fixed, 95% CI) | ‐0.01 [‐0.37, 0.35] |
| 2.3 FEF25‐75 | 3 | 118 | Std. Mean Difference (IV, Fixed, 95% CI) | ‐0.00 [‐0.36, 0.36] |
| 3 Respiratory muscle strength Show forest plot | 1 | | Mean Difference (IV, Fixed, 95% CI) | Totals not selected |
|
| 3.1 PImax | 1 | | Mean Difference (IV, Fixed, 95% CI) | 0.0 [0.0, 0.0] |
| 3.2 PEmax | 1 | | Mean Difference (IV, Fixed, 95% CI) | 0.0 [0.0, 0.0] |
| 4 Airway resistance % predicted Show forest plot | 1 | | Mean Difference (IV, Fixed, 95% CI) | Subtotals only |
|
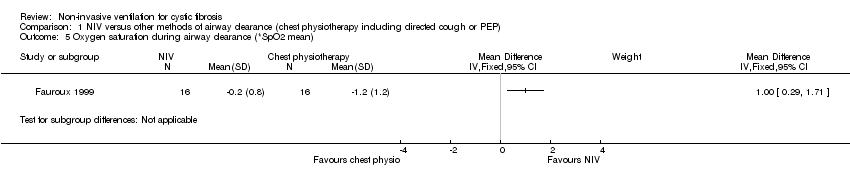
| 5 Oxygen saturation during airway clearance (*SpO2 mean) Show forest plot | 1 | | Mean Difference (IV, Fixed, 95% CI) | Subtotals only |
|
| 6 Oxygen saturation during airway clearance (change in SpO2 during treatment) Show forest plot | 1 | | Mean Difference (IV, Fixed, 95% CI) | Subtotals only |
|
| 7 Oxygen saturation after airway clearance (SpO2) ‐ chest physiotherapy including directed cough Show forest plot | 1 | | Mean Difference (IV, Fixed, 95% CI) | Subtotals only |
|
| 8 Oxygen saturation after airway clearance (SpO2) ‐ chest physiotherapy including PEP Show forest plot | 1 | | Mean Difference (IV, Fixed, 95% CI) | Subtotals only |
|
| 9 Sputum wet weight ‐ chest physiotherapy including directed cough Show forest plot | 3 | 118 | Mean Difference (IV, Fixed, 95% CI) | ‐0.69 [‐3.06, 1.67] |
|
| 10 Sputum wet weight ‐ chest physiotherapy including PEP Show forest plot | 3 | 118 | Mean Difference (IV, Fixed, 95% CI) | ‐1.54 [‐3.96, 0.89] |
|
| 11 Sputum dry weight ‐ chest physiotherapy including directed cough Show forest plot | 1 | | Mean Difference (IV, Fixed, 95% CI) | Subtotals only |
|
| 12 Sputum dry weight ‐ chest physiotherapy including PEP Show forest plot | 1 | | Mean Difference (IV, Fixed, 95% CI) | Subtotals only |
|
| 13 Breathlessness Show forest plot | 1 | | Mean Difference (IV, Fixed, 95% CI) | Subtotals only |
|