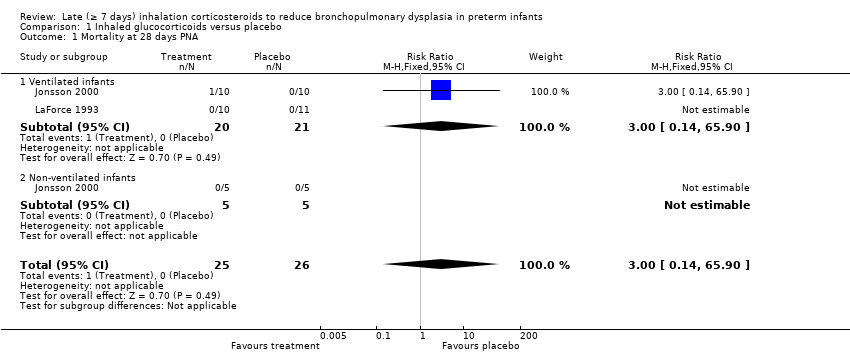
| 1 Mortality at 28 days PNA Show forest plot | 2 | 51 | Risk Ratio (M‐H, Fixed, 95% CI) | 3.0 [0.14, 65.90] |
|
| 1.1 Ventilated infants | 2 | 41 | Risk Ratio (M‐H, Fixed, 95% CI) | 3.0 [0.14, 65.90] |
| 1.2 Non‐ventilated infants | 1 | 10 | Risk Ratio (M‐H, Fixed, 95% CI) | 0.0 [0.0, 0.0] |
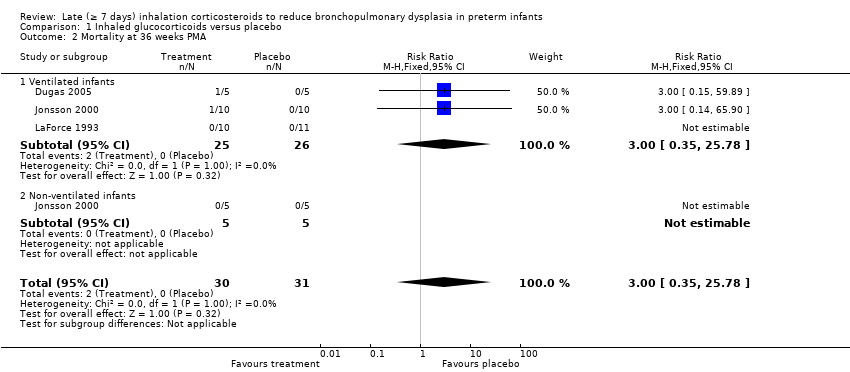
| 2 Mortality at 36 weeks PMA Show forest plot | 3 | 61 | Risk Ratio (M‐H, Fixed, 95% CI) | 3.0 [0.35, 25.78] |
|
| 2.1 Ventilated infants | 3 | 51 | Risk Ratio (M‐H, Fixed, 95% CI) | 3.0 [0.35, 25.78] |
| 2.2 Non‐ventilated infants | 1 | 10 | Risk Ratio (M‐H, Fixed, 95% CI) | 0.0 [0.0, 0.0] |
| 3 Mortality at hospital discharge Show forest plot | 3 | 53 | Risk Ratio (M‐H, Fixed, 95% CI) | 3.0 [0.35, 25.78] |
|
| 3.1 Ventilated infants | 3 | 43 | Risk Ratio (M‐H, Fixed, 95% CI) | 3.0 [0.35, 25.78] |
| 3.2 Non‐ventilated infants | 1 | 10 | Risk Ratio (M‐H, Fixed, 95% CI) | 0.0 [0.0, 0.0] |
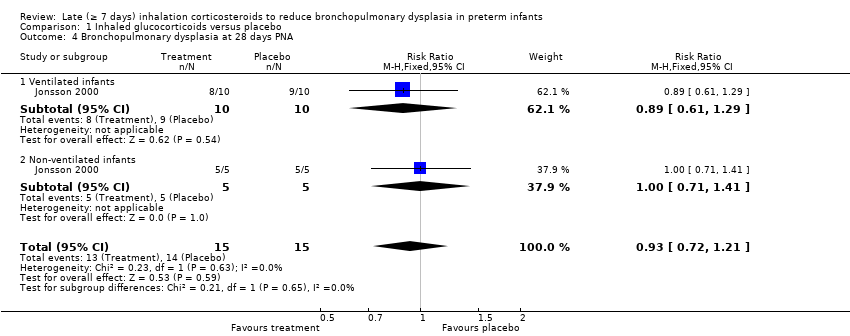
| 4 Bronchopulmonary dysplasia at 28 days PNA Show forest plot | 1 | 30 | Risk Ratio (M‐H, Fixed, 95% CI) | 0.93 [0.72, 1.21] |
|
| 4.1 Ventilated infants | 1 | 20 | Risk Ratio (M‐H, Fixed, 95% CI) | 0.89 [0.61, 1.29] |
| 4.2 Non‐ventilated infants | 1 | 10 | Risk Ratio (M‐H, Fixed, 95% CI) | 1.0 [0.71, 1.41] |
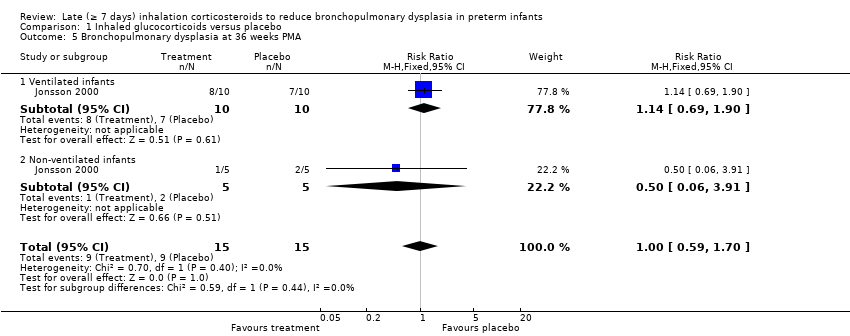
| 5 Bronchopulmonary dysplasia at 36 weeks PMA Show forest plot | 1 | 30 | Risk Ratio (M‐H, Fixed, 95% CI) | 1.0 [0.59, 1.70] |
|
| 5.1 Ventilated infants | 1 | 20 | Risk Ratio (M‐H, Fixed, 95% CI) | 1.14 [0.69, 1.90] |
| 5.2 Non‐ventilated infants | 1 | 10 | Risk Ratio (M‐H, Fixed, 95% CI) | 0.5 [0.06, 3.91] |
| 6 Combined outcome mortality and bronchopulmonary dysplasia at 28 days PNA Show forest plot | 1 | 30 | Risk Ratio (M‐H, Fixed, 95% CI) | 1.0 [0.85, 1.18] |
|
| 6.1 Ventilated infants | 1 | 20 | Risk Ratio (M‐H, Fixed, 95% CI) | 1.0 [0.83, 1.20] |
| 6.2 Non‐ventilated infants | 1 | 10 | Risk Ratio (M‐H, Fixed, 95% CI) | 1.0 [0.71, 1.41] |
| 7 Combined outcome mortality or bronchopulmonary dysplasia at 36 weeks PMA Show forest plot | 1 | 30 | Risk Ratio (M‐H, Fixed, 95% CI) | 1.10 [0.74, 1.63] |
|
| 7.1 Ventilated infants | 1 | 20 | Risk Ratio (M‐H, Fixed, 95% CI) | 1.24 [0.87, 1.75] |
| 7.2 Non‐ventilated infants | 1 | 10 | Risk Ratio (M‐H, Fixed, 95% CI) | 0.5 [0.06, 3.91] |
| 8 Failure to extubate day 7 Show forest plot | 5 | 79 | Risk Ratio (M‐H, Random, 95% CI) | 0.85 [0.62, 1.18] |
|
| 9 Failure to extubate day 14 Show forest plot | 2 | 27 | Risk Ratio (M‐H, Fixed, 95% CI) | 0.36 [0.10, 1.33] |
|
| 10 Failure to extubate at the latest reported moment Show forest plot | 6 | 90 | Risk Ratio (M‐H, Random, 95% CI) | 0.57 [0.27, 1.20] |
|
| 11 Days of mechanical ventilation Show forest plot | 3 | 45 | Mean Difference (IV, Random, 95% CI) | 2.79 [‐3.47, 9.06] |
|
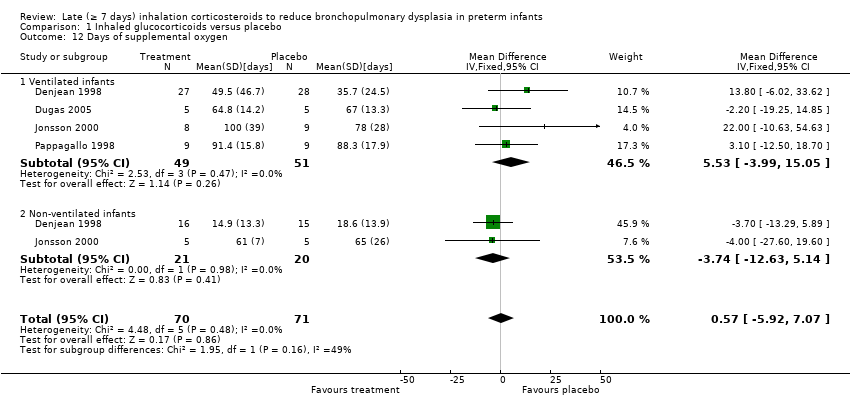
| 12 Days of supplemental oxygen Show forest plot | 4 | 141 | Mean Difference (IV, Fixed, 95% CI) | 0.57 [‐5.92, 7.07] |
|
| 12.1 Ventilated infants | 4 | 100 | Mean Difference (IV, Fixed, 95% CI) | 5.53 [‐3.99, 15.05] |
| 12.2 Non‐ventilated infants | 2 | 41 | Mean Difference (IV, Fixed, 95% CI) | ‐3.74 [‐12.63, 5.14] |
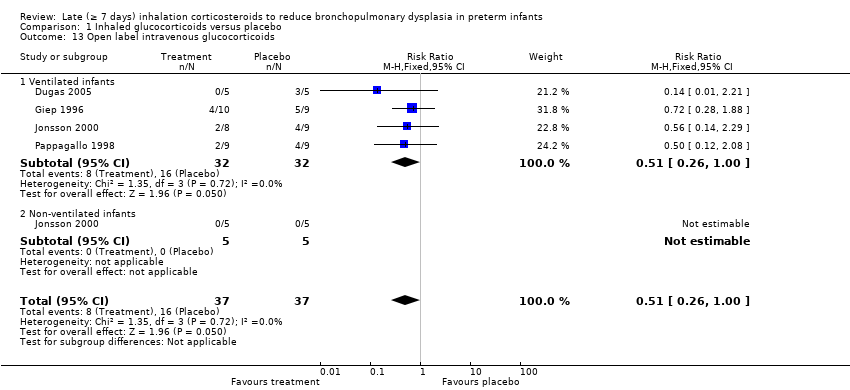
| 13 Open label intravenous glucocorticoids Show forest plot | 4 | 74 | Risk Ratio (M‐H, Fixed, 95% CI) | 0.51 [0.26, 1.00] |
|
| 13.1 Ventilated infants | 4 | 64 | Risk Ratio (M‐H, Fixed, 95% CI) | 0.51 [0.26, 1.00] |
| 13.2 Non‐ventilated infants | 1 | 10 | Risk Ratio (M‐H, Fixed, 95% CI) | 0.0 [0.0, 0.0] |
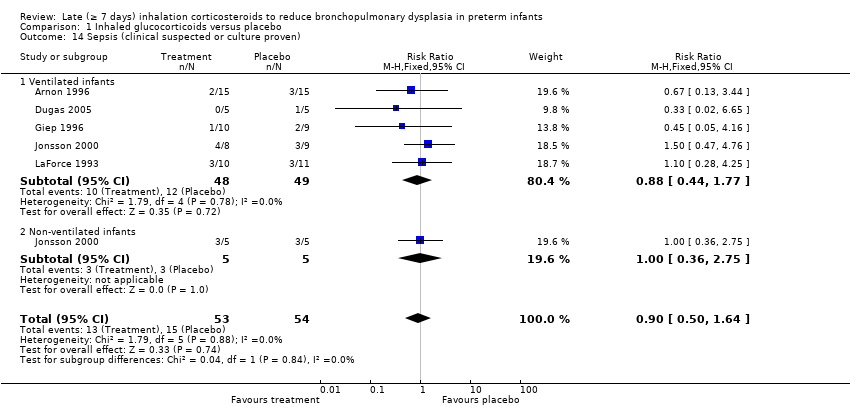
| 14 Sepsis (clinical suspected or culture proven) Show forest plot | 5 | 107 | Risk Ratio (M‐H, Fixed, 95% CI) | 0.90 [0.50, 1.64] |
|
| 14.1 Ventilated infants | 5 | 97 | Risk Ratio (M‐H, Fixed, 95% CI) | 0.88 [0.44, 1.77] |
| 14.2 Non‐ventilated infants | 1 | 10 | Risk Ratio (M‐H, Fixed, 95% CI) | 1.0 [0.36, 2.75] |
| 15 Persistent ductus arteriosus Show forest plot | 1 | 30 | Risk Ratio (M‐H, Fixed, 95% CI) | 1.0 [0.16, 6.20] |
|
| 15.1 Ventilated infants | 1 | 30 | Risk Ratio (M‐H, Fixed, 95% CI) | 1.0 [0.16, 6.20] |
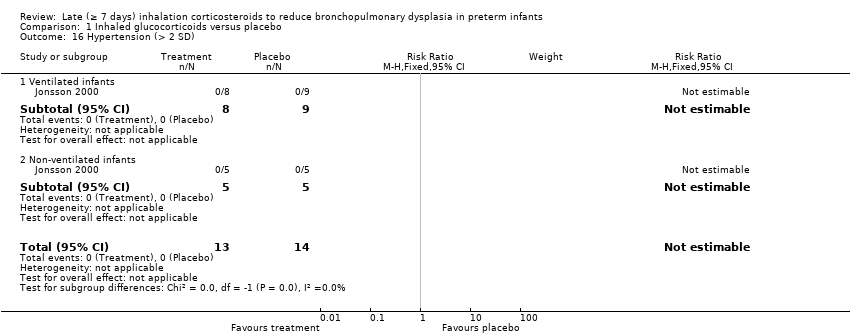
| 16 Hypertension (> 2 SD) Show forest plot | 1 | 27 | Risk Ratio (M‐H, Fixed, 95% CI) | 0.0 [0.0, 0.0] |
|
| 16.1 Ventilated infants | 1 | 17 | Risk Ratio (M‐H, Fixed, 95% CI) | 0.0 [0.0, 0.0] |
| 16.2 Non‐ventilated infants | 1 | 10 | Risk Ratio (M‐H, Fixed, 95% CI) | 0.0 [0.0, 0.0] |
| 17 Necrotising enterocolitis Show forest plot | 1 | 27 | Risk Ratio (M‐H, Fixed, 95% CI) | 0.0 [0.0, 0.0] |
|
| 17.1 Ventilated infants | 1 | 17 | Risk Ratio (M‐H, Fixed, 95% CI) | 0.0 [0.0, 0.0] |
| 17.2 Non‐ventilated infants | 1 | 10 | Risk Ratio (M‐H, Fixed, 95% CI) | 0.0 [0.0, 0.0] |
| 18 Intraventricular haemorrhage (any grade) Show forest plot | 1 | 19 | Risk Ratio (M‐H, Fixed, 95% CI) | 0.6 [0.13, 2.82] |
|
| 18.1 Ventilated infants | 1 | 19 | Risk Ratio (M‐H, Fixed, 95% CI) | 0.6 [0.13, 2.82] |
| 19 Days of hospitalisation Show forest plot | 1 | 18 | Mean Difference (IV, Fixed, 95% CI) | ‐24.70 [‐41.75, ‐7.65] |
|
| 19.1 Ventilated infants | 1 | 18 | Mean Difference (IV, Fixed, 95% CI) | ‐24.70 [‐41.75, ‐7.65] |