Scolaris Content Display Scolaris Content Display

Methodological quality graph: review authors' judgements about each methodological quality item presented as percentages across all included studies.
Figures and Tables -
Figure 1

Methodological quality graph: review authors' judgements about each methodological quality item presented as percentages across all included studies.

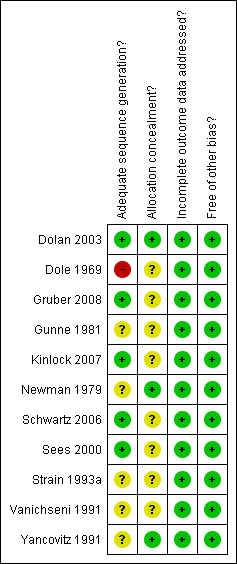
Methodological quality summary: review authors' judgements about each methodological quality item for each included study.
Figures and Tables -
Figure 2

Methodological quality summary: review authors' judgements about each methodological quality item for each included study.

Comparison 1 Methadone maintenance treatment vs No methadone maintenance treatment, Outcome 1 Retention in treatment.
Figures and Tables -
Analysis 1.1

Comparison 1 Methadone maintenance treatment vs No methadone maintenance treatment, Outcome 1 Retention in treatment.

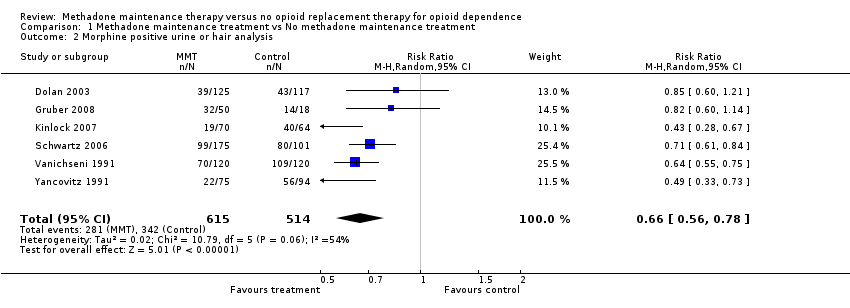
Comparison 1 Methadone maintenance treatment vs No methadone maintenance treatment, Outcome 2 Morphine positive urine or hair analysis.
Figures and Tables -
Analysis 1.2

Comparison 1 Methadone maintenance treatment vs No methadone maintenance treatment, Outcome 2 Morphine positive urine or hair analysis.

Comparison 1 Methadone maintenance treatment vs No methadone maintenance treatment, Outcome 3 Self reported heroin use.
Figures and Tables -
Analysis 1.3

Comparison 1 Methadone maintenance treatment vs No methadone maintenance treatment, Outcome 3 Self reported heroin use.

Comparison 1 Methadone maintenance treatment vs No methadone maintenance treatment, Outcome 4 Criminal activity.
Figures and Tables -
Analysis 1.4

Comparison 1 Methadone maintenance treatment vs No methadone maintenance treatment, Outcome 4 Criminal activity.

Comparison 1 Methadone maintenance treatment vs No methadone maintenance treatment, Outcome 5 Mortality.
Figures and Tables -
Analysis 1.5

Comparison 1 Methadone maintenance treatment vs No methadone maintenance treatment, Outcome 5 Mortality.

Methadone maintenance treatment compared to No methadone maintenance treatment for opioid dependence

Patient or population: patients with opioid dependence

Settings: Prisons, hospitals, community based treatments and research facilities

Intervention: Methadone maintenance treatment

Comparison: No methadone maintenance treatment

Outcomes

Illustrative comparative risks* (95% CI)

Relative effect
(95% CI)

No of Participants
(studies)

Quality of the evidence
(GRADE)

Comments

Assumed risk

Corresponding risk

No methadone maintenance treatment

Methadone maintenance treatment

Retention in treatment ‐ Old studies (pre 2000)
objective

Medium risk population

RR 3.05
(1.75 to 5.35)

505
(3)

⊕⊕⊕⊕
high1,2

210 per 1000

640 per 1000
(368 to 1123)

Retention in treatment ‐ New studies

Medium risk population

RR 4.44
(3.26 to 6.04)

750
(4)

⊕⊕⊕⊕
high2,3

154 per 1000

684 per 1000
(502 to 930)

Morphine positive urine or hair analysis
objective

Medium risk population

RR 0.66
(0.56 to 0.78)

1129
(6)

⊕⊕⊕⊕
high

701 per 1000

463 per 1000
(393 to 547)

Criminal activity
objective

Medium risk population

RR 0.39
(0.12 to 1.25)

363
(3)

⊕⊕⊕⊝
moderate4

118 per 1000

46 per 1000
(14 to 148)

Mortality
objective

Medium risk population

RR 0.48
(0.1 to 2.39)

576
(4)

⊕⊕⊕⊝
moderate4

17 per 1000

8 per 1000
(2 to 41)

*The basis for the assumed risk (e.g. the median control group risk across studies) is provided in footnotes. The corresponding risk (and its 95% confidence interval) is based on the assumed risk in the comparison group and the relative effect of the intervention (and its 95% CI).

CI: Confidence interval; RR: Risk ratio;

GRADE Working Group grades of evidance
High quality: Further research is very unlikely to change our confidence in the estimate of effect.
Moderate quality: Further research is likely to have an important impact on our confidence in the estimate of effect and may change the estimate.
Low quality: Further research is very likely to have an important impact on our confidence in the estimate of effect and is likely to change the estimate.
Very low quality: We are very uncertain about the estimate.

1 RR 3.05

2 Other Cochrane review showing dose related effect : Faggiano F, Vigna‐Taglianti F, Versino E, Lemma P. Methadone maintenance at different dosages for opioid dependence. Cochrane Database of Systematic Reviews 2003, Issue 3. Art. No.: CD002208. DOI: 10.1002/14651858.CD002208

3 RR 4.4

4 Too few numbers of events observed

Figures and Tables -
Comparison 1. Methadone maintenance treatment vs No methadone maintenance treatment

Outcome or subgroup title

No. of studies

No. of participants

Statistical method

Effect size

1 Retention in treatment Show forest plot

7

Risk Ratio (M‐H, Random, 95% CI)

Subtotals only

1.1 Old studies (pre 2000)

3

505

Risk Ratio (M‐H, Random, 95% CI)

3.05 [1.75, 5.35]

1.2 New studies

4

750

Risk Ratio (M‐H, Random, 95% CI)

4.44 [3.26, 6.04]

2 Morphine positive urine or hair analysis Show forest plot

6

1129

Risk Ratio (M‐H, Random, 95% CI)

0.66 [0.56, 0.78]

3 Self reported heroin use Show forest plot

6

Risk Ratio (M‐H, Random, 95% CI)

Subtotals only

4 Criminal activity Show forest plot

3

363

Risk Ratio (M‐H, Random, 95% CI)

0.39 [0.12, 1.25]

5 Mortality Show forest plot

4

576

Risk Ratio (M‐H, Random, 95% CI)

0.48 [0.10, 2.39]

Figures and Tables -
Comparison 1. Methadone maintenance treatment vs No methadone maintenance treatment