Glucocorticoids for croup in children
Information
- DOI:
- https://doi.org/10.1002/14651858.CD001955.pub5Copy DOI

- Database:
-
- Cochrane Database of Systematic Reviews
- Version published:
-
- 10 January 2023see what's new
- Type:
-
- Intervention
- Stage:
-
- Review
- Cochrane Editorial Group:
-
Cochrane Acute Respiratory Infections Group
- Copyright:
-
- Copyright © 2023 The Cochrane Collaboration. Published by John Wiley & Sons, Ltd.
Article metrics
Altmetric:
Cited by:
Authors
Contributions of authors
Alex Aregbesola (AA): study selection, data extraction and verification, risk of bias assessment, GRADE assessment, statistical analyses, manuscript preparation.
Clara Tam (CT): data extraction and verification, risk of bias assessment, GRADE assessment, statistical analyses, manuscript preparation.
Asha Kothari (AK): data extraction and verification, risk of bias assessment, GRADE assessment, manuscript preparation.
Mê‐Linh Lê (ML): study selection, contribution to the manuscript.
Mirna Ragheb (MR): data extraction and verification, risk of bias assessment, contribution to the manuscript.
Terry P Klassen (TPK): clinical adviser, contribution to the manuscript.
Sources of support
Internal sources
-
The Children’s Hospital Foundation of Manitoba, Canada
Funding to support this update review
-
Alberta Research Centre for Health Evidence (ARCHE), University of Alberta, Canada
Funding for the completion of previous update and for previous versions of this review
-
TRanslating Emergency Knowledge for Kids (TREKK), Manitoba, Canada
Funding for the completion of this update
-
Canadian Coordinating Office for Health Technology Assessment (CCOHTA), Ottawa, Canada
Funding for previous versions of this review
-
Children's Hospital of Eastern Ontario Research Institute (CHEO RI), Ottawa, Canada
Funding for previous versions of this review
-
Thomas C. Chalmers Centre for Systematic Reviews, Ottawa, Canada
Funding for previous versions of this review
-
Fondo de Investigaciones Sanitarias, Instituto de Salud Carlos III, Madrid, Spain
Funding for previous versions of this review
-
Instituto Nacional de la Salud (INSALUD), Madrid, Spain
Funding for previous versions of this review
External sources
-
Alberta Heritage Foundation for Medical Research, Canada
Funding for previous versions of this review
Declarations of interest
Alex Aregbesola: declared that they have no conflict of interest.
Clara Tam: declared that they have no conflict of interest.
Asha Kothari: declared that they have no conflict of interest.
Mê‐Linh Lê: declared that they have no conflict of interest.
Mirna Ragheb: declared that they have no conflict of interest.
Terry P Klassen: is an author of four of the included studies (Bjornson 2004; Klassen 1994; Klassen 1996; Klassen 1998).
Acknowledgements
We thank the administrative staff of the Children's Hospital Research Institute of Manitoba. We acknowledge the contributions of Allison Gates, Michelle Gates, Ben Vandermeer, Cydney Johnson, Lisa Hartling, and David W Johnson, authors of the 2018 review update.
For this 2022 update, we acknowledge the contribution of Veronica Lai, who participated in the update.
The following people conducted the editorial process for this update.
-
Sign‐off Editors (final editorial decision): Mark Jones (Bond University, Australia); Mieke van Driel (The University of Queensland, Australia).
-
Managing Editors (provided editorial guidance to authors, edited the review, selected peer reviewers, and collated peer‐reviewer comments): Liz Dooley (Bond University, Australia); Fiona Russell (Bond University, Australia).
-
Contact Editor (assessed peer‐review comments and recommended an editorial decision): Lubna Al‐Ansary (Department of Family and Community Medicine, College of Medicine, King Saud University, Riyadh, Saudi Arabia).
-
Statistical Editor (provided comments): Robert S Ware (Menzies Health Institute Queensland, Griffith University, Australia).
-
Copy Editor (copy‐editing and production): Lisa Winer, Cochrane Copy Edit Support.
Peer reviewers (provided comments and recommended an editorial decision):
-
Clinical/content review: Dr Gina Neto (University of Ottawa, Canada).
-
Consumer review: A Fraiz (Registered Nurse and Consumer).
-
Methods review: Rachel Richardson (Associate Editor, Cochrane).
-
Search review: Justin Clark (Institute for Evidence‐Based Healthcare, Bond University, Australia); Liz Doney (Cochrane Skin, University of Nottingham, UK).
Version history
| Published | Title | Stage | Authors | Version |
| 2023 Jan 10 | Glucocorticoids for croup in children | Review | Alex Aregbesola, Clara M Tam, Asha Kothari, Me-Linh Le, Mirna Ragheb, Terry P Klassen | |
| 2018 Aug 22 | Glucocorticoids for croup in children | Review | Allison Gates, Michelle Gates, Ben Vandermeer, Cydney Johnson, Lisa Hartling, David W Johnson, Terry P Klassen | |
| 2011 Jan 19 | Glucocorticoids for croup | Review | Kelly F Russell, Yuanyuan Liang, Kathleen O'Gorman, David W Johnson, Terry P Klassen | |
| 2004 Jan 26 | Glucocorticoids for croup | Review | Kelly F Russell, Natasha Wiebe, Antonio Saenz, Monica Ausejo Segura, David W Johnson, Lisa Hartling, Terry P Klassen | |
| 1999 Jun 11 | Glucocorticoids for croup | Review | Segura M Ausejo, A Saenz, B Pham, JD Kellner, DW Johnson, D Moher, TP Klassen | |
Differences between protocol and review
The following new authors joined the review group for the 2022 update: Alex Aregbesola, Clara Tam, Asha Kothari, Mê‐Linh Lê, and Mirna Ragheb. As in the previous version of this review, we added an age range for children in our inclusion criteria (0 to 18 years). We did not extract data for some of the outcomes in the protocol because the newly included studies did not report these outcomes. We used GRADEpro GDT software to assess the certainty of the body of evidence (GRADEpro GDT). We updated the summary of findings tables for two comparisons and added a summary of findings table for one new comparison in the Additional tables section.
Keywords
MeSH
Medical Subject Headings (MeSH) Keywords
Medical Subject Headings Check Words
Adolescent; Child; Humans;
PICOs
Cumulative meta‐graph by year for change in croup score six hours after treatment for any glucocorticoid compared to placebo.

Cumulative meta‐graph by year for return visits or (re)admissions or both for any glucocorticoid compared to placebo.

Flow diagram of study selection for this review.

Risk of bias graph for studies included in the 2022 update synthesis: review authors' judgements about each risk of bias item presented as percentages across all included studies.

Risk of bias summary for studies included in the 2022 update synthesis: review authors' judgements about each risk of bias item for each included study.

Comparison 1: Any glucocorticoid compared to placebo, Outcome 1: Croup score (change baseline ‐ 2 hours) by score

Comparison 1: Any glucocorticoid compared to placebo, Outcome 2: Croup score (change baseline ‐ 6 hours) by score

Comparison 1: Any glucocorticoid compared to placebo, Outcome 3: Croup score (change baseline ‐ 12 hours) by score

Comparison 1: Any glucocorticoid compared to placebo, Outcome 4: Croup score (change baseline ‐ 24 hours) by score

Comparison 1: Any glucocorticoid compared to placebo, Outcome 5: Croup score (change baseline ‐ 2 hours) by inpatient/outpatient

Comparison 1: Any glucocorticoid compared to placebo, Outcome 6: Croup score (change baseline ‐ 6 hours) by inpatient/outpatient

Comparison 1: Any glucocorticoid compared to placebo, Outcome 7: Croup score (change baseline ‐ 24 hours) by inpatient/outpatient

Comparison 1: Any glucocorticoid compared to placebo, Outcome 8: Croup score (change baseline ‐ 2 hours) by glucocorticoid

Comparison 1: Any glucocorticoid compared to placebo, Outcome 9: Croup score (change baseline ‐ 6 hours) by glucocorticoid

Comparison 1: Any glucocorticoid compared to placebo, Outcome 10: Croup score (change baseline ‐ 12 hours) by glucocorticoid

Comparison 1: Any glucocorticoid compared to placebo, Outcome 11: Croup score (change baseline ‐ 24 hours) by glucocorticoid

Comparison 1: Any glucocorticoid compared to placebo, Outcome 12: Return visits or (re)admissions or both by inpatient/outpatient

Comparison 1: Any glucocorticoid compared to placebo, Outcome 13: Return visits or (re)admissions or both by glucocorticoid

Comparison 1: Any glucocorticoid compared to placebo, Outcome 14: Return visits or (re)admissions or both by croup severity

Comparison 1: Any glucocorticoid compared to placebo, Outcome 15: Length of stay by inpatient

Comparison 1: Any glucocorticoid compared to placebo, Outcome 16: Length of stay by glucocorticoid

Comparison 1: Any glucocorticoid compared to placebo, Outcome 17: Improvement (at 2 hours) by inpatient

Comparison 1: Any glucocorticoid compared to placebo, Outcome 18: Improvement (at 6 hours) by inpatient/outpatient

Comparison 1: Any glucocorticoid compared to placebo, Outcome 19: Improvement (at 12 hours) by inpatient

Comparison 1: Any glucocorticoid compared to placebo, Outcome 20: Improvement (at 24 hours) by inpatient/outpatient

Comparison 1: Any glucocorticoid compared to placebo, Outcome 21: Improvement (at 6 hours) by glucocorticoid

Comparison 1: Any glucocorticoid compared to placebo, Outcome 22: Improvement (at 12 hours) by glucocorticoid

Comparison 1: Any glucocorticoid compared to placebo, Outcome 23: Improvement (at 24 hours) by glucocorticoid

Comparison 1: Any glucocorticoid compared to placebo, Outcome 24: Additional treatments: antibiotics

Comparison 1: Any glucocorticoid compared to placebo, Outcome 25: Additional treatments: epinephrine

Comparison 1: Any glucocorticoid compared to placebo, Outcome 26: Additional treatments: intubation/tracheostomy

Comparison 1: Any glucocorticoid compared to placebo, Outcome 27: Additional treatments: mist tent

Comparison 1: Any glucocorticoid compared to placebo, Outcome 28: Additional treatments: supplemental glucocorticoids

Comparison 2: Any glucocorticoid compared to epinephrine, Outcome 1: Croup score (change baseline ‐ 2 hours) by inpatient/outpatient

Comparison 2: Any glucocorticoid compared to epinephrine, Outcome 2: Croup score (change baseline ‐ 6 hours) by inpatient

Comparison 2: Any glucocorticoid compared to epinephrine, Outcome 3: Croup score (change baseline ‐ 12 hours) by inpatient

Comparison 2: Any glucocorticoid compared to epinephrine, Outcome 4: Croup score (change baseline ‐ 24 hours) by inpatient

Comparison 2: Any glucocorticoid compared to epinephrine, Outcome 5: Croup score (change baseline ‐ 2 hours) by glucocorticoid

Comparison 2: Any glucocorticoid compared to epinephrine, Outcome 6: Croup score (change baseline ‐ 12 hours) by glucocorticoid

Comparison 2: Any glucocorticoid compared to epinephrine, Outcome 7: Croup score (change baseline ‐ 24 hours) by glucocorticoid

Comparison 2: Any glucocorticoid compared to epinephrine, Outcome 8: Return visits or (re)admissions or both by inpatient/outpatient

Comparison 2: Any glucocorticoid compared to epinephrine, Outcome 9: Length of stay by inpatient

Comparison 2: Any glucocorticoid compared to epinephrine, Outcome 10: Additional treatments: epinephrine

Comparison 2: Any glucocorticoid compared to epinephrine, Outcome 11: Additional treatments: intubation/tracheostomy

Comparison 2: Any glucocorticoid compared to epinephrine, Outcome 12: Additional treatments: supplemental glucocorticoids

Comparison 3: Dexamethasone compared to budesonide, Outcome 1: Croup score (change baseline ‐ 6 hours) by inpatient/outpatient

Comparison 3: Dexamethasone compared to budesonide, Outcome 2: Croup score (change baseline ‐ 12 hours) by inpatient

Comparison 3: Dexamethasone compared to budesonide, Outcome 3: Return visits or (re)admissions or both by inpatient/outpatient

Comparison 3: Dexamethasone compared to budesonide, Outcome 4: Length of stay by inpatient/outpatient

Comparison 3: Dexamethasone compared to budesonide, Outcome 5: Improvement (at 6 hours) by outpatient

Comparison 3: Dexamethasone compared to budesonide, Outcome 6: Additional treatments: epinephrine

Comparison 3: Dexamethasone compared to budesonide, Outcome 7: Additional treatments: intubation/tracheostomy

Comparison 3: Dexamethasone compared to budesonide, Outcome 8: Additional treatments: supplemental glucocorticoids

Comparison 4: Dexamethasone compared to beclomethasone, Outcome 1: Return visits or (re)admissions or both by outpatient

Comparison 5: Dexamethasone compared to betamethasone, Outcome 1: Croup score (change baseline ‐ 2 hours) by outpatient

Comparison 5: Dexamethasone compared to betamethasone, Outcome 2: Croup score (change baseline ‐ 6 hours) by outpatient

Comparison 5: Dexamethasone compared to betamethasone, Outcome 3: Return visits or (re)admissions or both by outpatient

Comparison 5: Dexamethasone compared to betamethasone, Outcome 4: Additional treatments: epinephrine

Comparison 6: Dexamethasone compared to prednisolone, Outcome 1: Croup score (change baseline ‐ 2 hours) by outpatient

Comparison 6: Dexamethasone compared to prednisolone, Outcome 2: Croup score (change baseline ‐ 6 hours) by outpatient

Comparison 6: Dexamethasone compared to prednisolone, Outcome 3: Return visits or (re)admissions or both by outpatient

Comparison 6: Dexamethasone compared to prednisolone, Outcome 4: Length of stay by outpatient

Comparison 6: Dexamethasone compared to prednisolone, Outcome 5: Additional treatments: epinephrine

Comparison 6: Dexamethasone compared to prednisolone, Outcome 6: Additional treatments: intubation/tracheotomy

Comparison 6: Dexamethasone compared to prednisolone, Outcome 7: Additional treatments: supplemental glucocorticoids

Comparison 7: Budesonide and dexamethasone compared to dexamethasone, Outcome 1: Croup score (change baseline ‐ 6 hours) by inpatient/outpatient

Comparison 7: Budesonide and dexamethasone compared to dexamethasone, Outcome 2: Return visits or (re)admissions or both by inpatient/outpatient

Comparison 7: Budesonide and dexamethasone compared to dexamethasone, Outcome 3: Length of stay by inpatient/outpatient

Comparison 7: Budesonide and dexamethasone compared to dexamethasone, Outcome 4: Improvement (at 6 hours) by outpatient

Comparison 7: Budesonide and dexamethasone compared to dexamethasone, Outcome 5: Additional treatments: epinephrine

Comparison 7: Budesonide and dexamethasone compared to dexamethasone, Outcome 6: Additional treatments: mist tent

Comparison 7: Budesonide and dexamethasone compared to dexamethasone, Outcome 7: Additional treatments: supplemental glucocorticoids

Comparison 8: Budesonide and dexamethasone compared to budesonide, Outcome 1: Croup score (change baseline ‐ 6 hours) by outpatient

Comparison 8: Budesonide and dexamethasone compared to budesonide, Outcome 2: Return visits or (re)admissions or both by outpatient

Comparison 8: Budesonide and dexamethasone compared to budesonide, Outcome 3: Length of stay by outpatient

Comparison 8: Budesonide and dexamethasone compared to budesonide, Outcome 4: Improvement (at 6 hours) by outpatient

Comparison 8: Budesonide and dexamethasone compared to budesonide, Outcome 5: Additional treatments: epinephrine

Comparison 8: Budesonide and dexamethasone compared to budesonide, Outcome 6: Additional treatments: supplemental glucocorticoids

Comparison 9: Oral compared to intramuscular dexamethasone, Outcome 1: Return visits or (re)admissions or both by outpatient

Comparison 9: Oral compared to intramuscular dexamethasone, Outcome 2: Improvement (at 24 hours) by outpatient

Comparison 9: Oral compared to intramuscular dexamethasone, Outcome 3: Additional treatments: antibiotics

Comparison 9: Oral compared to intramuscular dexamethasone, Outcome 4: Additional treatments: epinephrine

Comparison 9: Oral compared to intramuscular dexamethasone, Outcome 5: Additional treatments: mist tent

Comparison 9: Oral compared to intramuscular dexamethasone, Outcome 6: Additional treatments: supplemental glucocorticoids

Comparison 10: Oral compared to nebulised dexamethasone, Outcome 1: Return visits or (re)admissions or both by outpatient

Comparison 11: Dexamethasone 0.30 mg/kg compared to 0.15 mg/kg, Outcome 1: Return visits or (re)admissions or both by outpatient

Comparison 11: Dexamethasone 0.30 mg/kg compared to 0.15 mg/kg, Outcome 2: Additional treatments: epinephrine

Comparison 11: Dexamethasone 0.30 mg/kg compared to 0.15 mg/kg, Outcome 3: Additional treatments: supplemental glucocorticoids

Comparison 12: Dexamethasone 0.60 mg/kg compared to 0.30 mg/kg, Outcome 1: Return visits or (re)admissions or both by outpatient

Comparison 12: Dexamethasone 0.60 mg/kg compared to 0.30 mg/kg, Outcome 2: Additional treatments: epinephrine

Comparison 12: Dexamethasone 0.60 mg/kg compared to 0.30 mg/kg, Outcome 3: Additional treatments: supplemental glucocorticoids

Comparison 13: Dexamethasone 0.60 mg/kg compared to 0.15 mg/kg, Outcome 1: Croup score (Westley) (change baseline ‐ 2 hours) by inpatient/outpatient

Comparison 13: Dexamethasone 0.60 mg/kg compared to 0.15 mg/kg, Outcome 2: Croup score (change baseline ‐ 6 hours) by inpatient/outpatient

Comparison 13: Dexamethasone 0.60 mg/kg compared to 0.15 mg/kg, Outcome 3: Croup score (change baseline ‐ 12 hours) by inpatient/outpatient

Comparison 13: Dexamethasone 0.60 mg/kg compared to 0.15 mg/kg, Outcome 4: Croup score (change baseline ‐ 24 hours) by outpatient

Comparison 13: Dexamethasone 0.60 mg/kg compared to 0.15 mg/kg, Outcome 5: Return visits or (re)admissions or both by outpatient

Comparison 13: Dexamethasone 0.60 mg/kg compared to 0.15 mg/kg, Outcome 6: Length of stay by outpatient

Comparison 13: Dexamethasone 0.60 mg/kg compared to 0.15 mg/kg, Outcome 7: Additional treatments: epinephrine

Comparison 13: Dexamethasone 0.60 mg/kg compared to 0.15 mg/kg, Outcome 8: Additional treatments: intubation/tracheotomy

Comparison 13: Dexamethasone 0.60 mg/kg compared to 0.15 mg/kg, Outcome 9: Additional treatments: supplemental glucocorticoids
| Any glucocorticoid compared to placebo for croup | ||||||
| Patient or population: children with croup | ||||||
| Outcomes | Anticipated absolute effects* (95% CI) | Relative effect | № of participants | Certainty of the evidence | Comments** | |
|---|---|---|---|---|---|---|
| Placebo | Any glucocorticoid | |||||
| Change in croup score. Assessed with different scores in different studies. Lower scores mean fewer symptoms. (Follow‐up: 2 hours) | The mean change in croup score was −1.50 to −0.81. | The mean change in croup score was 0.65 standard deviations in favour | ‐ | 426 | ⊕⊕⊝⊝ | A standard deviation of 0.65 represents a moderate difference between groups. |
| Change in croup score. Assessed with different scores in different studies. Lower scores mean fewer symptoms. (Follow‐up: 6 hours) | The mean change in croup score was −3.23 to −0.65. | The mean change in croup score was 0.76 standard deviations in favour | ‐ | 959 | ⊕⊕⊝⊝ | A standard deviation of 0.76 represents a large difference between groups. |
| Change in croup score. Assessed with different scores in different studies. Lower scores mean fewer symptoms. (Follow‐up: 12 hours) | The mean change in croup score was −7.62 to −1.00. | The mean change in croup score was 1.03 standard deviations in favour | ‐ | 571 | ⊕⊕⊝⊝ | A standard deviation of 1.03 represents a large difference between groups. |
| Change in croup score. Assessed with different scores in different studies. Lower scores mean fewer symptoms. (Follow‐up: 24 hours) | The mean change in croup score was −2.56 to −1.05. | The mean change in croup score was 0.86 standard deviations in favour | ‐ | 351 | ⊕⊝⊝⊝ | A standard deviation of 0.86 represents a large difference between groups. |
| Return visits or (re)admissions or both | 204 per 1000 | 106 per 1000 | RR 0.52 | 1679 | ⊕⊕⊝⊝ |
|
| Adverse events | 13/26 (50%) studies reported collecting adverse events data, and 8/13 (62%) reported no serious adverse events. Bjornson 2004 reported 7 instances of pneumonia (3/359, 0.83% in the dexamethasone group and 4/361, 1.11% in the placebo group). Johnson 1996 reported 1 child with neutropenia consistent with bacterial tracheitis in the dexamethasone group (1/28, 3.57%). Kuusela 1988 reported 7 secondary bacterial infections (pneumonia, sinusitis, otitis media) requiring antibiotic therapy: 5/35, 14% in the dexamethasone group and 2/16, 12.5% in the placebo group. Super 1989 reported 1 child with pneumonitis in the placebo group (1/13, 7.7%) and 2 children with pneumonia in the dexamethasone group (2/16, 12.5%). Roberts 1999 reported 1 instance of exacerbated symptoms, 5 children with emotional distress, 2 with vomiting, and 1 instance of eye irritation in the budesonide group (9/42, 21.4%), and 3 instances of exacerbated symptoms, 6 children with emotional distress, 3 with vomiting, 2 rashes, and 1 instance each of eye irritation and tongue irritation in the placebo group (16/40, 40%). | 1399 (13 RCTs) | ⊕⊕⊝⊝ |
| ||
| *The risk in the intervention group (and its 95% confidence interval) is based on the assumed risk in the comparison group and the relative effect of the intervention (and its 95% CI). CI: confidence interval; RCT: randomised controlled trial; RR: risk ratio | ||||||
| GRADE Working Group grades of evidence | ||||||
| aWe downgraded by one level for inconsistency. There was considerable heterogeneity (I² = 81%), and variation in point estimates. | ||||||
| Any glucocorticoid compared to epinephrine for croup | ||||||
| Patient or population: children with croup | ||||||
| Outcomes | Anticipated absolute effects* (95% CI) | Relative effect | № of participants | Certainty of the evidence | Comments** | |
|---|---|---|---|---|---|---|
| Epinephrine | Any glucocorticoid | |||||
| Change in croup score. Assessed with different scores in different studies. Lower scores mean fewer symptoms. (Follow‐up: 2 hours) | The mean change in croup score was −4.24 to −3.74. | The mean change in croup score was 0.77 standard deviations not in favour | ‐ | 130 | ⊕⊝⊝⊝ | A standard deviation of 0.77 represents a large difference between groups. |
| Change in croup score. Assessed with different scores in different studies. Lower scores mean fewer symptoms. (Follow‐up: 6 hours) | The mean change in croup score was −1.25 to −1.10. | The mean change in croup score was 0.10 standard deviations in favour | ‐ | 63 | ⊕⊝⊝⊝ | A standard deviation of 0.10 represents a minimal difference between groups. |
| Change in croup score. Assessed with different scores in different studies. Lower scores mean fewer symptoms. (Follow‐up: 12 hours) | The mean change in croup score was −3.86 to −1.45. | The mean change in croup score was 0.07 standard deviations in favour | ‐ | 129 | ⊕⊕⊝⊝ | A standard deviation of 0.07 represents a minimal difference between groups. |
| Change in croup score. Assessed with different scores in different studies. Lower scores mean fewer symptoms. (Follow‐up: 24 hours) | The mean change in croup score was −4.40 to −2.01. | The mean change in croup score was 0.17 standard deviations not in favour | ‐ | 129 | ⊕⊕⊝⊝ | A standard deviation of 0.17 represents a small difference between groups. |
| Return visits or (re)admissions or both | 0 per 1000 | 0 per 1000 | RD 0.00 | 130 | ⊕⊕⊝⊝ |
|
| Adverse events | 3/4 (75%) studies reported collecting adverse events data. Fitzgerald 1996 reported no serious adverse events. Kuusela 1988 reported 5 cases of secondary bacterial infections (pneumonia, sinusitis, otitis media) requiring antibiotic therapy in the dexamethasone group (5/16, 31.3%). Eboriadou 2010 reported 4 cases of tremor and tachycardia (4/25, 16%) in the epinephrine group. | 162 | ⊕⊕⊝⊝ |
| ||
| *The risk in the intervention group (and its 95% confidence interval) is based on the assumed risk in the comparison group and the relative effect of the intervention (and its 95% CI). CI: confidence interval; RCT: randomised controlled trial; RD: risk difference | ||||||
| GRADE Working Group grades of evidence | ||||||
| aWe downgraded by one level for inconsistency. There was considerable heterogeneity (I² = 87%), and variation in point estimates. There was minimal overlap of the confidence intervals. | ||||||
| Baseline rate (%) | NNTB (95% CI) |
|---|---|
| Mean baseline rate | |
| 30.62 | 7 (5 to 12) |
| Smallest baseline rate | |
| 2.06 | 102 (78 to 179) |
| Largest baseline rate | |
| 72.00 | 3 (2 to 5) |
| NNTB: number needed to treat for an additional beneficial outcome | |
| Dexamethasone compared to budesonide for croup | ||||||
| Patient or population: children with croup | ||||||
| Outcomes | Anticipated absolute effects* (95% CI) | Relative effect | № of participants | Certainty of the evidence | Comments** | |
|---|---|---|---|---|---|---|
| Budesonide | Dexamethasone | |||||
| Change in croup score. Assessed with different scores in different studies. Lower scores mean fewer symptoms. (Follow‐up: 6 hours) | The mean change in croup score was −2.93 to −2.00. | The mean change in croup score was 0.46 standard deviations in favour (0.79 more to 0.13 more). | ‐ | 326 | ⊕⊕⊝⊝ | A standard deviation of 0.46 represents a moderate difference between groups. |
| Change in croup score. Assessed with different scores in different studies. Lower scores mean fewer symptoms. (Follow‐up: 12 hours) | The mean change in croup score was −3.07 to −2.33. | The mean change in croup score was 0.75 standard deviations in favour (1.19 more to 0.30 more). | ‐ | 84 | ⊕⊕⊝⊝ | A standard deviation of 0.75 represents a large difference between groups. |
| Return visits or (re)admissions or both | Study population | RR 0.69 | 374 | ⊕⊕⊕⊝ |
| |
| 122 per 1000 | 84 per 1000 (49 to 149) | |||||
| Adverse events | 4/6 (67%) studies reported collecting adverse events data, and 3/4 (75%) studies reported no serious adverse events (Duman 2005; Johnson 1998; Vad Pedersen 1998). Klassen 1998 reported 1 case of oral thrush in the budesonide group (1/65, 1.5%) and 1 case each of hives and violent behaviour in the dexamethasone group (2/69, 2.9%). | 335 (4 RCTs) | ⊕⊕⊝⊝ |
| ||
| *The risk in the intervention group (and its 95% confidence interval) is based on the assumed risk in the comparison group and the relative effect of the intervention (and its 95% CI). CI: confidence interval; RCT: randomised controlled trial; RR: risk ratio | ||||||
| GRADE Working Group grades of evidence | ||||||
| aWe downgraded by one level for risk of bias. The contributing studies were at high (n = 2) and unclear (n = 2) risk of bias. Allocation concealment was unclear in two studies; blinding was unclear in two studies; and one study was unblinded. There was a baseline imbalance in croup score in one study. | ||||||
| Dexamethasone compared to beclomethasone for croup | |||||
| Patient or population: children with croup | |||||
| Outcomes | Anticipated absolute effects* (95% CI) | Relative effect | № of participants | Certainty of the evidence | |
|---|---|---|---|---|---|
| Beclomethasone | Dexamethasone | ||||
| Return visits or (re)admissions or both | Study population | RD 0.00 | 39 | ⊕⊕⊕⊝ | |
| 0 per 1000 | 0 per 1000 (0 to 0) | ||||
| Adverse events (no events) | Eboriadou 2010 reported no adverse events related to the glucocorticoids. | 39 (1 RCT) | ⊕⊕⊝⊝ | ||
| *The risk in the intervention group (and its 95% confidence interval) is based on the assumed risk in the comparison group and the relative effect of the intervention (and its 95% CI). CI: confidence interval; RCT: randomised controlled trial; RD: risk difference | |||||
| GRADE Working Group grades of evidence | |||||
| aWe downgraded by one level for imprecision. The sample size was small (did not meet the optimal information size). | |||||
| Dexamethasone compared to betamethasone for croup | |||||
| Patient or population: children with croup | |||||
| Outcomes | Anticipated absolute effects* (95% CI) | Relative effect | № of participants | Certainty of the evidence | |
|---|---|---|---|---|---|
| Betamethasone | Dexamethasone | ||||
| Change in croup score. Assessed with the Westley croup score. Lower scores mean fewer symptoms. (Follow‐up: 2 hours) | The mean change in croup score from 1 study was −1.68. | The mean change in croup score was 0.62 units in favour (1.17 more to 0.06 more). | ‐ | 52 | ⊕⊕⊝⊝ |
| Change in croup score. Assessed with the Westley croup score. Lower scores mean fewer symptoms. (Follow‐up: 6 hours) | The mean change in croup score from 1 study was −1.89. | The mean change in croup score was 0.67 units in favour (1.23 more to 0.11 more). | ‐ | 52 | ⊕⊕⊝⊝ |
| Return visits or (re)admissions or both | Study population | RR 0.95 | 52 | ⊕⊕⊝⊝ | |
| 731 per 1000 | 694 per 1000 (490 to 979) | ||||
| Adverse events | Amir 2006 did not report collecting adverse events data. | 52 | ⊕⊕⊝⊝ | ||
| *The risk in the intervention group (and its 95% confidence interval) is based on the assumed risk in the comparison group and the relative effect of the intervention (and its 95% CI). CI: confidence interval; RCT: randomised controlled trial; RR: risk ratio | |||||
| GRADE Working Group grades of evidence | |||||
| aWe downgraded by one level for risk of bias. The one contributing study was at high risk of bias. Allocation concealment was unclear, and the study was not blinded. There was a baseline imbalance in croup score. | |||||
| Dexamethasone compared to prednisolone for croup | |||||
| Patient or population: children with croup | |||||
| Outcomes | Anticipated absolute effects* (95% CI) | Relative effect | № of participants | Certainty of the evidence | |
|---|---|---|---|---|---|
| Prednisolone | Dexamethasone | ||||
| Change in croup score. Assessed with the Westley croup score. Lower scores mean fewer symptoms. (Follow‐up: 2 hours) | The mean change in croup score from 1 study was −0.89. | The mean change in croup score was 0.06 units not in favour (0.06 more to 0.18 less). | ‐ | 1231 | ⊕⊕⊕⊕ |
| Change in croup score. Assessed with the Westley croup score. Lower scores mean fewer symptoms. (Follow‐up: 6 hours) | The mean change in croup score from 1 study was −2.35. | The mean change in croup score was 0.21 units not in favour (0.21 more to 0.62 less). | ‐ | 99 | ⊕⊕⊕⊝ |
| Return visits or (re)admissions or both | Study population | RR 0.55 | 1537 | ⊕⊕⊕⊝ | |
| 212 per 1000 | 117 per 1000 | ||||
| Adverse events | Fifoot 2007, Garbutt 2013, and Sparrow 2006 reported no serious adverse events related to the glucocorticoids. Parker 2019 reported 1 case of insomnia (1/411, 0.24%) and 13 cases of vomiting (13/411, 3.3%) in the prednisolone group, and 29 cases of vomiting (29/820, 3.5%), 1 case of 30‐second febrile convulsion (1/820, 0.1%), and 1 case of hyperactivity (1/820, 0.1%) in the dexamethasone group. | 1550 | ⊕⊕⊕⊝ | ||
| *The risk in the intervention group (and its 95% confidence interval) is based on the assumed risk in the comparison group and the relative effect of the intervention (and its 95% CI). CI: confidence interval; RCT: randomised controlled trial; RR: risk ratio | |||||
| GRADE Working Group grades of evidence | |||||
| aWe downgraded by one level for imprecision. The sample size was small (did not meet the optimal information size). | |||||
| Budesonide compared to dexamethasone for croup | |||||
| Patient or population: children with croup | |||||
| Outcomes | Anticipated absolute effects* (95% CI) | Relative effect | № of participants | Certainty of the evidence | |
|---|---|---|---|---|---|
| Dexamethasone | Budesonide | ||||
| Adverse events | Huang 2021 reported no adverse events.
| 92 | ⊕⊕⊕⊝ | ||
| *The risk in the intervention group (and its 95% confidence interval) is based on the assumed risk in the comparison group and the relative effect of the intervention (and its 95% CI). CI: confidence interval; RCT: randomised controlled trial | |||||
| GRADE Working Group grades of evidence | |||||
| aWe downgraded one level for imprecision. Narrative synthesis was conducted, estimates are not precise. | |||||
| Budesonide and dexamethasone compared to dexamethasone for croup | ||||||
| Patient or population: children with croup | ||||||
| Outcomes | Anticipated absolute effects* (95% CI) | Relative effect | № of participants | Certainty of the evidence | Comments** | |
|---|---|---|---|---|---|---|
| Dexamethasone | Budesonide and dexamethasone | |||||
| Change in croup score. Assessed with different scores in different studies. Lower scores mean fewer symptoms. (Follow‐up: 6 hours) | The mean change in croup score was −3.24 to −1.80. | The mean change in croup score was 0.05 standard deviations not in favour (0.19 more to 0.30 less). | ‐ | 255 | ⊕⊕⊕⊝ | A standard deviation of 0.05 represents a minimal difference between groups. |
| Return visits or (re)admissions or both | Study population | RR 0.91 | 254 | ⊕⊕⊝⊝ |
| |
| 100 per 1000 | 91 per 1000 | |||||
| Adverse events | 1/3 (33%) studies reported collecting adverse events data. Klassen 1998 reported no adverse events in either the dexamethasone group or the dexamethasone and budesonide group. | 133 (1 RCTs) | ⊕⊕⊕⊝ |
| ||
| *The risk in the intervention group (and its 95% confidence interval) is based on the assumed risk in the comparison group and the relative effect of the intervention (and its 95% CI). CI: confidence interval; RCT: randomised controlled trial; RR: risk ratio | ||||||
| GRADE Working Group grades of evidence | ||||||
| aWe downgraded by one level for imprecision. The sample size was small (did not meet the optimal information size). | ||||||
| Budesonide and dexamethasone compared to budesonide for croup | |||||
| Patient or population: children with croup | |||||
| Outcomes | Anticipated absolute effects* (95% CI) | Relative effect | № of participants | Certainty of the evidence | |
|---|---|---|---|---|---|
| Budesonide | Budesonide and dexamethasone | ||||
| Change in croup score. Assessed with the Westley croup score. Lower scores mean fewer symptoms. (Follow‐up: 6 hours) | The mean change in croup score from 1 study was −2.30. | The mean change in croup score was 0.18 units in favour (0.52 more to 0.17 less). | ‐ | 129 | ⊕⊕⊕⊝ |
| Return visits or (re)admissions or both | Study population | RD 0.00 | 129 | ⊕⊕⊕⊝ | |
| 0 per 1000 | 0 per 1000 | ||||
| Adverse events | Klassen 1998 reported 1 case of oral thrush in the budesonide group (1/65, 1.5%) and no adverse events in the dexamethasone and budesonide group. | 129 | ⊕⊕⊕⊝ | ||
| *The risk in the intervention group (and its 95% confidence interval) is based on the assumed risk in the comparison group and the relative effect of the intervention (and its 95% CI). CI: confidence interval; RCT: randomised controlled trial; RD: risk difference | |||||
| GRADE Working Group grades of evidence | |||||
| aWe downgraded by one level for imprecision. The sample size was small (did not meet the optimal information size). | |||||
| Oral dexamethasone compared to intramuscular dexamethasone for croup | |||||
| Patient or population: children with croup | |||||
| Outcomes | Anticipated absolute effects* (95% CI) | Relative effect | № of participants | Certainty of the evidence | |
|---|---|---|---|---|---|
| Intramuscular dexamethasone | Oral dexamethasone | ||||
| Return visits or (re)admissions or both | Study population | RR 0.81 | 440 | ⊕⊕⊕⊝ | |
| 259 per 1000 | 210 per 1000 | ||||
| Adverse events | None of the studies reported collecting adverse events data. | ||||
| *The risk in the intervention group (and its 95% confidence interval) is based on the assumed risk in the comparison group and the relative effect of the intervention (and its 95% CI). CI: confidence interval; RCT: randomised controlled trial; RR: risk ratio | |||||
| GRADE Working Group grades of evidence | |||||
| aWe downgraded by one level for imprecision. The effect estimate included both a null effect and substantial benefit for oral compared to intramuscular dexamethasone. | |||||
| Oral dexamethasone compared to nebulised dexamethasone for croup | |||||
| Patient or population: children with croup | |||||
| Outcomes | Anticipated absolute effects* (95% CI) | Relative effect | № of participants | Certainty of the evidence | |
|---|---|---|---|---|---|
| Nebulised dexamethasone | Oral dexamethasone | ||||
| Return visits or (re)admissions or both | Study population | RR 0.39 | 176 | ⊕⊕⊕⊝ | |
| 209 per 1000 | 81 per 1000 | ||||
| Adverse events | None of the studies reported collecting adverse events data. | ||||
| *The risk in the intervention group (and its 95% confidence interval) is based on the assumed risk in the comparison group and the relative effect of the intervention (and its 95% CI). CI: confidence interval; RCT: randomised controlled trial; RR: risk ratio | |||||
| GRADE Working Group grades of evidence | |||||
| aWe downgraded by one level for imprecision. The sample size was small (did not meet the optimal information size). | |||||
| Dexamethasone 0.30 mg/kg compared to dexamethasone 0.15 mg/kg for croup | |||||
| Patient or population: children with croup | |||||
| Outcomes | Anticipated absolute effects* (95% CI) | Relative effect | № of participants | Certainty of the evidence | |
|---|---|---|---|---|---|
| Dexamethasone 0.15 mg/kg | Dexamethasone 0.30 mg/kg | ||||
| Return visits or (re)admissions or both | Study population | RR 0.94 | 60 | ⊕⊕⊝⊝ | |
| 34 per 1000 | 32 per 1000 | ||||
| Adverse events | Geelhoed 1995b did not report collecting adverse events data. | 60 | ⊕⊕⊝⊝ | ||
| *The risk in the intervention group (and its 95% confidence interval) is based on the assumed risk in the comparison group and the relative effect of the intervention (and its 95% CI). CI: confidence interval; RCT: randomised controlled trial; RR: risk ratio | |||||
| GRADE Working Group grades of evidence | |||||
| aWe downgraded by two levels for imprecision. The sample size was small (did not meet the optimal information size). The effect estimate included significant benefit, the null effect, and potential harm for 0.30 mg/kg compared to 0.15 mg/kg dexamethasone. | |||||
| Dexamethasone 0.60 mg/kg compared to dexamethasone 0.30 mg/kg for croup | |||||
| Patient or population: children with croup | |||||
| Outcomes | Anticipated absolute effects* (95% CI) | Relative effect | № of participants | Certainty of the evidence | |
|---|---|---|---|---|---|
| Dexamethasone 0.30 mg/kg | Dexamethasone 0.60 mg/kg | ||||
| Return visits or (re)admissions or both | Study population | RR 1.40 | 60 | ⊕⊕⊝⊝ | |
| 69 per 1000 | 97 per 1000 | ||||
| Adverse events | Geelhoed 1995a did not report collecting adverse events data. | 60 | ⊕⊝⊝⊝ | ||
| *The risk in the intervention group (and its 95% confidence interval) is based on the assumed risk in the comparison group and the relative effect of the intervention (and its 95% CI). CI: confidence interval; RCT: randomised controlled trial; RR: risk ratio | |||||
| GRADE Working Group grades of evidence | |||||
| aWe downgraded by two levels for imprecision. The sample size was small (did not meet the optimal information size). The effect estimate included significant benefit, the null effect, and potential for harm for 0.60 mg/kg compared to 0.30 mg/kg dexamethasone. | |||||
| Dexamethasone 0.60 mg/kg compared to dexamethasone 0.15 mg/kg for croup | ||||||
| Patient or population: children with croup | ||||||
| Outcomes | Anticipated absolute effects* (95% CI) | Relative effect | № of participants | Certainty of the evidence | Comments** | |
|---|---|---|---|---|---|---|
| Dexamethasone 0.15 mg/kg | Dexamethasone 0.60 mg/kg | |||||
| Change in croup score. Assessed with the Westley croup score. Lower scores mean fewer symptoms. (Follow‐up: 2 hours) | The mean change in croup score was −1.05 to −0.75. | The mean change in croup score was 0.27 standard deviations in favour | ‐ | 861 | ⊕⊕⊕⊕ | A standard deviation of 0.14 represents a small difference between groups. |
| Change in croup score. Assessed with the Westley croup score. Lower scores mean fewer symptoms. (Follow‐up: 6 hours) | The mean change in croup score was −3.10 to −2.09. | The mean change in croup score was 0.45 units in favour (1.26 more to 0.35 less). | ‐ | 178 | ⊕⊕⊕⊝ |
|
| Change in croup score. Assessed with the Westley croup score. Lower scores mean fewer symptoms. (Follow‐up: 12 hours) | The mean change in croup score was −3.50 to −2.95. | The mean change in croup score was 0.60 units in favour (4.39 more to 3.19 less). | ‐ | 113 | ⊕⊝⊝⊝ |
|
| Change in croup score. Assessed with the Westley croup score. Lower scores mean fewer symptoms. (Follow‐up: 24 hours) | The mean change in croup score from 1 study was −4.00. | The mean change in croup score was 0.63 units not in favour (0.16 less to 1.10 less). | ‐ | 72 | ⊕⊕⊕⊝ |
|
| Return visits or (re)admissions or both | Study population | RR 0.91 | 949 | ⊕⊕⊕⊕ |
| |
| 208 per 1000 | 189 per 1000 | |||||
| Adverse events | Parker 2019 reported 16 cases of vomiting (16/410, 4.0%) and 1 case of 30 seconds of febrile convulsion (1/410, 0.2%) in the 0.60 mg/kg dexamethasone group, and 13 cases of vomiting (13/410 (3.3%), 1 case of stridor (1/410, 0.2%), and 1 case of hyperactivity (1/410, 0.2%) in the 0.15 mg/kg dexamethasone group. Alshehr 2005 reported 1 case of bacterial tracheitis and 2 cases of bronchopneumonia in the 0.60 mg/kg dexamethasone group (3/36, 8.3%) and no adverse events in the 0.15 mg/kg dexamethasone group. Chub‐Uppakarn 2007 and Fifoot 2007 reported no adverse events in either treatment group. | 170 | ⊕⊕⊕⊝ |
| ||
| *The risk in the intervention group (and its 95% confidence interval) is based on the assumed risk in the comparison group and the relative effect of the intervention (and its 95% CI). CI: confidence interval; RCT: randomised controlled trial; RR: risk ratio | ||||||
| GRADE Working Group grades of evidence | ||||||
| aWe downgraded by one level for imprecision. The sample size was small (did not meet the optimal information size). | ||||||
| Outcome or subgroup title | No. of studies | No. of participants | Statistical method | Effect size |
| 1.1 Croup score (change baseline ‐ 2 hours) by score Show forest plot | 7 | 426 | Std. Mean Difference (IV, Random, 95% CI) | ‐0.65 [‐1.13, ‐0.18] |
| 1.1.1 Westley score | 5 | 264 | Std. Mean Difference (IV, Random, 95% CI) | ‐0.72 [‐1.44, 0.01] |
| 1.1.2 Non‐Westley score | 2 | 162 | Std. Mean Difference (IV, Random, 95% CI) | ‐0.51 [‐0.93, ‐0.10] |
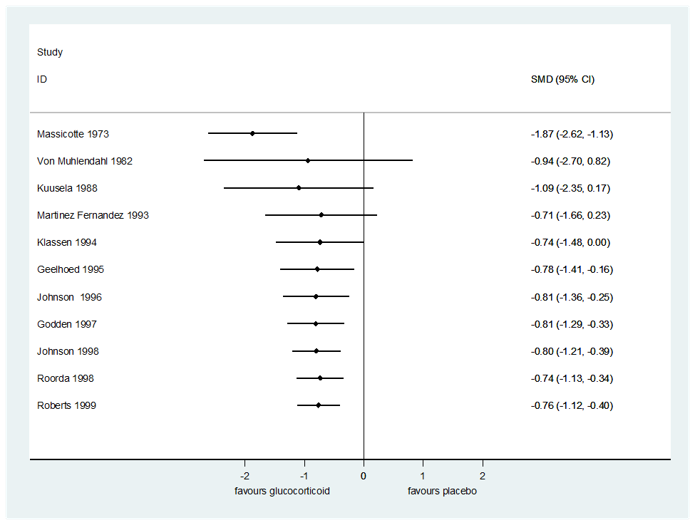
| 1.2 Croup score (change baseline ‐ 6 hours) by score Show forest plot | 11 | 959 | Std. Mean Difference (IV, Random, 95% CI) | ‐0.76 [‐1.12, ‐0.40] |
| 1.2.1 Westley score | 5 | 336 | Std. Mean Difference (IV, Random, 95% CI) | ‐0.79 [‐1.02, ‐0.56] |
| 1.2.2 Non‐Westley score | 6 | 623 | Std. Mean Difference (IV, Random, 95% CI) | ‐0.81 [‐1.43, ‐0.18] |
| 1.3 Croup score (change baseline ‐ 12 hours) by score Show forest plot | 8 | 571 | Std. Mean Difference (IV, Random, 95% CI) | ‐1.03 [‐1.53, ‐0.53] |
| 1.3.1 Westley score | 2 | 113 | Std. Mean Difference (IV, Random, 95% CI) | ‐1.54 [‐2.56, ‐0.53] |
| 1.3.2 Non‐Westley score | 6 | 458 | Std. Mean Difference (IV, Random, 95% CI) | ‐0.87 [‐1.45, ‐0.30] |
| 1.4 Croup score (change baseline ‐ 24 hours) by score Show forest plot | 8 | 351 | Std. Mean Difference (IV, Random, 95% CI) | ‐0.86 [‐1.40, ‐0.31] |
| 1.4.1 Westley score | 4 | 169 | Std. Mean Difference (IV, Random, 95% CI) | ‐1.05 [‐1.72, ‐0.37] |
| 1.4.2 Non‐Westley score | 4 | 182 | Std. Mean Difference (IV, Random, 95% CI) | ‐0.70 [‐1.56, 0.16] |
| 1.5 Croup score (change baseline ‐ 2 hours) by inpatient/outpatient Show forest plot | 7 | 426 | Std. Mean Difference (IV, Random, 95% CI) | ‐0.65 [‐1.13, ‐0.18] |
| 1.5.1 Inpatient | 5 | 301 | Std. Mean Difference (IV, Random, 95% CI) | ‐0.80 [‐1.44, ‐0.16] |
| 1.5.2 Outpatient | 2 | 125 | Std. Mean Difference (IV, Random, 95% CI) | ‐0.32 [‐0.93, 0.29] |
| 1.6 Croup score (change baseline ‐ 6 hours) by inpatient/outpatient Show forest plot | 11 | 959 | Std. Mean Difference (IV, Random, 95% CI) | ‐0.76 [‐1.12, ‐0.40] |
| 1.6.1 Inpatient | 8 | 723 | Std. Mean Difference (IV, Random, 95% CI) | ‐0.72 [‐1.22, ‐0.23] |
| 1.6.2 Outpatient | 3 | 236 | Std. Mean Difference (IV, Random, 95% CI) | ‐0.84 [‐1.11, ‐0.56] |
| 1.7 Croup score (change baseline ‐ 24 hours) by inpatient/outpatient Show forest plot | 8 | 351 | Std. Mean Difference (IV, Random, 95% CI) | ‐0.86 [‐1.40, ‐0.31] |
| 1.7.1 Inpatient | 7 | 291 | Std. Mean Difference (IV, Random, 95% CI) | ‐0.82 [‐1.46, ‐0.19] |
| 1.7.2 Outpatient | 1 | 60 | Std. Mean Difference (IV, Random, 95% CI) | ‐1.09 [‐1.71, ‐0.48] |
| 1.8 Croup score (change baseline ‐ 2 hours) by glucocorticoid Show forest plot | 7 | 426 | Std. Mean Difference (IV, Random, 95% CI) | ‐0.66 [‐1.10, ‐0.22] |
| 1.8.1 Budesonide | 4 | 246 | Std. Mean Difference (IV, Random, 95% CI) | ‐1.01 [‐1.71, ‐0.30] |
| 1.8.2 Dexamethasone | 3 | 163 | Std. Mean Difference (IV, Random, 95% CI) | ‐0.49 [‐1.00, 0.03] |
| 1.8.3 Fluticasone | 1 | 17 | Std. Mean Difference (IV, Random, 95% CI) | 0.45 [‐0.52, 1.42] |
| 1.9 Croup score (change baseline ‐ 6 hours) by glucocorticoid Show forest plot | 11 | 959 | Std. Mean Difference (IV, Random, 95% CI) | ‐0.74 [‐1.07, ‐0.41] |
| 1.9.1 Budesonide | 5 | 333 | Std. Mean Difference (IV, Random, 95% CI) | ‐0.81 [‐1.04, ‐0.58] |
| 1.9.2 Dexamethasone | 6 | 567 | Std. Mean Difference (IV, Random, 95% CI) | ‐0.62 [‐1.17, ‐0.08] |
| 1.9.3 Fluticasone | 1 | 17 | Std. Mean Difference (IV, Random, 95% CI) | 0.06 [‐0.89, 1.02] |
| 1.9.4 Prednisolone | 1 | 42 | Std. Mean Difference (IV, Random, 95% CI) | ‐1.87 [‐2.62, ‐1.13] |
| 1.10 Croup score (change baseline ‐ 12 hours) by glucocorticoid Show forest plot | 8 | 571 | Std. Mean Difference (IV, Random, 95% CI) | ‐1.04 [‐1.51, ‐0.56] |
| 1.10.1 Budesonide | 3 | 209 | Std. Mean Difference (IV, Random, 95% CI) | ‐0.97 [‐1.26, ‐0.68] |
| 1.10.2 Dexamethasone | 5 | 323 | Std. Mean Difference (IV, Random, 95% CI) | ‐0.85 [‐1.55, ‐0.15] |
| 1.10.3 Prednisolone | 1 | 39 | Std. Mean Difference (IV, Random, 95% CI) | ‐2.40 [‐3.26, ‐1.55] |
| 1.11 Croup score (change baseline ‐ 24 hours) by glucocorticoid Show forest plot | 8 | 351 | Std. Mean Difference (IV, Random, 95% CI) | ‐0.89 [‐1.41, ‐0.37] |
| 1.11.1 Budesonide | 2 | 89 | Std. Mean Difference (IV, Random, 95% CI) | ‐1.40 [‐1.88, ‐0.93] |
| 1.11.2 Dexamethasone | 6 | 245 | Std. Mean Difference (IV, Random, 95% CI) | ‐0.89 [‐1.55, ‐0.22] |
| 1.11.3 Fluticasone | 1 | 17 | Std. Mean Difference (IV, Random, 95% CI) | 0.21 [‐0.75, 1.17] |
| 1.12 Return visits or (re)admissions or both by inpatient/outpatient Show forest plot | 10 | 1679 | Risk Ratio (M‐H, Random, 95% CI) | 0.52 [0.36, 0.75] |
| 1.12.1 Inpatient | 3 | 323 | Risk Ratio (M‐H, Random, 95% CI) | 0.39 [0.12, 1.30] |
| 1.12.2 Outpatient | 7 | 1356 | Risk Ratio (M‐H, Random, 95% CI) | 0.53 [0.35, 0.80] |
| 1.13 Return visits or (re)admissions or both by glucocorticoid Show forest plot | 10 | 1679 | Risk Ratio (M‐H, Random, 95% CI) | 0.51 [0.36, 0.72] |
| 1.13.1 Budesonide | 4 | 225 | Risk Ratio (M‐H, Random, 95% CI) | 0.42 [0.19, 0.90] |
| 1.13.2 Dexamethasone | 8 | 1454 | Risk Ratio (M‐H, Random, 95% CI) | 0.53 [0.34, 0.81] |
| 1.14 Return visits or (re)admissions or both by croup severity Show forest plot | 10 | 1679 | Risk Ratio (M‐H, Random, 95% CI) | 0.52 [0.36, 0.76] |
| 1.14.1 Mild croup | 3 | 1068 | Risk Ratio (M‐H, Random, 95% CI) | 0.54 [0.30, 0.95] |
| 1.14.2 Moderate croup | 7 | 611 | Risk Ratio (M‐H, Random, 95% CI) | 0.48 [0.26, 0.86] |
| 1.15 Length of stay by inpatient Show forest plot | 8 | 476 | Mean Difference (IV, Random, 95% CI) | ‐14.90 [‐23.58, ‐6.22] |
| 1.15.1 Inpatient | 8 | 476 | Mean Difference (IV, Random, 95% CI) | ‐14.90 [‐23.58, ‐6.22] |
| 1.16 Length of stay by glucocorticoid Show forest plot | 8 | 476 | Mean Difference (IV, Random, 95% CI) | ‐14.55 [‐22.70, ‐6.41] |
| 1.16.1 Budesonide | 2 | 131 | Mean Difference (IV, Random, 95% CI) | ‐15.29 [‐26.89, ‐3.69] |
| 1.16.2 Dexamethasone | 6 | 328 | Mean Difference (IV, Random, 95% CI) | ‐18.25 [‐27.87, ‐8.62] |
| 1.16.3 Fluticasone | 1 | 17 | Mean Difference (IV, Random, 95% CI) | 4.80 [‐12.34, 21.94] |
| 1.17 Improvement (at 2 hours) by inpatient Show forest plot | 1 | 82 | Risk Ratio (M‐H, Random, 95% CI) | 1.81 [0.96, 3.40] |
| 1.17.1 Inpatient | 1 | 82 | Risk Ratio (M‐H, Random, 95% CI) | 1.81 [0.96, 3.40] |
| 1.18 Improvement (at 6 hours) by inpatient/outpatient Show forest plot | 6 | 332 | Risk Ratio (M‐H, Random, 95% CI) | 1.45 [1.12, 1.88] |
| 1.18.1 Inpatient | 4 | 224 | Risk Ratio (M‐H, Random, 95% CI) | 1.35 [0.96, 1.90] |
| 1.18.2 Outpatient | 2 | 108 | Risk Ratio (M‐H, Random, 95% CI) | 1.78 [1.16, 2.74] |
| 1.19 Improvement (at 12 hours) by inpatient Show forest plot | 6 | 340 | Risk Ratio (M‐H, Random, 95% CI) | 1.33 [1.09, 1.62] |
| 1.19.1 Inpatient | 6 | 340 | Risk Ratio (M‐H, Random, 95% CI) | 1.33 [1.09, 1.62] |
| 1.20 Improvement (at 24 hours) by inpatient/outpatient Show forest plot | 5 | 251 | Risk Ratio (M‐H, Random, 95% CI) | 1.28 [1.01, 1.61] |
| 1.20.1 Inpatient | 4 | 213 | Risk Ratio (M‐H, Random, 95% CI) | 1.18 [0.98, 1.43] |
| 1.20.2 Outpatient | 1 | 38 | Risk Ratio (M‐H, Random, 95% CI) | 2.00 [1.14, 3.51] |
| 1.21 Improvement (at 6 hours) by glucocorticoid Show forest plot | 6 | 332 | Risk Ratio (M‐H, Random, 95% CI) | 1.45 [1.12, 1.88] |
| 1.21.1 Budesonide | 2 | 135 | Risk Ratio (M‐H, Random, 95% CI) | 1.66 [1.19, 2.32] |
| 1.21.2 Dexamethasone | 2 | 105 | Risk Ratio (M‐H, Random, 95% CI) | 1.43 [0.76, 2.72] |
| 1.21.3 Prednisolone | 2 | 92 | Risk Ratio (M‐H, Random, 95% CI) | 1.34 [0.69, 2.62] |
| 1.22 Improvement (at 12 hours) by glucocorticoid Show forest plot | 6 | 340 | Risk Ratio (M‐H, Random, 95% CI) | 1.33 [1.09, 1.62] |
| 1.22.1 Budesonide | 1 | 82 | Risk Ratio (M‐H, Random, 95% CI) | 1.41 [1.08, 1.84] |
| 1.22.2 Dexamethasone | 3 | 166 | Risk Ratio (M‐H, Random, 95% CI) | 1.52 [1.06, 2.18] |
| 1.22.3 Prednisolone | 2 | 92 | Risk Ratio (M‐H, Random, 95% CI) | 1.15 [0.85, 1.55] |
| 1.23 Improvement (at 24 hours) by glucocorticoid Show forest plot | 5 | 251 | Risk Ratio (M‐H, Random, 95% CI) | 1.28 [1.01, 1.61] |
| 1.23.1 Dexamethasone | 4 | 201 | Risk Ratio (M‐H, Random, 95% CI) | 1.39 [1.05, 1.84] |
| 1.23.2 Prednisolone | 1 | 50 | Risk Ratio (M‐H, Random, 95% CI) | 1.04 [0.91, 1.20] |
| 1.24 Additional treatments: antibiotics Show forest plot | 3 | 202 | Risk Difference (M‐H, Random, 95% CI) | 0.00 [‐0.04, 0.04] |
| 1.25 Additional treatments: epinephrine Show forest plot | 9 | 709 | Risk Difference (M‐H, Random, 95% CI) | ‐0.03 [‐0.08, 0.01] |
| 1.26 Additional treatments: intubation/tracheostomy Show forest plot | 11 | 1090 | Risk Difference (M‐H, Random, 95% CI) | ‐0.00 [‐0.01, 0.01] |
| 1.27 Additional treatments: mist tent Show forest plot | 2 | 84 | Risk Difference (M‐H, Random, 95% CI) | ‐0.20 [‐0.87, 0.47] |
| 1.28 Additional treatments: supplemental glucocorticoids Show forest plot | 6 | 305 | Risk Ratio (M‐H, Random, 95% CI) | 0.61 [0.36, 1.03] |
| Outcome or subgroup title | No. of studies | No. of participants | Statistical method | Effect size |
| 2.1 Croup score (change baseline ‐ 2 hours) by inpatient/outpatient Show forest plot | 2 | 130 | Std. Mean Difference (IV, Random, 95% CI) | 0.77 [‐0.24, 1.77] |
| 2.1.1 Inpatient | 1 | 66 | Std. Mean Difference (IV, Random, 95% CI) | 0.26 [‐0.22, 0.75] |
| 2.1.2 Outpatient | 1 | 64 | Std. Mean Difference (IV, Random, 95% CI) | 1.29 [0.73, 1.84] |
| 2.2 Croup score (change baseline ‐ 6 hours) by inpatient Show forest plot | 2 | 63 | Std. Mean Difference (IV, Random, 95% CI) | ‐0.10 [‐1.18, 0.97] |
| 2.2.1 Inpatient | 2 | 63 | Std. Mean Difference (IV, Random, 95% CI) | ‐0.10 [‐1.18, 0.97] |
| 2.3 Croup score (change baseline ‐ 12 hours) by inpatient Show forest plot | 3 | 129 | Std. Mean Difference (IV, Random, 95% CI) | ‐0.07 [‐0.57, 0.43] |
| 2.3.1 Inpatient | 3 | 129 | Std. Mean Difference (IV, Random, 95% CI) | ‐0.07 [‐0.57, 0.43] |
| 2.4 Croup score (change baseline ‐ 24 hours) by inpatient Show forest plot | 3 | 129 | Std. Mean Difference (IV, Random, 95% CI) | 0.17 [‐0.18, 0.51] |
| 2.4.1 Inpatient | 3 | 129 | Std. Mean Difference (IV, Random, 95% CI) | 0.17 [‐0.18, 0.51] |
| 2.5 Croup score (change baseline ‐ 2 hours) by glucocorticoid Show forest plot | 2 | 130 | Std. Mean Difference (IV, Random, 95% CI) | 0.88 [0.13, 1.63] |
| 2.5.1 Budesonide | 1 | 66 | Std. Mean Difference (IV, Random, 95% CI) | 0.26 [‐0.22, 0.75] |
| 2.5.2 Dexamethasone | 1 | 31 | Std. Mean Difference (IV, Random, 95% CI) | 1.13 [0.35, 1.91] |
| 2.5.3 Beclomethasone | 1 | 33 | Std. Mean Difference (IV, Random, 95% CI) | 1.41 [0.62, 2.19] |
| 2.6 Croup score (change baseline ‐ 12 hours) by glucocorticoid Show forest plot | 3 | 129 | Std. Mean Difference (IV, Random, 95% CI) | ‐0.07 [‐0.57, 0.43] |
| 2.6.1 Budesonide | 1 | 66 | Std. Mean Difference (IV, Random, 95% CI) | 0.02 [‐0.47, 0.50] |
| 2.6.2 Dexamethasone | 2 | 63 | Std. Mean Difference (IV, Random, 95% CI) | ‐0.14 [‐1.09, 0.82] |
| 2.7 Croup score (change baseline ‐ 24 hours) by glucocorticoid Show forest plot | 3 | 129 | Std. Mean Difference (IV, Random, 95% CI) | 0.17 [‐0.18, 0.51] |
| 2.7.1 Budesonide | 1 | 66 | Std. Mean Difference (IV, Random, 95% CI) | 0.21 [‐0.27, 0.70] |
| 2.7.2 Dexamethasone | 2 | 63 | Std. Mean Difference (IV, Random, 95% CI) | 0.12 [‐0.38, 0.61] |
| 2.8 Return visits or (re)admissions or both by inpatient/outpatient Show forest plot | 2 | 130 | Risk Difference (M‐H, Random, 95% CI) | 0.00 [‐0.04, 0.04] |
| 2.8.1 Inpatient | 1 | 66 | Risk Difference (M‐H, Random, 95% CI) | 0.00 [‐0.06, 0.06] |
| 2.8.2 Outpatient | 1 | 64 | Risk Difference (M‐H, Random, 95% CI) | 0.00 [‐0.06, 0.06] |
| 2.9 Length of stay by inpatient Show forest plot | 1 | 32 | Mean Difference (IV, Random, 95% CI) | ‐10.00 [‐33.89, 13.89] |
| 2.9.1 Inpatient | 1 | 32 | Mean Difference (IV, Random, 95% CI) | ‐10.00 [‐33.89, 13.89] |
| 2.10 Additional treatments: epinephrine Show forest plot | 1 | 66 | Risk Ratio (M‐H, Random, 95% CI) | 0.30 [0.03, 2.69] |
| 2.11 Additional treatments: intubation/tracheostomy Show forest plot | 1 | 66 | Risk Difference (M‐H, Random, 95% CI) | 0.00 [‐0.06, 0.06] |
| 2.12 Additional treatments: supplemental glucocorticoids Show forest plot | 1 | 66 | Risk Ratio (M‐H, Random, 95% CI) | 0.83 [0.48, 1.43] |
| Outcome or subgroup title | No. of studies | No. of participants | Statistical method | Effect size |
| 3.1 Croup score (change baseline ‐ 6 hours) by inpatient/outpatient Show forest plot | 4 | 326 | Std. Mean Difference (IV, Random, 95% CI) | ‐0.46 [‐0.79, ‐0.13] |
| 3.1.1 Inpatient | 2 | 97 | Std. Mean Difference (IV, Random, 95% CI) | ‐0.63 [‐1.04, ‐0.22] |
| 3.1.2 Outpatient | 2 | 229 | Std. Mean Difference (IV, Random, 95% CI) | ‐0.36 [‐0.90, 0.18] |
| 3.2 Croup score (change baseline ‐ 12 hours) by inpatient Show forest plot | 2 | 84 | Std. Mean Difference (IV, Random, 95% CI) | ‐0.75 [‐1.19, ‐0.30] |
| 3.2.1 Inpatient | 2 | 84 | Std. Mean Difference (IV, Random, 95% CI) | ‐0.75 [‐1.19, ‐0.30] |
| 3.3 Return visits or (re)admissions or both by inpatient/outpatient Show forest plot | 5 | 374 | Risk Ratio (M‐H, Random, 95% CI) | 0.69 [0.40, 1.22] |
| 3.3.1 Inpatient | 2 | 95 | Risk Ratio (M‐H, Random, 95% CI) | 0.64 [0.14, 2.79] |
| 3.3.2 Outpatient | 3 | 279 | Risk Ratio (M‐H, Random, 95% CI) | 0.71 [0.38, 1.30] |
| 3.4 Length of stay by inpatient/outpatient Show forest plot | 2 | 184 | Mean Difference (IV, Random, 95% CI) | ‐0.51 [‐1.28, 0.25] |
| 3.4.1 Inpatient | 1 | 50 | Mean Difference (IV, Random, 95% CI) | ‐1.00 [‐1.93, ‐0.07] |
| 3.4.2 Outpatient | 1 | 134 | Mean Difference (IV, Random, 95% CI) | ‐0.20 [‐0.78, 0.38] |
| 3.5 Improvement (at 6 hours) by outpatient Show forest plot | 1 | 134 | Risk Ratio (M‐H, Random, 95% CI) | 1.12 [0.93, 1.34] |
| 3.5.1 Outpatient | 1 | 134 | Risk Ratio (M‐H, Random, 95% CI) | 1.12 [0.93, 1.34] |
| 3.6 Additional treatments: epinephrine Show forest plot | 4 | 321 | Risk Ratio (M‐H, Random, 95% CI) | 0.45 [0.21, 0.96] |
| 3.7 Additional treatments: intubation/tracheostomy Show forest plot | 2 | 145 | Risk Difference (M‐H, Random, 95% CI) | 0.00 [‐0.04, 0.04] |
| 3.8 Additional treatments: supplemental glucocorticoids Show forest plot | 3 | 240 | Risk Ratio (M‐H, Random, 95% CI) | 0.48 [0.18, 1.32] |
| Outcome or subgroup title | No. of studies | No. of participants | Statistical method | Effect size |
| 4.1 Return visits or (re)admissions or both by outpatient Show forest plot | 1 | 39 | Risk Difference (M‐H, Random, 95% CI) | 0.00 [‐0.09, 0.09] |
| 4.1.1 Outpatient | 1 | 39 | Risk Difference (M‐H, Random, 95% CI) | 0.00 [‐0.09, 0.09] |
| Outcome or subgroup title | No. of studies | No. of participants | Statistical method | Effect size |
| 5.1 Croup score (change baseline ‐ 2 hours) by outpatient Show forest plot | 1 | 52 | Std. Mean Difference (IV, Random, 95% CI) | ‐0.62 [‐1.17, ‐0.06] |
| 5.1.1 Outpatient | 1 | 52 | Std. Mean Difference (IV, Random, 95% CI) | ‐0.62 [‐1.17, ‐0.06] |
| 5.2 Croup score (change baseline ‐ 6 hours) by outpatient Show forest plot | 1 | 52 | Std. Mean Difference (IV, Random, 95% CI) | ‐0.67 [‐1.23, ‐0.11] |
| 5.2.1 Outpatient | 1 | 52 | Std. Mean Difference (IV, Random, 95% CI) | ‐0.67 [‐1.23, ‐0.11] |
| 5.3 Return visits or (re)admissions or both by outpatient Show forest plot | 1 | 52 | Risk Ratio (M‐H, Random, 95% CI) | 0.95 [0.67, 1.34] |
| 5.3.1 Outpatient | 1 | 52 | Risk Ratio (M‐H, Random, 95% CI) | 0.95 [0.67, 1.34] |
| 5.4 Additional treatments: epinephrine Show forest plot | 1 | 52 | Risk Ratio (M‐H, Random, 95% CI) | 2.11 [1.18, 3.76] |
| Outcome or subgroup title | No. of studies | No. of participants | Statistical method | Effect size |
| 6.1 Croup score (change baseline ‐ 2 hours) by outpatient Show forest plot | 1 | 1231 | Std. Mean Difference (IV, Random, 95% CI) | 0.06 [‐0.06, 0.18] |
| 6.1.1 Outpatient | 1 | 1231 | Std. Mean Difference (IV, Random, 95% CI) | 0.06 [‐0.06, 0.18] |
| 6.2 Croup score (change baseline ‐ 6 hours) by outpatient Show forest plot | 1 | 99 | Std. Mean Difference (IV, Random, 95% CI) | 0.21 [‐0.21, 0.62] |
| 6.2.1 Outpatient | 1 | 99 | Std. Mean Difference (IV, Random, 95% CI) | 0.21 [‐0.21, 0.62] |
| 6.3 Return visits or (re)admissions or both by outpatient Show forest plot | 4 | 1537 | Risk Ratio (M‐H, Random, 95% CI) | 0.55 [0.28, 1.11] |
| 6.3.1 Outpatient | 4 | 1537 | Risk Ratio (M‐H, Random, 95% CI) | 0.55 [0.28, 1.11] |
| 6.4 Length of stay by outpatient Show forest plot | 2 | 1363 | Mean Difference (IV, Random, 95% CI) | ‐0.02 [‐0.42, 0.39] |
| 6.4.1 Outpatients | 2 | 1363 | Mean Difference (IV, Random, 95% CI) | ‐0.02 [‐0.42, 0.39] |
| 6.5 Additional treatments: epinephrine Show forest plot | 3 | 1463 | Risk Ratio (M‐H, Random, 95% CI) | 0.90 [0.50, 1.64] |
| 6.6 Additional treatments: intubation/tracheotomy Show forest plot | 1 | 1231 | Risk Difference (M‐H, Random, 95% CI) | 0.00 [‐0.00, 0.00] |
| 6.7 Additional treatments: supplemental glucocorticoids Show forest plot | 2 | 926 | Risk Ratio (M‐H, Random, 95% CI) | 0.72 [0.53, 0.97] |
| Outcome or subgroup title | No. of studies | No. of participants | Statistical method | Effect size |
| 7.1 Croup score (change baseline ‐ 6 hours) by inpatient/outpatient Show forest plot | 3 | 255 | Std. Mean Difference (IV, Random, 95% CI) | 0.05 [‐0.19, 0.30] |
| 7.1.1 Inpatient | 1 | 72 | Std. Mean Difference (IV, Random, 95% CI) | 0.16 [‐0.30, 0.63] |
| 7.1.2 Outpatient | 2 | 183 | Std. Mean Difference (IV, Random, 95% CI) | 0.03 [‐0.32, 0.39] |
| 7.2 Return visits or (re)admissions or both by inpatient/outpatient Show forest plot | 3 | 254 | Risk Ratio (M‐H, Random, 95% CI) | 0.91 [0.45, 1.83] |
| 7.2.1 Inpatient | 1 | 71 | Risk Ratio (M‐H, Random, 95% CI) | 1.03 [0.46, 2.29] |
| 7.2.2 Outpatient | 2 | 183 | Risk Ratio (M‐H, Random, 95% CI) | 0.58 [0.13, 2.60] |
| 7.3 Length of stay by inpatient/outpatient Show forest plot | 2 | 204 | Mean Difference (IV, Random, 95% CI) | 0.44 [‐0.05, 0.92] |
| 7.3.1 Inpatient | 1 | 71 | Mean Difference (IV, Random, 95% CI) | ‐1.30 [‐6.75, 4.15] |
| 7.3.2 Outpatient | 1 | 133 | Mean Difference (IV, Random, 95% CI) | 0.45 [‐0.04, 0.94] |
| 7.4 Improvement (at 6 hours) by outpatient Show forest plot | 2 | 183 | Risk Ratio (M‐H, Random, 95% CI) | 1.11 [0.65, 1.90] |
| 7.4.1 Outpatient | 2 | 183 | Risk Ratio (M‐H, Random, 95% CI) | 1.11 [0.65, 1.90] |
| 7.5 Additional treatments: epinephrine Show forest plot | 2 | 183 | Risk Ratio (M‐H, Random, 95% CI) | 1.42 [0.27, 7.39] |
| 7.6 Additional treatments: mist tent Show forest plot | 1 | 50 | Risk Ratio (M‐H, Random, 95% CI) | 1.07 [0.69, 1.65] |
| 7.7 Additional treatments: supplemental glucocorticoids Show forest plot | 2 | 182 | Risk Ratio (M‐H, Random, 95% CI) | 1.10 [0.07, 16.66] |
| Outcome or subgroup title | No. of studies | No. of participants | Statistical method | Effect size |
| 8.1 Croup score (change baseline ‐ 6 hours) by outpatient Show forest plot | 1 | 129 | Std. Mean Difference (IV, Random, 95% CI) | ‐0.18 [‐0.52, 0.17] |
| 8.1.1 Outpatient | 1 | 129 | Std. Mean Difference (IV, Random, 95% CI) | ‐0.18 [‐0.52, 0.17] |
| 8.2 Return visits or (re)admissions or both by outpatient Show forest plot | 1 | 129 | Risk Difference (M‐H, Random, 95% CI) | 0.00 [‐0.03, 0.03] |
| 8.2.1 Outpatient | 1 | 129 | Risk Difference (M‐H, Random, 95% CI) | 0.00 [‐0.03, 0.03] |
| 8.3 Length of stay by outpatient Show forest plot | 1 | 129 | Mean Difference (IV, Random, 95% CI) | 0.25 [‐0.36, 0.86] |
| 8.3.1 Outpatient | 1 | 129 | Mean Difference (IV, Random, 95% CI) | 0.25 [‐0.36, 0.86] |
| 8.4 Improvement (at 6 hours) by outpatient Show forest plot | 1 | 129 | Risk Ratio (M‐H, Random, 95% CI) | 0.97 [0.79, 1.20] |
| 8.4.1 Outpatient | 1 | 129 | Risk Ratio (M‐H, Random, 95% CI) | 0.97 [0.79, 1.20] |
| 8.5 Additional treatments: epinephrine Show forest plot | 1 | 129 | Risk Ratio (M‐H, Random, 95% CI) | 1.02 [0.15, 6.99] |
| 8.6 Additional treatments: supplemental glucocorticoids Show forest plot | 1 | 129 | Risk Ratio (M‐H, Random, 95% CI) | 1.31 [0.52, 3.29] |
| Outcome or subgroup title | No. of studies | No. of participants | Statistical method | Effect size |
| 9.1 Return visits or (re)admissions or both by outpatient Show forest plot | 3 | 440 | Risk Ratio (M‐H, Random, 95% CI) | 0.81 [0.58, 1.12] |
| 9.1.1 Outpatient | 3 | 440 | Risk Ratio (M‐H, Random, 95% CI) | 0.81 [0.58, 1.12] |
| 9.2 Improvement (at 24 hours) by outpatient Show forest plot | 1 | 95 | Risk Ratio (M‐H, Random, 95% CI) | 1.07 [0.95, 1.19] |
| 9.2.1 Outpatient | 1 | 95 | Risk Ratio (M‐H, Random, 95% CI) | 1.07 [0.95, 1.19] |
| 9.3 Additional treatments: antibiotics Show forest plot | 1 | 277 | Risk Ratio (M‐H, Random, 95% CI) | 0.14 [0.02, 1.15] |
| 9.4 Additional treatments: epinephrine Show forest plot | 2 | 372 | Risk Ratio (M‐H, Random, 95% CI) | 0.94 [0.71, 1.24] |
| 9.5 Additional treatments: mist tent Show forest plot | 1 | 277 | Risk Ratio (M‐H, Random, 95% CI) | 1.34 [0.31, 5.89] |
| 9.6 Additional treatments: supplemental glucocorticoids Show forest plot | 1 | 277 | Risk Ratio (M‐H, Random, 95% CI) | 1.10 [0.50, 2.41] |
| Outcome or subgroup title | No. of studies | No. of participants | Statistical method | Effect size |
| 10.1 Return visits or (re)admissions or both by outpatient Show forest plot | 1 | 176 | Risk Ratio (M‐H, Random, 95% CI) | 0.39 [0.17, 0.89] |
| 10.1.1 Outpatient | 1 | 176 | Risk Ratio (M‐H, Random, 95% CI) | 0.39 [0.17, 0.89] |
| Outcome or subgroup title | No. of studies | No. of participants | Statistical method | Effect size |
| 11.1 Return visits or (re)admissions or both by outpatient Show forest plot | 1 | 60 | Risk Ratio (M‐H, Random, 95% CI) | 0.94 [0.06, 14.27] |
| 11.1.1 Outpatient | 1 | 60 | Risk Ratio (M‐H, Random, 95% CI) | 0.94 [0.06, 14.27] |
| 11.2 Additional treatments: epinephrine Show forest plot | 1 | 60 | Risk Ratio (M‐H, Random, 95% CI) | 0.43 [0.19, 0.98] |
| 11.3 Additional treatments: supplemental glucocorticoids Show forest plot | 1 | 60 | Risk Difference (M‐H, Random, 95% CI) | 0.00 [‐0.06, 0.06] |
| Outcome or subgroup title | No. of studies | No. of participants | Statistical method | Effect size |
| 12.1 Return visits or (re)admissions or both by outpatient Show forest plot | 1 | 60 | Risk Ratio (M‐H, Random, 95% CI) | 1.40 [0.25, 7.81] |
| 12.1.1 Outpatient | 1 | 60 | Risk Ratio (M‐H, Random, 95% CI) | 1.40 [0.25, 7.81] |
| 12.2 Additional treatments: epinephrine Show forest plot | 1 | 60 | Risk Ratio (M‐H, Random, 95% CI) | 0.78 [0.27, 2.28] |
| 12.3 Additional treatments: supplemental glucocorticoids Show forest plot | 1 | 60 | Risk Ratio (M‐H, Random, 95% CI) | 2.81 [0.12, 66.40] |
| Outcome or subgroup title | No. of studies | No. of participants | Statistical method | Effect size |
| 13.1 Croup score (Westley) (change baseline ‐ 2 hours) by inpatient/outpatient Show forest plot | 2 | 861 | Std. Mean Difference (IV, Random, 95% CI) | ‐0.27 [‐0.76, 0.22] |
| 13.1.1 Inpatient | 1 | 41 | Std. Mean Difference (IV, Random, 95% CI) | ‐0.63 [‐1.25, 0.00] |
| 13.1.2 Outpatient | 1 | 820 | Std. Mean Difference (IV, Random, 95% CI) | ‐0.10 [‐0.23, 0.04] |
| 13.2 Croup score (change baseline ‐ 6 hours) by inpatient/outpatient Show forest plot | 3 | 178 | Std. Mean Difference (IV, Random, 95% CI) | ‐0.45 [‐1.26, 0.35] |
| 13.2.1 Inpatient | 1 | 41 | Std. Mean Difference (IV, Random, 95% CI) | ‐1.43 [‐2.13, ‐0.74] |
| 13.2.2 Outpatient | 2 | 137 | Std. Mean Difference (IV, Random, 95% CI) | ‐0.02 [‐0.35, 0.32] |
| 13.3 Croup score (change baseline ‐ 12 hours) by inpatient/outpatient Show forest plot | 2 | 113 | Std. Mean Difference (IV, Random, 95% CI) | ‐0.60 [‐4.39, 3.19] |
| 13.3.1 Inpatient | 1 | 41 | Std. Mean Difference (IV, Random, 95% CI) | ‐2.55 [‐3.39, ‐1.71] |
| 13.3.2 Outpatient | 1 | 72 | Std. Mean Difference (IV, Random, 95% CI) | 1.32 [0.81, 1.83] |
| 13.4 Croup score (change baseline ‐ 24 hours) by outpatient Show forest plot | 1 | 72 | Std. Mean Difference (IV, Random, 95% CI) | 0.63 [0.16, 1.10] |
| 13.4.1 Outpatient | 1 | 72 | Std. Mean Difference (IV, Random, 95% CI) | 0.63 [0.16, 1.10] |
| 13.5 Return visits or (re)admissions or both by outpatient Show forest plot | 3 | 949 | Risk Ratio (M‐H, Random, 95% CI) | 0.91 [0.71, 1.17] |
| 13.5.1 Outpatient | 3 | 949 | Risk Ratio (M‐H, Random, 95% CI) | 0.91 [0.71, 1.17] |
| 13.6 Length of stay by outpatient Show forest plot | 2 | 892 | Mean Difference (IV, Random, 95% CI) | 0.12 [‐0.32, 0.56] |
| 13.6.1 Outpatient | 2 | 892 | Mean Difference (IV, Random, 95% CI) | 0.12 [‐0.32, 0.56] |
| 13.7 Additional treatments: epinephrine Show forest plot | 2 | 885 | Risk Ratio (M‐H, Random, 95% CI) | 0.78 [0.34, 1.75] |
| 13.8 Additional treatments: intubation/tracheotomy Show forest plot | 2 | 861 | Risk Difference (M‐H, Random, 95% CI) | 0.00 [‐0.00, 0.00] |
| 13.9 Additional treatments: supplemental glucocorticoids Show forest plot | 2 | 617 | Risk Ratio (M‐H, Random, 95% CI) | 0.77 [0.51, 1.15] |