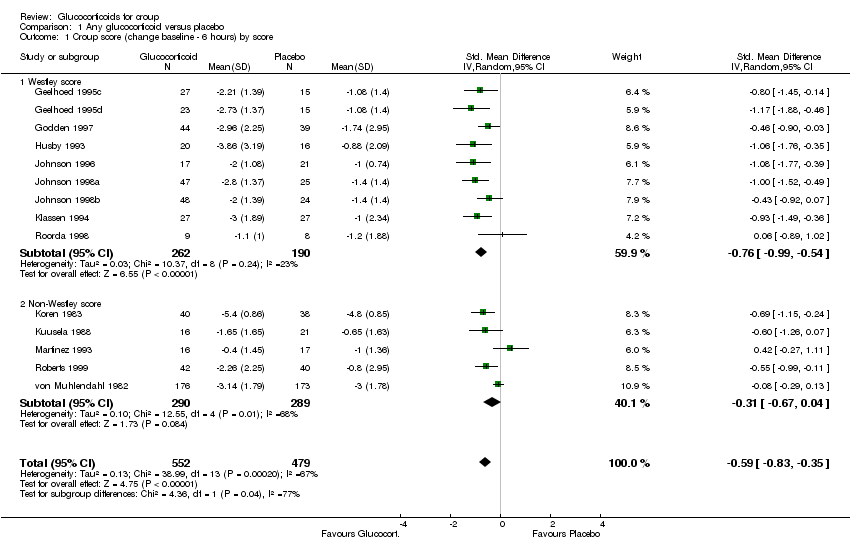
| 1 Croup score (change baseline ‐ 6 hours) by score Show forest plot | 14 | 1031 | Std. Mean Difference (IV, Random, 95% CI) | ‐0.59 [‐0.83, ‐0.35] |
|
| 1.1 Westley score | 9 | 452 | Std. Mean Difference (IV, Random, 95% CI) | ‐0.76 [‐0.99, ‐0.54] |
| 1.2 Non‐Westley score | 5 | 579 | Std. Mean Difference (IV, Random, 95% CI) | ‐0.31 [‐0.67, 0.04] |
| 2 Croup score (change baseline ‐ 12 hours) by score Show forest plot | 8 | 532 | Std. Mean Difference (IV, Random, 95% CI) | ‐0.65 [‐1.03, ‐0.27] |
|
| 2.1 Westley score | 4 | 193 | Std. Mean Difference (IV, Random, 95% CI) | ‐1.17 [‐1.83, ‐0.52] |
| 2.2 Non‐Westley score | 4 | 339 | Std. Mean Difference (IV, Random, 95% CI) | ‐0.22 [‐0.44, ‐0.01] |
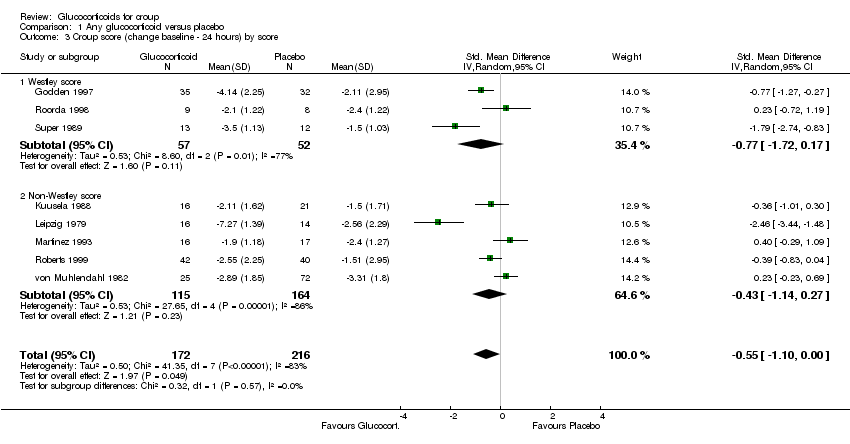
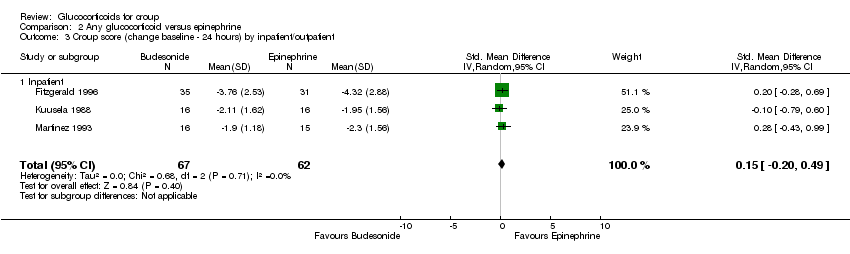
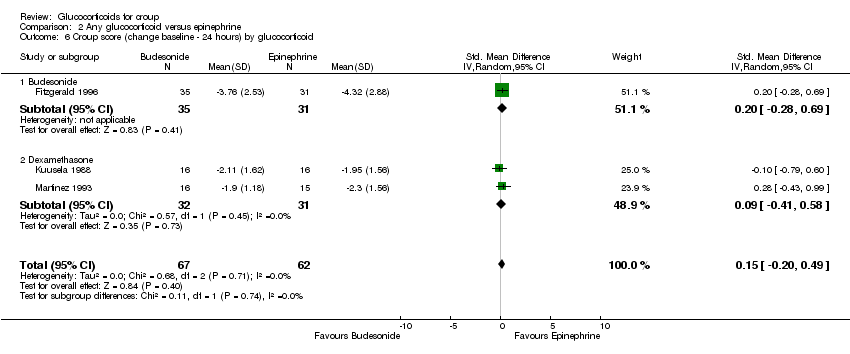
| 3 Croup score (change baseline ‐ 24 hours) by score Show forest plot | 8 | 388 | Std. Mean Difference (IV, Random, 95% CI) | ‐0.55 [‐1.10, ‐0.00] |
|
| 3.1 Westley score | 3 | 109 | Std. Mean Difference (IV, Random, 95% CI) | ‐0.77 [‐1.72, 0.17] |
| 3.2 Non‐Westley score | 5 | 279 | Std. Mean Difference (IV, Random, 95% CI) | ‐0.43 [‐1.14, 0.27] |
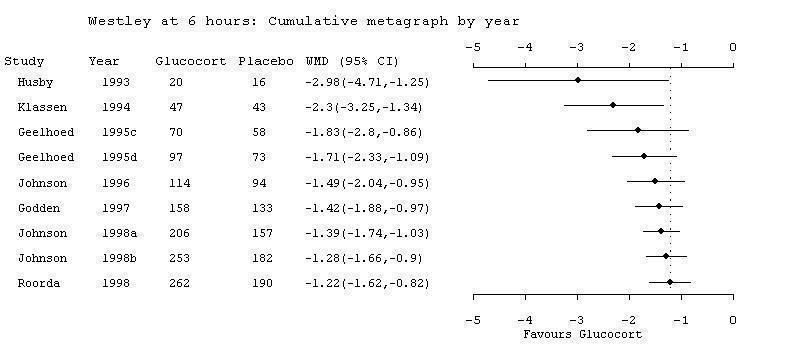
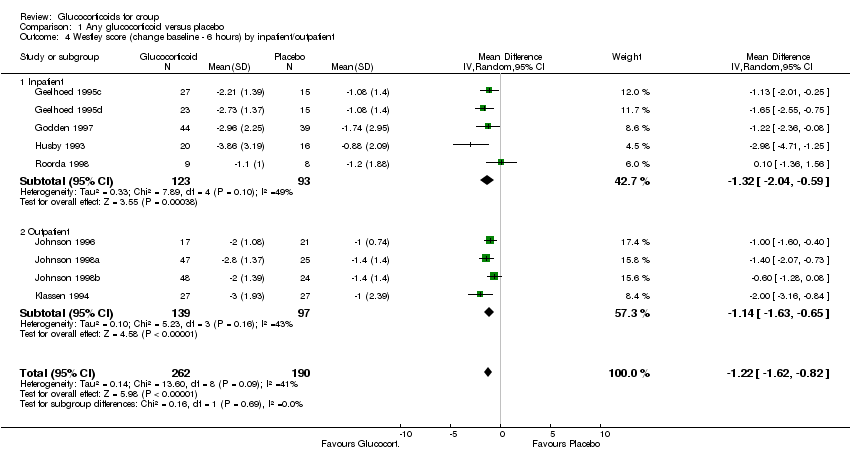
| 4 Westley score (change baseline ‐ 6 hours) by inpatient/outpatient Show forest plot | 9 | 452 | Mean Difference (IV, Random, 95% CI) | ‐1.22 [‐1.62, ‐0.82] |
|
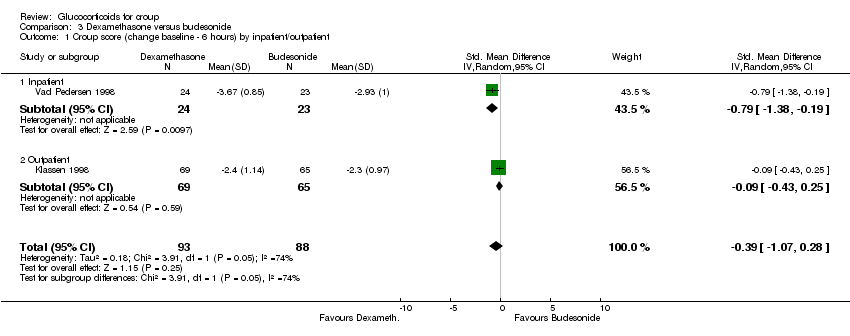
| 4.1 Inpatient | 5 | 216 | Mean Difference (IV, Random, 95% CI) | ‐1.32 [‐2.04, ‐0.59] |
| 4.2 Outpatient | 4 | 236 | Mean Difference (IV, Random, 95% CI) | ‐1.14 [‐1.63, ‐0.65] |
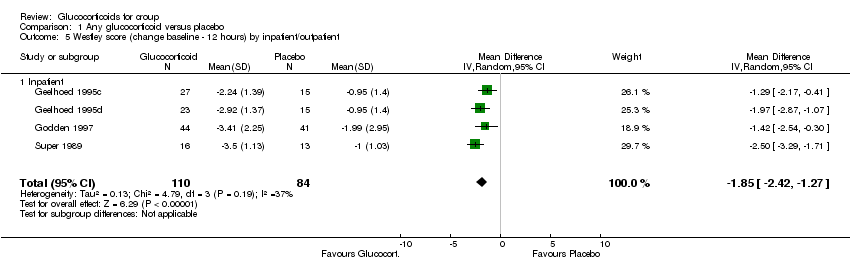
| 5 Westley score (change baseline ‐ 12 hours) by inpatient/outpatient Show forest plot | 4 | 194 | Mean Difference (IV, Random, 95% CI) | ‐1.85 [‐2.42, ‐1.27] |
|
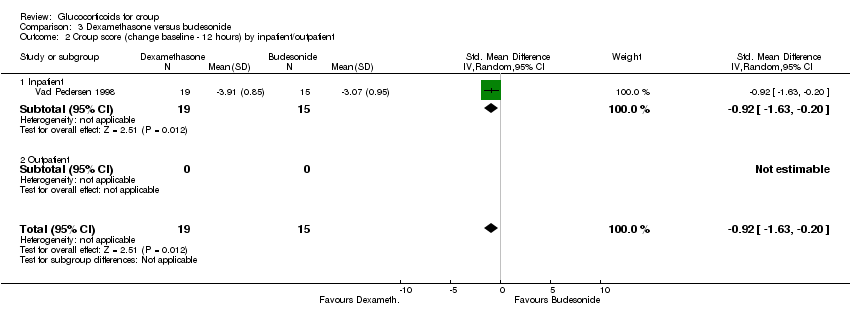
| 5.1 Inpatient | 4 | 194 | Mean Difference (IV, Random, 95% CI) | ‐1.85 [‐2.42, ‐1.27] |
| 6 Westley score (change baseline ‐ 24 hours) by inpatient/outpatient Show forest plot | 3 | 110 | Mean Difference (IV, Random, 95% CI) | ‐1.26 [‐2.73, 0.21] |
|
| 6.1 Inpatient | 3 | 110 | Mean Difference (IV, Random, 95% CI) | ‐1.26 [‐2.73, 0.21] |
| 7 Westley score (change baseline ‐ 6 hours) by glucocorticoid Show forest plot | 9 | 452 | Mean Difference (IV, Random, 95% CI) | ‐1.22 [‐1.62, ‐0.82] |
|
| 7.1 Budesonide | 5 | 287 | Mean Difference (IV, Random, 95% CI) | ‐1.37 [‐2.06, ‐0.68] |
| 7.2 Dexamethasone | 3 | 148 | Mean Difference (IV, Random, 95% CI) | ‐1.27 [‐1.67, ‐0.87] |
| 7.3 Fluticasone | 1 | 17 | Mean Difference (IV, Random, 95% CI) | 0.10 [‐1.36, 1.56] |
| 8 Westley score (change baseline ‐ 12 hours) by glucocorticoid Show forest plot | 4 | 194 | Mean Difference (IV, Random, 95% CI) | ‐1.85 [‐2.42, ‐1.27] |
|
| 8.1 Budesonide | 2 | 127 | Mean Difference (IV, Random, 95% CI) | ‐1.34 [‐2.03, ‐0.65] |
| 8.2 Dexamethasone | 2 | 67 | Mean Difference (IV, Random, 95% CI) | ‐2.27 [‐2.86, ‐1.68] |
| 9 Westley score (change baseline ‐ 24 hours) by glucocorticoid Show forest plot | 3 | 110 | Mean Difference (IV, Random, 95% CI) | ‐1.26 [‐2.73, 0.21] |
|
| 9.1 Budesonide | 1 | 67 | Mean Difference (IV, Random, 95% CI) | ‐2.03 [‐3.30, ‐0.76] |
| 9.2 Dexamethasone | 1 | 26 | Mean Difference (IV, Random, 95% CI) | ‐2.0 [‐2.83, ‐1.17] |
| 9.3 Fluticasone | 1 | 17 | Mean Difference (IV, Random, 95% CI) | 0.30 [‐0.86, 1.46] |
| 10 Return visits and/or (re)admissions by inpatient/outpatient Show forest plot | 10 | 1679 | Risk Ratio (M‐H, Random, 95% CI) | 0.49 [0.34, 0.71] |
|
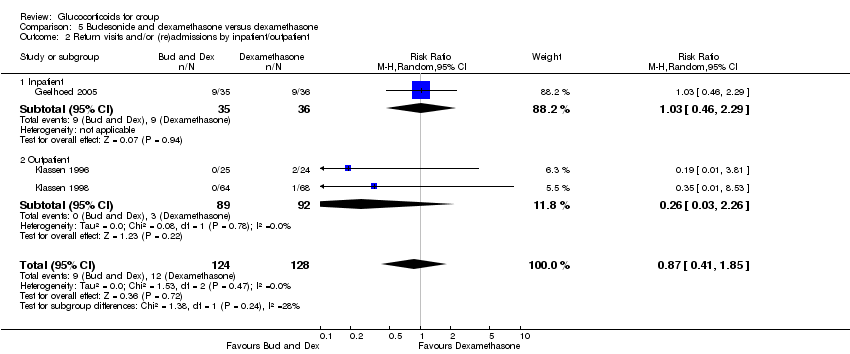
| 10.1 Inpatient | 3 | 326 | Risk Ratio (M‐H, Random, 95% CI) | 0.21 [0.07, 0.68] |
| 10.2 Outpatient | 7 | 1353 | Risk Ratio (M‐H, Random, 95% CI) | 0.53 [0.36, 0.79] |
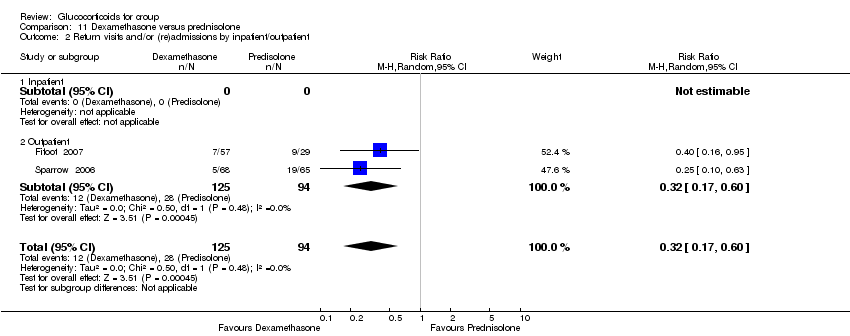
| 11 Return visits and/or (re)admissions by glucocorticoid Show forest plot | 12 | 1681 | Risk Ratio (M‐H, Random, 95% CI) | 0.50 [0.36, 0.70] |
|
| 11.1 Budesonide | 4 | 228 | Risk Ratio (M‐H, Random, 95% CI) | 0.39 [0.17, 0.92] |
| 11.2 Dexamethasone | 8 | 1453 | Risk Ratio (M‐H, Random, 95% CI) | 0.52 [0.34, 0.79] |
| 12 Return visits and/or (re)admissions by croup severity Show forest plot | 12 | 1681 | Risk Ratio (M‐H, Random, 95% CI) | 0.50 [0.36, 0.70] |
|
| 12.1 Mild croup | 3 | 1064 | Risk Ratio (M‐H, Random, 95% CI) | 0.54 [0.30, 0.95] |
| 12.2 Moderate croup | 9 | 617 | Risk Ratio (M‐H, Random, 95% CI) | 0.46 [0.28, 0.75] |
| 13 Length of stay by inpatient/outpatient Show forest plot | 9 | 825 | Mean Difference (IV, Random, 95% CI) | ‐11.73 [‐18.54, ‐4.92] |
|
| 13.1 Inpatient | 8 | 795 | Mean Difference (IV, Random, 95% CI) | ‐10.33 [‐17.31, ‐3.36] |
| 13.2 Outpatient | 1 | 30 | Mean Difference (IV, Random, 95% CI) | ‐21.0 [‐35.55, ‐6.45] |
| 14 Improvement (at 6 hours) by inpatient/outpatient Show forest plot | 6 | 421 | Risk Ratio (M‐H, Random, 95% CI) | 1.42 [1.14, 1.77] |
|
| 14.1 Inpatient | 4 | 224 | Risk Ratio (M‐H, Random, 95% CI) | 1.35 [0.95, 1.93] |
| 14.2 Outpatient | 2 | 197 | Risk Ratio (M‐H, Random, 95% CI) | 1.55 [1.18, 2.03] |
| 15 Improvement (at 12 hours) by inpatient/outpatient Show forest plot | 6 | 340 | Risk Ratio (M‐H, Random, 95% CI) | 1.32 [1.08, 1.61] |
|
| 15.1 Inpatient | 6 | 340 | Risk Ratio (M‐H, Random, 95% CI) | 1.32 [1.08, 1.61] |
| 16 Improvement (at 24 hours) by inpatient/outpatient Show forest plot | 4 | 205 | Risk Ratio (M‐H, Random, 95% CI) | 1.24 [1.06, 1.45] |
|
| 16.1 Inpatient | 4 | 205 | Risk Ratio (M‐H, Random, 95% CI) | 1.24 [1.06, 1.45] |
| 17 Additional treatments Show forest plot | 17 | | Risk Difference (M‐H, Random, 95% CI) | Subtotals only |
|
| 17.1 Intubation/tracheostomy | 11 | 1089 | Risk Difference (M‐H, Random, 95% CI) | ‐0.00 [‐0.01, 0.01] |
| 17.2 Use of antibiotics | 2 | 124 | Risk Difference (M‐H, Random, 95% CI) | 0.00 [‐0.10, 0.10] |
| 17.3 Use of supplemental glucocorticoids | 5 | 221 | Risk Difference (M‐H, Random, 95% CI) | ‐0.04 [‐0.15, 0.07] |
| 17.4 Use of epinephrine | 5 | 464 | Risk Difference (M‐H, Random, 95% CI) | ‐0.10 [‐0.20, ‐0.01] |
| 17.5 Use of mist tent | 2 | 84 | Risk Difference (M‐H, Random, 95% CI) | ‐0.20 [‐0.87, 0.47] |