Terapia del habla y el lenguaje para la afasia posterior al accidente cerebrovascular
References
Referencias de los estudios incluidos en esta revisión
Referencias de los estudios excluidos de esta revisión
Referencias de los estudios en espera de evaluación
Referencias de los estudios en curso
Referencias adicionales
Referencias de otras versiones publicadas de esta revisión
Characteristics of studies
Characteristics of included studies [ordered by study ID]
| Methods | Multicentre RCT stratified by severity of communication impairment and recruiting site, UK | |
| Participants | Inclusion criteria: communication impairment as a result of aphasia, therapist considers able to engage in therapy and likely to benefit, consent Exclusion criteria: subarachnoid haemorrhage, dementia, learning disabilities, non‐English speaker, serious comorbidity, unable to complete screening procedure within 3 attempts or 2 weeks, family or caregiver objection, therapist assessment required prior to trial screening Group 1: 76 participants Group 2: 77 participants Details of participants are shown in Table 1 | |
| Interventions | 1. Conventional SLT Intervention: speech and language therapy. Materials: communication charts, personalised advice booklet, session record, patient life book, AAC devices. Procedures: manualised (assessment, information provision, provision of communication materials, caregiver contact, indirect contact (with MDT), direct contact). Direct remediation of speech and language: impairment (hypothesis‐driven approach to rehabilitation of language skills), activity (compensatory strategies and conversational skills training), and participation (specific exercises) approaches. Promotion of alternative means of communication, support adjustment to communication impairment, improving communication environment. Provided by: 4 therapists. Led by highly experienced speech and language therapists plus delivery by other therapists. Delivery: 1‐to‐1, face‐to‐face, clinic or home. Regimen: Per protocol. 3 sessions (varied length) weekly up to 16 weeks. Delivered average of 22 sessions (18 h) over 13 weeks. Tailoring: individualised. Modification: therapy amount. Adherence: monitored. 2. Social support and stimulation Intervention: 9 part‐time paid trained visitors. Attention control. Materials: approved board games and activities. Procedures: manualised. Participant‐led. Everyday activities building rapport including general conversation and activities (reading to the participant, watching television, playing board games (e.g. chess), creative activities, gardening) TV, music. Plus sessions to prepare participants for cessation of visits. Provided by: trained paid visitors. Delivery: 1‐to‐1, face‐to‐face, hospital and at home. Regimen: Per protocol up to 3 sessions (varied length up to 60 mins) weekly for 16 weeks. Delivered max 45 sessions (average 15 h; 1‐45 contacts, max 41 h) up to 16 weeks. Tailoring: yes. Individualised. Modification: amount of visits (above). Adherence: monitored | |
| Outcomes | Primary outcomes: functional communication; expert blinded therapist rating of semi‐structured conversation using TOMs Data collection: baseline and 6 months postrandomisation | |
| Notes | Additional participants with dysarthria (no aphasia) were also randomised to the 2 interventions, but data from these individuals have not been included within this review Dropouts are detailed in Table 2 Statistical data included within the review meta‐analyses | |
| Risk of bias | ||
| Bias | Authors' judgement | Support for judgement |
| Random sequence generation (selection bias) | Low risk | External, independent, web‐based, stratified by severity of communication impairment (TOM) and recruiting site |
| Allocation concealment (selection bias) | Low risk | External, independent, web‐based |
| Blinding (performance bias and detection bias) | Low risk | Primary outcome rated by expert therapists blinded to allocation |
| Incomplete outcome data (attrition bias) | Low risk | Dropouts accounted for ITT employed |
| Selective reporting (reporting bias) | Low risk | All prespecified outcomes reported |
| Other bias | Low risk | Groups comparable at baseline Sample size calculation reported |
| Methods | Single‐centre cross‐over RCT, stratified by matched pairs, Germany | |
| Participants | Inclusion criteria: moderate to severe aphasia (score on the AAT naming subtest below a percentile rank of 50; and comprehension on the repetition and speech AAT sub‐tests exceeding percentile rank of 30); vascular aetiology; stable general health condition; duration of aphasia of at least 4 months, with severe‐to‐moderate word finding difficulties, irrespective of fluent or nonfluent language production. The criteria also required the participants to be able to understand and repeat simple word stimuli and the existence of no or only minimal motor speech disorder (dysarthria, apraxia of speech, or both). Passed exploratory B.A.Barr training of 60 min over 2 weeks Exclusion criteria: severe semantic disorder or comprehension problems (< 30% rank of the AAT speech comprehension test), severe motor speech disorder or apraxia Group 1: 9 participants Group 2: 9 participants Details of participants are shown in Table 1 | |
| Interventions | 1. Supervised intensive language self training Intervention: computer SLT. Designed to facilitate dialogue skills in everyday life, use of adjacency pairs (Schegloff 2007). The turns are functionally related to each other (e.g. greeting–greeting: "Hello"–"Hi"; leave‐taking‒leave‐taking: "Goodbye"–"Bye!") or information acts (e.g. question–answer: "When is the doctor's office open?"–"From 2 until 5 p.m."). The guiding principle is "talk‐in‐interaction" (Schegloff 2004). Materials: B.A.Bar equipment. Simple electronic device makes use of barcodes that carry linguistic information suited to language learning. Speech of various levels of complexity (words, phrases, sentences, texts) can be recorded, stored, and replayed as often as needed during learning. When a barcode is scanned, the recorded language is replayed to facilitate reproduction. The learning material consisted of short dialogues composed of 3 adjacency pairs: a conventional beginning (e.g. greeting–greeting), a main information part (e.g. question–answer, offer–affirmation), and a conventional ending (e.g. leave‐taking‒leave‐taking). Each half‐day training of dialogues had to be complemented by corresponding vocabulary drill exercises that required auditory word comprehension (word–picture matching) and oral naming.The items were always related to the topics conveyed by the dialogues. The 2 tasks were again carried out by means of barcode scanning. Moreover, the drill exercises contained 6 to 8 items for oral naming and 6 items for comprehension. Procedures: weekly supervision of the home training. B.A.Bar dialogue training. Exercise sheets with dialogues were given to the participants so that learners with aphasia could placethemselves in the role of the responding partner. The home training material consisted of 48 dialogues that represented characteristic scenes from 2 different thematic fields of daily living. Half of the dialogues were related to shopping, food, and drinking, the other half to health and illness. For each thematic field, a separate booklet with practice material containing 24 dialogues was prepared. Booklets were separated into 4 chapters with 2 subchapters each. The participants were instructed to practice the 8 subchapters in sequence, 1 in the morning and 1 in the afternoon, 4 d a week. Thus, every half day, 3 dialogues had to be practiced. During the 4‐week training, the total material was practiced twice: the first thematic field during the 1st and 3rd week and the second thematic field during the 2nd and 4th week. Provided by: B.A.Bar Equipment, which reads barcodes provided to therapists in private practice for use with randomised patients. Each therapist received 1 h of training before participant began to use B.A.Barr. Delivery: computer‐facilitated, 1 participant using 1 computer at home plus 1 h in clinic with therapist (and no computer). Regimen: practice twice a day for 1 h per session, 4 d per week (for 4 weeks) plus 1 h private session with speech and language therapist. Tailoring: yes. Modification: SLT focused on items described as difficult by patient and selected dialogues practiced. Adherence: monitored through supervision once a week by speech and language therapist in private practice and supported through dialogue, roleplay, review of difficult items, planning of future sessions, self evaluation forms from therapists. 2. Visual‐cognitive tasks Intervention: no SLT. Attention control. Materials non‐linguistic cognitive training focused on basic functions of visual exploration and attention. It involved visual–cognitive exercises such as visual matching of a part to the whole, maze games, comparing 2 pictures to find differences, or searching for target objects in complex pictures. A separate booklet of worksheets was developed for each week of training, again—like the language training—separated into 4 chapters and 8 subchapters. During the 4‐week treatment, the total visual–cognitive material was also practiced twice, the first booklet during the 1st and 3rd week and the second booklet during the 2nd and 4th week. Similar to the language training, the participants recorded the practice time after each session on protocol sheets. Each individual training session was based on a subchapter of the booklet containing 15 exercises: 5 pictures with visual differences, 4 maze games, 3 matching exercises, and 3 searching exercises. The time required to complete 1 session of cognitive training was calculated to be equal to the time needed for 1 session of B.A.Bar language training (approximately 30 min each). It should be noted that the B.A.Bar technology was not used during cognitive training, and feedback on correct solutions was given only during supervision but not during the home training. Procedures: visual–cognitive exercises. Provided by: speech and language therapist supervision, professional. Delivery: 1‐to‐1 and self management; face‐to‐face and self management, at home plus 1 h in clinic. Regimen: practice twice a day for 1 h per session, 4 d per week (for 4 weeks) plus 1 h private clinic session with speech and language therapist. Total dose = 36 h. Tailoring: yes. Modification: cognitive problem‐solving strategies were checked, and alternative strategies were shown to the participants. Adherence: monitored through supervision once a week by speech and language therapist in private practice and supported through diaglogue, roleplay, review of difficult items, planning of future sessions, self evaluation forms from therapists. | |
| Outcomes | Primary outcome: dialogue test for communicative success and linguistic accuracy Data collection: baseline, T1, T2, T3, follow‐up assessment at 12 weeks | |
| Notes | Statistical data included within the review meta‐analyses | |
| Risk of bias | ||
| Bias | Authors' judgement | Support for judgement |
| Random sequence generation (selection bias) | Unclear risk | Members of each pair were randomly assigned to groups |
| Allocation concealment (selection bias) | Unclear risk | Not reported |
| Blinding (performance bias and detection bias) | Low risk | Speech and language therapist blinded |
| Incomplete outcome data (attrition bias) | Low risk | No dropouts |
| Selective reporting (reporting bias) | Low risk | All prespecified outcomes reported |
| Other bias | Unclear risk | Groups comparable at baseline for gender, age, duration of aphasia, and severity and type of aphasia according to performance on the AAT Power calculation confirmed (unpublished data). |
| Methods | Single‐centre cross‐over RCT, stratified by matched pairs, Germany | |
| Participants | Inclusion criteria: moderate to severe aphasia (score on the AAT naming subtest below a percentile rank of 50; and comprehension on the repetition and speech AAT sub‐tests exceeding percentile rank of 30); vascular aetiology; stable general health condition; duration of aphasia of at least 4 months, with severe‐to‐moderate word finding difficulties, irrespective of fluent or nonfluent language production. The criteria also required the participants to be able to understand and repeat simple word stimuli and the existence of no or only minimal motor speech disorder (dysarthria, apraxia of speech, or both). Passed exploratory B.A.Barr training of 60 min over 2 weeks Exclusion criteria: severe semantic disorder or comprehension problems (< 30% rank of the AAT speech comprehension test), severe motor speech disorder or apraxia Group 1: 9 participants Group 2: 9 participants Details of participants are shown in Table 1 | |
| Interventions | 1. B.A.Bar Early + visual‐cognitive exercises Intervention: early SLT. Supervised intensive language self training followed by home training with visual‐cognitive exercises. Materials: described in B.A.Bar 2011i. Procedures: described in detail in B.A.Bar 2011i. Provided by: described in detail in B.A.Bar 2011i. Delivery: 1 to computer or workbook, B.A. Bar Equipment, which reads barcodes, computer‐facilitated and workbooks at home, followed by period of self management and face‐to‐face, at home plus 1 h in clinic followed by cognitive training at home. Regimen: practice twice a day for 1 h per session, 4 d per week (for 4 weeks) plus 1 h private clinic session with therapist. Total dose = 32 h. B.A. Bar + 4 h with speech and language therapist working on dialogue training in roleplays without B.A. Bar + 32 h of visual‐cog therapy + 4 h of speech and language therapist looking at cognitive training strategies. Tailoring: yes. Modification: speech and language therapist focused on items described as difficult by participant and selected dialogues practiced. Adherence: not reported 2. Supervised home training with visual‐cognitive exercises followed by delayed intensive language self training Intervention: delayed SLT. Materials: computer SLT and home training (described in B.A.Bar 2011i). Procedures: described in detail in B.A.Bar 2011i. Provided by: described in detail in B.A.Bar 2011i. Delivery: 1 to computer or workbook, B.A. Bar Equipment, which reads barcodes, computer‐facilitated and workbooks at home, followed by period of self management and face‐to‐face, at home plus 1 h in clinic followed by cognitive training at home.Regimen: practice twice a day for 1 h per session, 4 d per week (for 4 weeks) plus 1 h private clinic session with speech and language therapist. Total dose = 32 h B.A. Bar + 4 h with speech and language therapist working on dialogue training in roleplays without B.A. Bar plus 32 h of visual‐cognitive therapy + 4 h of speech and language therapist looking at cognitive training strategies. Tailoring: yes. Modification: speech and language therapist focused on items described as difficult by participant and selected dialogues practiced. Adherence: not reported. | |
| Outcomes | Primary outcome: dialogue test for communicative success and linguistic accuracy Data collection: baseline, T1, T2, T3, follow‐up assessment at 12 weeks | |
| Notes | Statistical data included within the review meta‐analyses | |
| Risk of bias | ||
| Bias | Authors' judgement | Support for judgement |
| Random sequence generation (selection bias) | Unclear risk | Members of each pair were randomly assigned to groups |
| Allocation concealment (selection bias) | Unclear risk | Not reported |
| Blinding (performance bias and detection bias) | Low risk | Speech and language therapist blinded |
| Incomplete outcome data (attrition bias) | Low risk | No dropouts |
| Selective reporting (reporting bias) | Low risk | All prespecified outcomes reported |
| Other bias | Unclear risk | Groups comparable at baseline for sex, age, duration of aphasia, and severity and type of aphasia according to performance on the AAT Power calculation not reported |
| Methods | RCT, UK | |
| Participants | Inclusion criteria: first stroke, below normal on WAB, native English speaker, medically stable, fit for participation Details of participants are shown in Table 1 | |
| Interventions | 1. High‐intensity SLT Intervention: high‐intensity SLT. Neuroplasticity enhanced via intensive behavioural treatment. Materials: picture‐object selection, object naming, communication aids and equipment. Procedures: picture‐object selection, object naming, recognition and associations; expression of feelings and opinions; conversational skills; gestural and non‐verbal communication (including communication aids and equipment). Provided by: speech and language therapists. Delivery: 1‐to‐1, face‐to‐face; hospital rehabilitation unit, outpatient or home. Regimen: 1 h therapy, 5 sessions weekly for 12 weeks. Total dose = 60 h therapy. Tailoring: individualised. Modification: individualised. Adherence: yes. Method not reported. 2. Conventional SLT Intervention: SLT Materials: picture‐object selection, object naming, communication aids and equipment. Procedures: tasks included picture‐object selection, object naming, recognition and associations; expression of feelings and opinions; improving conversational skills; gestural and non‐verbal communication (including communication aids and equipment). Provided by: speech and language therapists. Delivery: 1‐to‐1, face‐to‐face; hospital rehabilitation unit, outpatient or home. Regimen: 1 h therapy, 2 sessions weekly for 12 weeks. Total dose = 24 h therapy. Tailoring: individualised. Modification: individualised. Adherence: yes. Method not reported. | |
| Outcomes | Primary outcome: WAB Data collection: baseline and weeks 4, 8, 12 and 24 | |
| Notes | A further 'NHS group' was not randomised (first 6 consecutive participants allocated to this group) and were therefore excluded from this review Statistical data included within the review meta‐analyses | |
| Risk of bias | ||
| Bias | Authors' judgement | Support for judgement |
| Random sequence generation (selection bias) | Low risk | Random numbers table |
| Allocation concealment (selection bias) | Low risk | Sequentially numbered sealed envelopes |
| Blinding (performance bias and detection bias) | Low risk | Outcome assessors blinded |
| Incomplete outcome data (attrition bias) | High risk | Authors reported that ITT analysis employed but not all participants appeared to be included in the final analyses |
| Selective reporting (reporting bias) | Low risk | All prespecified outcomes reported |
| Other bias | Unclear risk | Sample size calculation not reported Groups comparable at baseline Conventional group had 11 dropouts from the allocated intervention |
| Methods | Multicentre RCT stratified by severity of aphasia (mild/moderate/severe) and time poststroke (< 2 years/≥ 2 years), UK | |
| Participants | Inclusion criteria: diagnosis of stroke and aphasia with word‐finding difficulties as 1 of the predominant features as assessed by the Object and Action Naming Battery and the Comprehensive Aphasia Test (Druks 2000; Swinburn 2004, respectively). Participants were included only if they had the ability to repeat spoken words presented by the recruiting speech and language therapist. Eligible participants no longer received impairment‐focused speech and language therapy enabling the computer treatment to be better isolated and evaluated. Participants with motor deficits poststroke were not excluded from the study. Where upper limb impairments made physical manipulation of the computer hardware difficult, assistive devices such as tracker balls or touchscreen computers were offered to enable access to the computer treatment Exclusion criteria: 3 people with severe visual or cognitive difficulties reducing ability to use the computer programme were excluded from the study, tested by the ability to see and perform a simple, nonlanguage‐based computer game Group 1: 16 participants Details of participants are shown in Table 1 | |
| Interventions | 1. Computer‐mediated word finding therapy Intervention: StepbyStep. Computer programmes developed for the treatment of aphasia provide exercises that can be carried out on a regular basis, targeting personal vocabulary and focusing on the patient's conversational needs. Such software has been reported to be useful in the provision of intensive independent language practice, giving rise to new opportunities to provide self management of continued aphasia treatment. There is growing evidence to suggest that the use of aphasia software can help to improve outcomes in language domains including reading, spelling, and expressive language. Materials: usual language activities (as described in no SLT arm). In addition, they received speech and language therapy intervention delivered through independent use of a computer therapy programme (StepbyStep) configured by a speech and language therapist and supported by a volunteer. A library of more than 13,000 language exercises. Photographic images can be added to enable practice of personally relevant words such as names of people and pets. The intervention group practiced Object and Action Naming battery words during the treatment (Druks 2000). In addition, participants in the intervention group practiced 48 words of personal relevance. Procedures: each exercise follows steps progressing from listening to target words, producing words with visual, semantic, phonemic, or written letter/word cues through to saying the words in sentences. Speech and language therapist also provided initial instruction to the participant and caregiver on how to use the computer exercises and progress through the therapy steps. Volunteers provided assistance in using the software and hardware, encouragement to practice, and activities to promote use of the new words in daily life. Provided by: speech and language therapist tailored the steps in the therapy process. Volunteers provided assistance in using the software and hardware, encouragement to practice, and activities to promote use of the new words in daily life. Volunteers contacted the participants once a week in the first month and at least once a month thereafter by telephone or home visit. Speech and language therapists trained. Volunteers included SLT students and existing volunteers from communication support groups. Volunteers were given a 3 h training session on how to use the StepbyStep programme and their role in supporting the intervention. Delivery: 1‐to‐1, computer facilitated. Speech and language therapist supported face‐to‐face, at home. Regimen: per protocol: 20 minutes 3 d a week for 5 months (approximately 1500 minutes of practice time in total). Volunteers contacted the participants once a week in the first month and at least once a month thereafter by telephone or home visit. Total dose = 25 h therapy. Tailoring: yes. Speech and language therapist tailored the steps in the therapy process as appropriate to the abilities and needs of the individual participant and provided initial instruction to the participant and caregiver on how to use the computer exercises and progress through the therapy steps.as appropriate to the abilities and needs of the individual. Modification: tailored choice of words and level of difficulty. Adherence: collected data via computer programme 2. No SLT Intervention: No formal SLT. Participation in everyday communication tasks and for some participants this may include attendance at communication support groups and conversation, reading, and writing activities that are part of everyday life.Materials: none. Procedures: none. Provided by: none (volunteers if attending local group) Delivery: not reported. Regimen: none. Tailoring: none. Modification: none. Adherence: not applicable | |
| Outcomes | Primary outcomes: feasibility of carrying out the study design and using self managed computer treatment supported by volunteers as a long‐term intervention. Primary measures of feasibility were the recruitment rate, completion rates, and statistical variability. Outcomes indicating feasibility of the intervention included the percentage of the eligible population interested in receiving the intervention, the ability to offer the intervention per protocol (provision of computer software and volunteer support), and the ability of the participants to carry out the intervention per protocol (using the computer for at least 20 min 3 times a week for 5 months). Amount of practice time was stored by the StepbyStep computer software automatically and reviewed by a speech and language therapist at the end of treatment | |
| Notes | Dropouts are detailed in Table 2 Statistical data included within the review meta‐analyses | |
| Risk of bias | ||
| Bias | Authors' judgement | Support for judgement |
| Random sequence generation (selection bias) | Low risk | Web‐based randomisation system. Stratified randomisation based on severity of aphasia (mild/moderate/severe) and time poststroke (< 2 years/ > 2 years) |
| Allocation concealment (selection bias) | Low risk | Adequate |
| Blinding (performance bias and detection bias) | Low risk | Baseline assessments were conducted before randomisation, and assessment of outcomes undertaken blind to baseline and treatment allocation by blinded speech and language therapists |
| Incomplete outcome data (attrition bias) | Low risk | Dropouts accounted for; ITT analysis employed |
| Selective reporting (reporting bias) | Low risk | All prespecified outcomes reported |
| Other bias | Low risk | Groups were comparable at baseline in terms of severity, sex, age, time postonset Pilot study so not possible to perform power calculation in advance but used data to calculate future sample size No other obvious bias |
| Methods | RCT, USA | |
| Participants | Inclusion criteria: 18 years of age or older, diagnosis of mild‐severe aphasia (1 or 2/3 on NIHSS), damage to left MCA area, first infarct, any dysarthria had to be less severe than their aphasia (as per NIHSS), able to follow commands, ability to sing at least 25% of Happy Birthday, demonstrate awareness of speech problems, English as their first language Details of participants are shown in Table 1 | |
| Interventions | 1. Modified Melodic Intonation Therapy (MMIT) Intervention: MMIT. MIT has received positive reports. Modifications to original MIT approach include therapist composition and use of novel melodic phrases that match prosody of spoken phrases in pitch and rhythm, use of full phrases during initial treatment to facilitate access to intact areas of brain, and early introduction poststroke. Materials: not reported. Procedures: session 1: 10‐15 minutes MMIT. 1 phrase training. Therapist modelled phrase multiple times then asked participant to sing. Participant assisted by therapist to tap rhythm of phrase with their left hand to provide added cue. Subsequent sessions could add more phrases. Provided by: board‐certified music therapist trained in MMIT. Delivery: 1‐to‐1, face‐to‐face, hospital. Regimen: protocol allowed for up to 5 sessions but not more than 3 delivered due to logistics and early discharge. Duration of individual sessions were 10‐15 mins (up to 45 min max). Tailoring: only in terms of progressive complexity/number of phrases. Modification: none. Adherence: no mention of any practice tasks. No mention of measures of adherence or fidelity. No report of all 5 sessions delivered as planned 2. No SLT Intervention: no SLT. Placebo control. Materials: none. Procedures: discussion on patient impairment, different forms of treatment, different outcomes, issues arising from aphasia. Provided by: board‐certified music therapist trained in MMIT. Delivery: 1‐to‐1, face‐to‐face, location not reported. Regimen: single discussion, duration 10‐15 min. Tailoring: not reported. Modification: not reported. Adherence: not reported | |
| Outcomes | Primary outcomes: in‐trial developed assessment tool: repetition and responsiveness Secondary outcomes: Semantic Fluency Test, Controlled Oral Word Association Test, complex ideational subtest of the BDAE, Peabody Picture Vocabulary Test Data collection: baseline, 1 week prior to intervention, within 1 week of intervention. Follow‐up 3 months after intervention | |
| Notes | Dropouts are detailed in Table 2 Suitable statistical data permitting inclusion within the review meta‐analyses unavailable | |
| Risk of bias | ||
| Bias | Authors' judgement | Support for judgement |
| Random sequence generation (selection bias) | Low risk | Random numbers table |
| Allocation concealment (selection bias) | High risk | Adequate (allocated by music therapist after enrolment by nursing manager who had no prior knowledge of order of participants) |
| Blinding (performance bias and detection bias) | Low risk | Yes, 2 nurse managers |
| Incomplete outcome data (attrition bias) | Unclear risk | Dropouts reported but reasons for withdrawal not reported |
| Selective reporting (reporting bias) | Unclear risk | Not all of the prespecified outcomes were reported |
| Other bias | Unclear risk | Groups comparable at baseline for age, days postonset, severity (measured by % Happy Birthday song) |
| Methods | Cross‐over RCT (only data prior to cross‐over treatment included in this review), UK | |
| Participants | Inclusion criteria: aphasia, problems with comprehension of written sentences, comprehension of small vocabulary of individual context words used in therapy, can recognise graphical representations of objects and actions in therapy sentences; right‐handed; could cope with computer interface Details of participants are shown in Table 1 | |
| Interventions | 1. Verb SLT Intervention: Verb SLT ‐ improved syntactic processing leading to improved sentence comprehension Materials: computer‐based remediation software. Procedures: protocolised tasks included picture building mode, picture creation to match written sentence, sentence building mode, sentence creation from available words to match a picture. Some flexibility between treatment modes and support provided by therapist. Provided by: computer programmer and SLT. Training and expertise not reported. Delivery: 1‐to‐1, face‐to‐face; computer‐facilitated in clinical settings ("a quiet room, blinds and lighting adjusted for maximum screen clarity"). Regimen: 1 h therapy twice weekly for 3 weeks. Total dose = 6 h therapy. Tailoring: yes, based on testing profiles. Modification: not possible. Adherence: all participants retained up to (and following) cross‐over stage of RCT. 2. Preposition SLT Intervention: Preposition SLT. Materials: computer‐based remediation software. Procedures: protocolised tasks included picture building mode, picture creation to match written sentence, sentence building mode, sentence creation from available words to match a picture. Some flexibility between treatment modes and support provided by therapist. Provided by: computer programmer and speech and language therapist. Training and expertise not reported. Delivery: 1‐to‐1, face‐to‐face; computer facilitated in clinical settings ("a quiet room, blinds and lighting adjusted for maximum screen clarity"). Regimen: 1 h therapy twice weekly for 3 weeks. Total dose = 6 h therapy. Tailoring: yes, based on testing profiles. Modification: not possible. Adherence: all participants retained up to (and following) cross‐over stage of RCT | |
| Outcomes | Primary outcomes: Real World Test ‐ verbs and prepositions (treated and untreated) Secondary outcomes: computer‐mediated assessment ‐ verbs and prepositions (treated and untreated) Morphology Data collection: baseline, post‐treatment 1 (cross‐over then baseline 2 and post‐treatment 2, which were not included in this review) | |
| Notes | Randomisation details provided through personal communication with authors Statistical data included within the review meta‐analyses | |
| Risk of bias | ||
| Bias | Authors' judgement | Support for judgement |
| Random sequence generation (selection bias) | Low risk | Patient identification tags drawn from a hat |
| Allocation concealment (selection bias) | High risk | Trialists drew patient identification tags drawn from a hat |
| Blinding (performance bias and detection bias) | Low risk | Computer‐based tests automatically recorded. Real World Tests were unblinded |
| Incomplete outcome data (attrition bias) | Low risk | All participants retained up to (and following) cross‐over stage of RCT |
| Selective reporting (reporting bias) | Low risk | All prespecified outcomes reported |
| Other bias | Low risk | Sample size calculation not reported |
| Methods | RCT, USA | |
| Participants | Inclusion criteria: at least 6 months poststroke and had single or multiple lesions limited to the left hemisphere that included the precentral gyrus or underlying white matter as confirmed by medical records and MRI; standard score greater than 69.92 on the Peabody Picture Vocabulary Test—IV (PPVT–IV; Dunn 2007); an ability to consistently follow one‐step commands; scores on the WAB–AQ below the aphasia cutoff of 93.8 (Kertesz 1982); (d) right‐handedness prior to the stroke, as determined by the Edinburgh Handedness Inventory (Oldfield 1971); and (e) English as their first language. Details of participants are shown in Table 1 | |
| Interventions | 1. Naming therapy with gesture Intervention: gesture SLT. Literature suggests the advantages of recruitment of right‐hemisphere mechanisms during language recovery in aphasia. Crosson 2007 devised an intention‐based treatment technique that engaged the right hemisphere by shifting intention and language production mechanisms to homologous right‐hemisphere regions. Crosson 2007 defined intention as the ability to select and initiate an action from many possible competing actions. Because the intentional circuits for volitional hand movement overlap, those for word generation in the pre‐supplementary motor area (pre‐SMA) preceding a naming attempt with a volitional complex left‐hand movement could facilitate picture naming. Materials: prior to treatment, all subjects named a set of more than 400 black‐and‐white line drawings of objects and generated members of 120 categories twice. Items missed consistently were selected for treatment, beginning with the highest frequency items and progressing to lower frequency items until enough items were identified to construct the counterbalanced treatment lists and probe stimuli. Specifically, from the set of 400 pictures and 120 categories, 120 pictures and 60 categories were individually selected for each subject, with the selected picture and category sets each containing 25% consistently correct and 75% consistently incorrect at pretreatment testing. Procedures: trained on both picture naming and category generation. Phase 1 consisted of treatment sessions 1–10 and focused on the naming of 50 pictures. Phase 2 consisted of treatment sessions 11–20 and trained subjects on the naming of 50 different pictures. Phase 3 consisted of treatment sessions 21–30 and required the generation of an exemplar of each of 40 different categories. Naming trials in Phases 1 and 2 consisted of the presentation of a picture on a computer monitor for naming. In Phase 3, trials consisted of auditory and orthographic presentations of a category name for which the subject generated 1 category member. For all trials in all phases, a therapist verified response accuracy. If treatment trials were completed correctly (i.e., a picture was named correctly or a correct category exemplar was generated), subjects began the next trial. If an item was not named correctly, the therapist would provide the correct name, and subjects would then practice saying the correct response. Similarly, if a subject was unable to generate a member of a category, the therapist would provide an example, and the subject would practice saying this correct response. This correction procedure was repeated up to 3 times maximum or until the subject named the item correctly. The number of times a subject repeated the correct response was not regulated. Each member of the gesture group initiated each treatment trial with his or her left hand by opening and reaching into a box and pushing a red button. Second, during each correction procedure, each member of the gesture group also made a non‐meaningful circular gesture with his or her left hand. Provided by: speech and language therapists. The same therapists administered both the gesture and the no gesture treatments. Training not reported. Delivery: 1‐to‐1, face‐to‐face and computer, location not reported. Regimen: treatment was delivered in 3 phases (10 sessions per phase), with two 1 h treatment sessions per day, 5 d a week, for a total of 30 treatment sessions. The 2 sessions each day were at least half an hour apart. Total dose = 30 h therapy. Tailoring: yes, naming targets by successful/unsuccessful attempts on baseline measure. During therapy correction and prompt and advancement through levels based on patient ability. Modification: not reported.Adherence: therapist monitored patient's protocol adherence. For treatment sessions a research assistant—who was trained in both treatments and who was not administering treatment at any of the sites—evaluated 1 session per treatment phase (i.e., once a week) per subject for correct delivery of the assigned treatment and subsequent correction procedures. 2. SLT Intervention: SLT. Usual care. Materials: described above. Procedures: trained on both picture naming and category generation. Phase 1 to Phase 3 treatment sessions described above. For all trials in all phases, a therapist verified response accuracy, as described above. For the no gesture group, a therapist pushed a button to initiate each treatment trial. No hand movement was required by the participant during the correction procedure. Provided by: speech and language therapists. The same therapists administered both the gesture and the no gesture treatments. Training not reported. Delivery: 1‐to‐1, face‐to‐face and computer, location not reported. Regimen: treatment was delivered in 3 phases (10 sessions per phase), with two 1 h treatment sessions per day, 5 d a week, for a total of 30 treatment sessions. The 2 sessions each day were at least half an hour apart. Total dose = 30 h therapy. Tailoring: yes, naming targets by successful/unsuccessful attempts on baseline measure. During therapy correction and prompt and advancement through levels based on patient ability. Modification: not reported. Adherence: therapist monitored patient's protocol adherence. For treatment sessions a research assistant—who was trained in both treatments and who was not administering treatment at any of the sites—evaluated 1 session per treatment phase (i.e., once a week) per subject for correct delivery of the assigned treatment and subsequent correction procedures. | |
| Outcomes | Primary outcomes: the naming of pictures from the BNT, WABAQ, and discourse production (various ‐ number of nouns; verbs; total number of words; correct information units (Nicholas 1993); utterances with new information (Del Toro 2008); propositional analysis of narrative discourse; Grammaticality. Discourse tasks: describing Norman Rockwell pictures and answering open‐ended questions. Data collection: baseline, post‐treatment. Follow‐up at 3 months | |
| Notes | Statistical data included within the review meta‐analyses | |
| Risk of bias | ||
| Bias | Authors' judgement | Support for judgement |
| Random sequence generation (selection bias) | Unclear risk | Not reported. Stratified random sampling to equalise groups on picture‐naming ability using BNT scores. Groups were also matched on the number of subjects whose lesions extended anteriorly beyond the precentral sulcus |
| Allocation concealment (selection bias) | Unclear risk | Not reported |
| Blinding (performance bias and detection bias) | Unclear risk | Not reported |
| Incomplete outcome data (attrition bias) | Unclear risk | Not reported |
| Selective reporting (reporting bias) | Low risk | All prespecified outcomes reported |
| Other bias | Unclear risk | No power calculation Groups were comparable at baseline for age, education, aphasia severity, naming severity |
| Methods | Parallel group RCT, UK | |
| Participants | Inclusion criteria: aphasia, less than 85% on FCP (x 2), English speaking, at least 3 weeks after stroke Details of participants are shown in Table 1 | |
| Interventions | 1. Conventional SLT Intervention: usual care SLT Materials: usual care Procedures: as deemed appropriate by SLT. Provided by: qualified therapist. Delivery: 1‐to‐1, face‐to‐face; not reported where the intervention was delivered. Regimen: up to 2 h therapy weekly for 15 to 20 weeks. Total dose = 30 h therapy. Duration of individual not reported. Tailoring: individualised. Modification: not reported. Adherence: dropout rate recorded. 2. Social support and stimulation Intervention: "Unfamiliar volunteers". General stimulation and social support. Materials: not reported. Procedures: volunteers provided with details about participant's aphasia, general support and within‐treatment assessment scores and instructed to 'encourage' communication but no instruction in SLT techniques Provided by: volunteers. Training not specified but required to be reliable and able to provide 2 h per week to patient. Delivery: 1‐to‐1, face‐to‐face, SLT department. Regimen: up to 2 h support weekly up to 15 to 20 weeks. Total dose = 30 h contact time. Tailoring: individualised. Modification: not reported. Adherence: dropout rate recorded | |
| Outcomes | Primary outcomes: FCP, Schuell Assessment | |
| Notes | Randomisation details provided through personal communication with authors of original review Statistical data included within the review meta‐analyses | |
| Risk of bias | ||
| Bias | Authors' judgement | Support for judgement |
| Random sequence generation (selection bias) | Low risk | Random numbers table |
| Allocation concealment (selection bias) | Low risk | Adequate |
| Blinding (performance bias and detection bias) | Low risk | Outcome assessor not treating therapist |
| Incomplete outcome data (attrition bias) | High risk | ITT analysis not employed |
| Selective reporting (reporting bias) | Low risk | All prespecified outcomes reported |
| Other bias | Unclear risk | Sample size calculation not reported |
| Methods | Parallel group RCT, Italy | |
| Participants | Inclusion criteria: global aphasia, left CVA, within first year after stroke, right‐handed, native Italian speakers, literate Details of participants are shown in Table 1 | |
| Interventions | 1. High‐intensity SLT Intervention: "Intensive SLT". Intensity is important. Cost‐benefit ratio questionable. Materials: not reported. Procedures: conversational approach more focused on comprehension (e.g. picture‐matching to understanding complex scenes, short stories, engaging patient in conversation, retelling personally relevant stories). Ecological approach based on conversation, comprehension (mostly) and production deficits. Little focus on reading/writing other than in support of the production and comprehension. Provided by: qualified therapists. Delivery: 1‐to‐1, face‐to‐face; mostly outpatient. Regimen (frequency (sessions weekly) x duration): 45‐60 min therapy sessions approximately 5 times weekly for 6 months. Dose = estimated 96.75 to 129 h therapy Tailoring: not reported. Modification: not reported. Adherence: method not reported 2. Conventional SLT Intervention: standard SLT. Materials: not reported. Procedures: based on stimulation approach. Provided by: speech and language therapists. Delivery: 1‐to‐1, face‐to‐face; mostly outpatient. Regimen : 45‐ 60 min therapy session approximately 3 times weekly for 6 months. Total dose = 78 h therapy. Tailoring: not reported. Modification: not reported. Adherence: method not reported | |
| Outcomes | Primary outcomes: AAT | |
| Notes | Data from an additional 4 non‐randomised participants with global aphasia were also reported. They received no SLT intervention but were assessed at 6‐month intervals, and their scores were used to account for spontaneous recovery. They were not included in this review. Statistical data included within the review meta‐analyses | |
| Risk of bias | ||
| Bias | Authors' judgement | Support for judgement |
| Random sequence generation (selection bias) | Unclear risk | Not reported |
| Allocation concealment (selection bias) | Unclear risk | Not reported |
| Blinding (performance bias and detection bias) | Low risk | Outcome assessors blinded |
| Incomplete outcome data (attrition bias) | Low risk | All randomised participants included in analysis |
| Selective reporting (reporting bias) | Low risk | All prespecified outcomes reported |
| Other bias | Unclear risk | Sample size calculation not reported |
| Methods | Parallel group RCT, USA | |
| Participants | Inclusion criteria: right‐handed, left MCA stroke Details of participants are shown in Table 1 | |
| Interventions | 1. Conventional SLT with filmed programmed instruction Intervention: "Conventional SLT with filmed programmed instruction". "New methods . . . minimise stress and frustration and reduce instruction time" "programmed instruction . . . based on modern learning theory". Developed on modern linguistic learning principles and theory (for people who were hearing impaired). Materials: 30 language training films, preceded by 10 perceptual and 5 thinking films for practice. Procedures: "Filmed programmed instruction": perceptual, thinking and language training films (designed for population with hearing impairment) based on linguistic learning theory; passing criterion of 80%, then progression to the next film. Provided by: not reported Delivery: not reported Regimen: not reported but at least 80 h for 5‐22 months. Tailoring: not reported. Modification: not reported. Adherence: not reported. 2. Conventional SLT Intervention: "Conventional SLT and non‐programmed activity". Rationale not reported. Materials: not reported. Procedures: "traditional" therapy and viewing slides, bibliotherapy and "other non‐programmed" activity. Provided by: not reported Delivery: not reported Regimen: not reported ‐ at least 80 h for 6‐ 9 months. Tailoring: not reported. Modification: not reported. Adherence: not reported. | |
| Outcomes | Primary outcomes: reading recognition, reading comprehension, visual closure, visual learning, vocabulary learning | |
| Notes | — | |
| Risk of bias | ||
| Bias | Authors' judgement | Support for judgement |
| Random sequence generation (selection bias) | Unclear risk | Not reported |
| Allocation concealment (selection bias) | Unclear risk | Not reported |
| Blinding (performance bias and detection bias) | Unclear risk | Outcome assessor blinding not described |
| Incomplete outcome data (attrition bias) | Low risk | All randomised participants included in analysis |
| Selective reporting (reporting bias) | Low risk | All prespecified outcomes reported |
| Other bias | Unclear risk | Sample size calculation not reported |
| Methods | RCT, Netherlands | |
| Participants | Inclusion criteria: age 20‐86 years, native Dutch speaker, minimum 11 months after stroke with moderate‐to‐severe naming deficits Details of participants are shown in Table 1 | |
| Interventions | 1. Computer‐mediated SLT Intervention: "multicue". Person with aphasia experiences impact of various cue types on their naming abilities. Permits internalisation and development of self cueing strategies. Materials: written cues and written feedback. Procedures: 4 series of 80 pictures randomly presented. High and low frequency of words of varying length (1‐4 syllables). Coloured picture of word. If word cannot be produced then cues are employed from choice of semantic, orthographic, sentence completion, distraction/take break. First 4 sessions: therapist follows protocol to support patient. Cues introduced sequentially over first 4 sessions. Written responses. Session 5 onwards: therapist withdraws but continues to check progress. Provided by: therapist. Training not reported. Delivery: computer‐based; 1‐to‐1; location not reported. Regimen: 30‐45 minutes therapy over 2‐3 sessions weekly for 2 months. Total dose = 10‐11 h therapy. Tailoring: cues could be reduced or omitted according to patient need. Regular therapist review on progress and problem items. Modification: none reported. Adherence: not reported. 2. No SLT Intervention: no SLT Materials: none Procedures: none. Delivery: none. Regimen: none Modification: none. Adherence: not reported. | |
| Outcomes | Primary outcomes: BNT, ANELT‐A Data collection: assessed at baseline and end of treatment | |
| Notes | Co‐intervention: psychosocial group therapy aimed at coping with consequences of aphasia, not reported if all participated Dropouts are detailed in Table 2 Statistical data included within the review meta‐analyses | |
| Risk of bias | ||
| Bias | Authors' judgement | Support for judgement |
| Random sequence generation (selection bias) | Low risk | Computer‐generated sequence |
| Allocation concealment (selection bias) | Low risk | Concealment in sequentially numbered opaque sealed envelopes |
| Blinding (performance bias and detection bias) | High risk | Trialists were the outcome assessors |
| Incomplete outcome data (attrition bias) | High risk | ITT analysis not employed |
| Selective reporting (reporting bias) | Low risk | All prespecified outcomes reported |
| Other bias | Low risk | A priori sample size calculated |
| Methods | Parallel group RCT, USA | |
| Participants | Inclusion criteria: none listed Details of participants are shown in Table 1 | |
| Interventions | 1. Task‐specific SLT gestural Intervention: AMERIND Gestural Code Cueing. Responses to intersystematic tasks may be enhanced via visual cue for a verbal response. Sessions designed to drill word‐retrieval skills, using cueing where necessary. Materials: 30 common nouns controlled for word frequency and picturability. Procedures: picture naming. Plus 2 pre‐therapy training sessions (20 minutes each). Also had AMERIND cues in addition to the traditional initially‐syllable and sentence ‐completion cues. Presentation of cue type randomised for each session. Provided by: not reported. Delivery: 1‐to‐1, residential aphasia programme at university. Regimen (frequency (sessions weekly) x duration): 15‐30 minutes daily for 2 weeks. Tailoring: not reported. Modification: not reported. Adherence: not reported. 2. Conventional SLT Intervention: Auditory‐verbal cueing. Initial syllable and sentence‐completion cues are more facilitatory than other cues. Drilling word‐retrieval skills using cueing when necessary. Materials: 30 common nouns controlled for word frequency and picturability. Procedures: received traditional initial‐syllable and sentence completion cues. Standardised cueing protocol for sentence completion published as appendix to paper. Provided by: not reported. Delivery: 1‐to‐1; residential aphasia programme at University. Regimen 15‐30 minutes daily for 2 weeks. Tailoring: not reported. Modification: not reported. Adherence: not reported. | |
| Outcomes | Primary outcomes: picture naming test (20/30 items from the Aphasia Therapy Kit) (Taylor 1959), response times | |
| Notes | Suitable statistical data permitting inclusion within the review meta‐analyses unavailable | |
| Risk of bias | ||
| Bias | Authors' judgement | Support for judgement |
| Random sequence generation (selection bias) | Unclear risk | Not reported |
| Allocation concealment (selection bias) | Unclear risk | Not reported |
| Blinding (performance bias and detection bias) | Unclear risk | Not reported |
| Incomplete outcome data (attrition bias) | Low risk | All randomised participants included in analysis |
| Selective reporting (reporting bias) | Unclear risk | All prespecified outcomes reported. However although they reported mean values for % correct responses, SD were not reported. |
| Other bias | Unclear risk | Inclusion criteria not listed |
| Methods | Cross‐over group RCT (only data collected prior to cross‐over treatment included in this review), USA | |
| Participants | Inclusion criteria: > 6 months after stroke, completed SLT available via insurance, single left hemisphere stroke, 80 years or younger, premorbidly literate in English, no medical complications or history of alcoholism, 10th to 90th overall percentile on SPICA on entry, attend more than 80% of therapy Details of participants are shown in Table 1 | |
| Interventions | 1. Group SLT Intervention: SLT. Group therapy approaches effective as they facilitate generalisation, improve psychosocial functioning and participation, and are cost‐effective. Materials: communication of message using any verbal/non‐verbal methods in group format. Fostering initiation of conversation, expanding aphasia understanding, awareness of personal goals, recognition of progress made, promoting confidence. Communication facilitated by communicative drawing, roleplay, natural gestures, resources (e.g. maps) props, personal notebooks, number lines, conversational prompting, graphic choices, scripting. Reading and writing tasks. Social games for communication practice. Procedures: opening 90 min: discussion current activities and events. speech and language therapist‐facilitated discussion of topics relevant to group. Sharing of facilitator's role amongst group. Encourging peer feedback, cueing and peer volunteers. Some reading and writing tasks. Social games. Performance artist (1 h weekly) to facilitate physical exercises, creative expression. Provided by: speech and language therapist plus family or artist. Delivery: group, face‐to‐face; not reported (possibly Aphasia Centre). Regimen: 2.5 h session twice weekly for 4 months. Total dose = up to 160 h therapy. Tailoring: not reported. Modification: not reported. Adherence: 80% attendance. 2. Social support and stimulation Intervention: social group activities and classes. Social contact control, provide opportunity for socialisation. Materials: not reported. Procedures: activities varied depending on social activities of their choice but included movement classes, creative/performance arts groups, church activities, support groups. Provided by: not reported. Delivery: group, face‐to‐face; location not reported. Regimen: at least 3 h weekly for 4 months. Total dose = 52 h contact. Tailoring: not reported. Modification: not reported. Adherence: not reported. | |
| Outcomes | Primary outcomes: Shortened Porch Index of Communicative Ability, WABAQ, Communicative Activities in Daily Living | |
| Notes | Dropouts: 7 participants (conventional SLT 3; social support and stimulation 4). Dropouts are detailed in Table 2 Suitable statistical data permitting inclusion within the review meta‐analyses unavailable | |
| Risk of bias | ||
| Bias | Authors' judgement | Support for judgement |
| Random sequence generation (selection bias) | Unclear risk | Not reported |
| Allocation concealment (selection bias) | Unclear risk | Not reported |
| Blinding (performance bias and detection bias) | High risk | Outcome assessor inadequately blinded |
| Incomplete outcome data (attrition bias) | High risk | ITT analysis not employed |
| Selective reporting (reporting bias) | Unclear risk | Not all prespecified outcomes were reported. CETI, Affect Balance Scale and connected speech measures data and "conversations about videotaped television segments" were not reported in the paper. |
| Other bias | Unclear risk | Groups comparable at baseline (age, education level, aphasia severity) |
| Methods | RCT, Germany | |
| Participants | Inclusion criteria: left hemisphere cerebrovascular accident less than 3 months prior; aphasia (as per clinical diagnosis and screening test); monolingual German speaker Exclusion criteria: aphasia primarily automatisms; severe jargon; severe apraxia of speech; severe neuropsychological disorders, psychiatric disorders or both Group 1: 13 participants Details of participants are shown in Table 1 | |
| Interventions | 1. CIAT Intervention: forced‐use aphasia therapy. Materials: not reported.Procedures: "therapy focused on communicative aspects". Provided by: not reported. Delivery: face‐to‐face, group, location not reported. Regimen: 5 sessions/week, each session 3 h duration, delivered over 6 week period. Tailoring: not reported. Modification: not reported. Adherence: not reported. 2. Conventional therapy Intervention Materials: not reported.Procedures: conventional therapy focused on language/linguistic skills. Provided by: not reported.Delivery: face‐to‐face, group, location not reported. Regimen: 5 sessions/week, each session 45 minutes duration, delivered over 6 week interval. Tailoring: not reported. Modification: not reported. Adherence: not reported | |
| Outcomes | Outcomes: AAT, Aphasia Checklist Data collection: baseline and immediately postintervention (6 weeks) | |
| Notes | Suitable statistical data permitting inclusion within the review meta‐analyses unavailable | |
| Risk of bias | ||
| Bias | Authors' judgement | Support for judgement |
| Random sequence generation (selection bias) | Unclear risk | Not reported |
| Allocation concealment (selection bias) | Unclear risk | Not reported |
| Blinding (performance bias and detection bias) | Unclear risk | Not reported |
| Incomplete outcome data (attrition bias) | High risk | Not all participants accounted for at follow‐up |
| Selective reporting (reporting bias) | High risk | Lack of any statistical data analysis reported for outcomes |
| Other bias | Unclear risk | Not reported whether groups were comparable at baseline |
| Methods | RCT, USA | |
| Participants | Inclusion criteria: single left hemisphere stroke, native English speaker, minimum 3 months after stroke, hearing and vision corrected to normal, minimum high school education, chronic non‐fluent aphasia Details of participants are shown in Table 1 | |
| Interventions | 1. Functional SLT Intervention: functional SLT. Disability‐based, context‐trained. Activity based, personal relevance emphasised. Establish compensatory strategies based on clients strengths to achieve targeted task. Materials: roleplay scripts, various actual catalogues, practice order forms, phone, credit cars, pen/paper, cue cards as individualised for each client. Procedures: roleplays of functional tasks, establish compensatory strategies (practice ordering by telephone, self generate individualised strategies). Use different strategies and modalities to achieve goal/task. Provided by: speech and language therapist trained in both treatment approaches. Delivery: 1‐to‐1, face‐to‐face, location not reported. Regimen: 20 h weekly for 5 weeks. Total dose = 100 h of therapy. Tailoring: materials individualised. Modification: materials individualised. Adherence: reviewed for adherence to allocated intervention. 2. Conventional SLT Intervention: "Impairment‐based therapy". Deficit/impairment based therapy approach. Materials: stimulus items from targeted vocabulary that combine both picture and written words. Pictured stimuli for auditory comprehension tasks. Procedures: impairment‐based, skill trained, remediating naming deficit areas using cueing hierarchies using various modalities. Centred on targeted dimensions of performance (e.g. accuracy, speed or response, nature of required cueing). Provided by: speech and language therapists trained in both treatment approaches. Delivery: 1‐to‐1, face‐to‐face, location not reported. Regimen: 20 h weekly over 5 weeks. Total dose = 100 h therapy. Tailoring: none. Modification: none. Adherence: reviewed for adherence to allocated intervention. | |
| Outcomes | CADL‐2, CETI (completed by primary caregiver), phone and written functional task developed for project (catalogue ordering quiet and tone), PALPA oral and written picture naming | |
| Notes | 5 additional participants were non‐randomly assigned to a baseline group (both functional SLT and conventional SLT), but they were excluded from this review Statistical data included within the review meta‐analyses | |
| Risk of bias | ||
| Bias | Authors' judgement | Support for judgement |
| Random sequence generation (selection bias) | Unclear risk | Not reported |
| Allocation concealment (selection bias) | Unclear risk | Not reported |
| Blinding (performance bias and detection bias) | Unclear risk | Outcome assessor not reported |
| Incomplete outcome data (attrition bias) | Low risk | All randomised participants included in analyses |
| Selective reporting (reporting bias) | Low risk | All prespecified outcomes reported |
| Other bias | Unclear risk | Groups comparable at baseline (age, time postonset, aphasia severity, education, occupation) |
| Methods | RCT, USA | |
| Participants | Inclusion criteria: single left hemisphere stroke, maximum 85 years, minimum 1 year after stroke, PICA overall between 15th to 90th percentile, premorbidly right‐handed, minimum education 8th grade, premorbidly literate in English, vision no worse than 20/100 corrected in better eye, hearing no worse than 40 dB unaided in better ear, no language treatment 3 months before entry to study, non‐institutionalised living environment Details of participants are shown in Table 1 | |
| Interventions | 1. Computer‐mediated SLT Intervention: "computer reading treatment software". Treatment of reading and writing skills using computers. Isolated practice possible. Minimal responses required. Schuell's stimulation approach. Targeting maximised interaction within challenging tasks. Materials: 32 activities, 232 sequentially arranged visual matching and reading activities from 2‐5 choices. Text characters (letters, numbers, symbols). No pictures. Stimulus in centre of top third of screen. Response choices simultaneously displayed bottom half of screen. Tasks sequential in hierarchy of difficulty. 10 matching activities, 22 reading comprehension tasks with 8 difficulty levels. 4 comprehension tasks had 2 difficulty levels. Matching activities were perceptual visual matching to familiarise patient with software. Reading comprehension stimuli (letters numbers, words, phrases and sentences). Procedures: visual matching and reading comprehension tasks. Speech and language therapist familiarised patient with computer, programme and tasks. Demonstrated response modes. Provided by: 4 therapists but minimal involvement. Supportive functions but not in room. Delivery: computer‐facilitated; 1‐to‐1; SLT dept (2 occasionally at home with support; not clear which group). Regimen (frequency (sessions weekly) x duration): 3 h weekly for 26 weeks. Total dose = 78 h therapy. Tailoring: 4 participants needed additional cues during 1 or more sessions. Each task had a baseline set of 20 tasks. If criterion performance of 80% correct in 3 consecutive baseline tasks then programme proceeded to next task. Typically, movement up and down training hierarchy was controlled automatically by the programme. Modification: each task had a baseline set of 20 tasks. If criterion performance of 80% correct in 3 consecutive baseline tasks then programme proceeded to next task. If criterion performance not reached on baseline then therapist used Editor option to divide baseline 20 items into 2 sets of 10 items. Adherence: therapist monitored attendance and performance. Overall report ‐ participants completed mean of 76.14 tasks (range 1‐167) after computerised treatment. 19 or 21 participants completed at least 40 tasks. 2. No SLT Intervention: no SLT Materials: none. Procedures: none. Delivery: none. Regimen: none Modification: none. Adherence: not reported. | |
| Outcomes | Primary outcomes: PICA, WABAQ | |
| Notes | Dropouts: 6 participants (computer‐mediated SLT 0, no SLT 6). Dropouts are detailed in Table 2 Statistical data included within the review meta‐analyses | |
| Risk of bias | ||
| Bias | Authors' judgement | Support for judgement |
| Random sequence generation (selection bias) | Low risk | Random numbers table |
| Allocation concealment (selection bias) | Unclear risk | Not reported |
| Blinding (performance bias and detection bias) | Low risk | Outcomes measured by 1 of 4 speech and language therapists, 95% checked by second speech and language therapist with no knowledge of group allocation |
| Incomplete outcome data (attrition bias) | High risk | Dropouts accounted for but ITT analysis not employed |
| Selective reporting (reporting bias) | Low risk | All prespecified outcomes reported |
| Other bias | Unclear risk | Groups were comparable at baseline |
| Methods | Parallel group RCT, USA | |
| Participants | Inclusion criteria: single left hemisphere stroke, maximum 85 years, minimum 1 year after stroke, PICA overall between 15th to 90th percentile, premorbidly right‐handed, minimum education 8th grade, premorbidly literate in English, vision no worse than 20/100 corrected, hearing no worse than 40 dB unaided, no language treatment 3 months before entry to study, non‐institutionalised living environment Details of participants are shown in Table 1 | |
| Interventions | 1. Computer‐mediated SLT Intervention: "computer reading treatment software". Treatment of reading and writing skills using computers. Isolated practice possible. Minimal responses required. Schuell's stimulation approach. Targeting maximised interaction within challenging tasks. Materials: 32 activities, 232 sequentially arranged visual matching and reading activities from 2‐5 choices. Text characters (letters, numbers, symbols). No pictures. Stimulus in centre of top third of screen. Response choices simultaneously displayed bottom half of screen. Tasks sequential in hierarchy of difficulty. 10 matching activities, 22 reading comprehension tasks with 8 difficulty levels. 4 comprehension tasks had 2 difficulty levels. Matching activities were perceptual visual matching to familiarise patient with software. Reading comprehension stimuli (letters numbers, words, phrases and sentences). Procedures: visual matching and reading comprehension tasks. Speech and language therapist familiarised patient with computer, programme and tasks. Demonstrated response modes. Provided by: 4 therapists but minimal involvement. Supportive functions but not in room. Delivery: computer‐facilitated; 1‐to‐1; SLT dept (2 occasionally at home with support; not clear which group). Regimen (frequency (sessions weekly) x duration): 3 h weekly for 26 weeks. Total dose = 78 h therapy. Tailoring: 4 participants needed additional cues during 1 or more sessions. Each task had a baseline set of 20 tasks. If criterion performance of 80% correct in 3 consecutive baseline tasks then programme proceeded to next task. Typically, movement up and down training hierarchy was controlled automatically by the programme. Modification: each task had a baseline set of 20 tasks. If criterion performance of 80% correct in 3 consecutive baseline tasks then programme proceeded to next task. If criterion performance not reached on baseline then therapist used Editor option to divide baseline 20 items into 2 sets of 10 items. Adherence: therapist monitored attendance and performance. Overall report ‐ participants completed mean of 76.14 tasks (range 1‐167) after computerised treatment. 19 or 21 participants completed at least 40 tasks. 2. Computer‐based cognitive tasks Intervention: computer‐based placebo: computerised cognitive rehabilitation software and arcade‐style games, no language stimulation. Attention control. Materials: animation, shape or colour to focus on reaction time, attention span, memory and other skills that did not overtly require language or other communication abilities. Games were commercially available. Used joystick. Games were golf, puzzles may have had some level of language processing (labelling or planning) but unstructured and incidental. Procedures: commercially available arcade‐style products. Provided by: 4 therapists but minimal involvement. Supportive functions but not in room. Delivery: computer‐based; 1‐to‐1; SLT clinic (2 occasionally at home with support not clear which group). Regimen: 3 h weekly for 26 weeks Tailoring: not reportedModification: not reportedAdherence: therapist monitored attendance and performance. | |
| Outcomes | Primary outcomes: PICA, WABAQ | |
| Notes | Dropouts: 2 participants (computer‐mediated SLT 0; no SLT/computer‐based placebo 2). Dropouts are detailed in Table 2 Statistical data included within the review meta‐analyses | |
| Risk of bias | ||
| Bias | Authors' judgement | Support for judgement |
| Random sequence generation (selection bias) | Low risk | Random numbers table |
| Allocation concealment (selection bias) | Unclear risk | Not reported |
| Blinding (performance bias and detection bias) | Low risk | Outcomes measured by 1 of 4 speech and language therapists, 95% checked by 2nd speech and language therapist with no knowledge of group allocation |
| Incomplete outcome data (attrition bias) | High risk | Dropouts accounted for but ITT analysis not used |
| Selective reporting (reporting bias) | Low risk | All prespecified outcomes reported |
| Other bias | Unclear risk | Groups were comparable at baseline |
| Methods | Parallel group RCT (stratified according to NIHSS result), Sweden | |
| Participants | Consecutive admissions to stroke unit Group 1: 62 participants Group 2: 61 participants Details of participants are shown in Table 1 | |
| Interventions | 1. SLT (Language Enrichment Therapy) Intervention: "Early Intensive Language Enrichment (Comp) Therapy" (Salonen 1980). Commonly used clinically in Sweden. Mainly comprehension exercises, some naming hierarchy. Materials: pictures divided into 8 sections (in hierarchical difficulty): familiar phrases, compound words, basic sentences, basic words, additional words, descriptive words, standard sentences, and sentences. Procedures: protocol. Provided by: 5 specially trained therapists Delivery: face‐to‐face; 1‐to‐1; location not reported. Regimen: 45 minutes therapy 5 d weekly for 3 weeks. Total dose = 11.25 h (per protocol a minimum of 600 minutes) therapy. Tailoring: not reported. Modification: not reported. Adherence: recorded deviations from per protocol intervention of minimum 600 min of SLT. SLT per protocol 54/59 randomised; no SLT per protocol 51/56 randomised. 2. No SLT Intervention: no SLT Materials: none Procedures: none. Delivery: none over 3 weeks. Could start SLT after 21 d. Regimen: none Modification: none. Adherence: not reported. | |
| Outcomes | Primary outcome: ANELT (at day 16) Secondary outcome: NGA (at day 16) | |
| Notes | Funded by the Stockholm County Council Foundation (Expo‐95), Karolinska Institutet, Marianne and Marcus Wallenberg Foundation and AFA Insurances Dropouts: 8 participants (1 died, 4 severely ill, 3 declined) Statistical data included within the review meta‐analyses | |
| Risk of bias | ||
| Bias | Authors' judgement | Support for judgement |
| Random sequence generation (selection bias) | Low risk | Centrally randomised by independent statistician |
| Allocation concealment (selection bias) | High risk | Consecutively sealed envelopes (opaque not specified) |
| Blinding (performance bias and detection bias) | Low risk | 3 therapists blinded to treatment allocation; a fourth also rated recordings blinded to treatment |
| Incomplete outcome data (attrition bias) | Low risk | ITT analysis employed |
| Selective reporting (reporting bias) | Low risk | All prespecified outcomes reported |
| Other bias | Unclear risk | SLT had a more frequent history of myocardial infarction than the non‐SLT group |
| Methods | Parallel group RCT (stratified by aphasia type), Portugal | |
| Participants | Inclusion criteria: no history of neurological or psychiatric disease, first left stroke (single), first month after stroke, moderate‐severe aphasia, good health, maximum 70 years, residing near hospital with flexible transport Details of participants are shown in Table 1 | |
| Interventions | 1. Volunteer‐facilitated SLT Intervention: "volunteer facilitated therapy". Rationale not reported. Materials: speech and language therapist provided relatives with information and working material. Procedures: relatives encouraged to stimulate patient as much as possible. Provided by: relatives and volunteers. Therapists provided relatives with information and working material. Delivery: face‐to‐face; 1‐to‐1; home. Regimen (frequency (sessions weekly) x duration): "as much as possible" over 6 months. Total dose of therapy delivered over the intervention not reported. Tailoring: not reported. Modification: not reported. Adherence: not reported what it focused on, but relatives monitored monthly by therapist. Dropout rate recorded. 2. Conventional SLT Intervention: "conventional janguage sessions from a speech therapist". Effectiveness of SLT. Materials: not reported. Procedures: not reported. Provided by: therapist (training not reported). Delivery: 1‐to‐1; Face‐to‐face; out patient clinic. Regimen: 1 h therapy 3 sessions weekly for 6 months. Total dose = 78 h therapy. Tailoring: not reported. Modification: not reported. Adherence: not reported. | |
| Outcomes | Test Battery for Aphasia created by trialists (reported to have good correlation with WAB) | |
| Notes | Dropouts: 34 participants (conventional SLT 21; volunteer‐facilitated SLT 13). Dropouts are detailed in Table 2 Statistical data reported in a manner unsuitable for inclusion within the review meta‐analyses | |
| Risk of bias | ||
| Bias | Authors' judgement | Support for judgement |
| Random sequence generation (selection bias) | Unclear risk | Not reported |
| Allocation concealment (selection bias) | Unclear risk | Not reported |
| Blinding (performance bias and detection bias) | Low risk | Outcome assessor not therapist |
| Incomplete outcome data (attrition bias) | High risk | ITT analysis not employed |
| Selective reporting (reporting bias) | Unclear risk | Insufficient information available |
| Other bias | Unclear risk | Groups were comparable at baseline. Sample size calculation not reported |
| Methods | Cross‐over RCT (data extracted after completion of cross‐over treatment), UK | |
| Participants | Inclusion criteria: moderate aphasia after stroke, no previous history of brain damage, to attend for a minimum of 8 weeks, PICA overall between 35th to 65th percentile Details of participants are shown in Table 1 | |
| Interventions | 1. Conventional SLT + operant training Intervention: "conventional SLT + operant training". SLT: aim of improving communication ability. Operant Training: verbal conditioning (based on Goodkin 1966). Materials: not reported. Procedures: SLT: encouraged use of automatic and serial speech, picture‐word/sentence matching, reading, writing, verbal encouragement. Operant training: verbal conditioning procedure (reinforcement, tokens for correct responses, incorrect responses ignored). Provided by: speech and language therapist or clinical psychologist. Qualified therapists provided SLT. Clinical psychologist provided operant training or social support. Delivery: 1‐to‐1; face‐to‐face; rehabilitation inpatients. Regimen: 30 minsession 4 times weekly for 4 weeks followed by another 4 weeks with cross‐over intervention. Total dose = 16 h therapy. Tailoring: hierarchy of tasks. Modification: not reported. Adherence: monitored. Some participants unable to complete full number of sessions. 2. Conventional SLT + social support Intervention: "conventional SLT + social support". SLT: aim of improving communication ability. Materials: not reported. Procedures: SLT: encouraged use of automatic and serial speech, picture‐word/sentence matching, reading, writing, verbal encouragement. Social support: predetermined topics (home, holidays, either, work, home town); participant initiates as able, direct questioning/verbal encouragement given, no attempts to correct responses. Ungraded tasks. Mainly expressive language. Provided by: speech and language therapist or clinical psychologist. Clinical psychologist provided operant training or social support. Delivery: 1‐to‐1; face‐to‐face; rehabilitation inpatients. Regimen: 30 minute session 4 times weekly for 4 weeks followed by 4 weeks with cross‐over intervention. Total dose = 16 h of contact (8 h SLT). Tailoring: SLT yes some based on difficulty of task. Social support: none. Modification: (as described in tailoring). Adherence: monitored. Some participants unable to complete full number of sessions. | |
| Outcomes | PICA, Token Test (shortened), ONT, word fluency naming tasks, picture description, self rating abilities | |
| Notes | Some participants unable to complete full number of sessions (leaving slightly early, insufficient therapist time, holidays occurring during trial) Based on unpublished data, we were able to include statistical data within the review meta‐analyses | |
| Risk of bias | ||
| Bias | Authors' judgement | Support for judgement |
| Random sequence generation (selection bias) | Low risk | Random numbers table |
| Allocation concealment (selection bias) | High risk | Partial: participants recruited by speech and language therapists then assigned to intervention by trialist |
| Blinding (performance bias and detection bias) | Low risk | Outcome assessors blinded |
| Incomplete outcome data (attrition bias) | High risk | ITT analysis not employed |
| Selective reporting (reporting bias) | Low risk | All prespecified outcomes reported (unpublished data and personal communication) |
| Other bias | Low risk | Groups were comparable at baseline |
| Methods | Cross‐over RCT (data extracted after completion of cross‐over treatment), UK | |
| Participants | Inclusion criteria: moderate aphasia after stroke, no previous history of brain damage, to attend for a minimum of 8 weeks, PICA overall between 35th to 65th percentile Details of participants are shown in Table 1 | |
| Interventions | 1. Operant Training + SLT Intervention: "operant training SLT + conventional SLT". Operant training: verbal conditioning (based on Goodkin 1966). SLT: aim of improving various aspects of communication ability. Materials: not reported. Procedures: SLT: encouraged use of automatic and serial speech, picture‐word/sentence matching, reading, writing, verbal encouragement. Operant training: verbal conditioning procedure (reinforcement, tokens for correct responses, incorrect responses ignored). Provided by: speech and language therapist or clinical psychologist. Qualified therapists provided SLT. Clinical psychologist provided operant training. 1‐to‐1; face‐to‐face; rehabilitation inpatients. Regimen: 30 min session 4 times weekly for 4 weeks followed by another 4 weeks with cross‐over intervention. Total dose = 16 h therapy. Tailoring: hierarchy of tasks. Modification: not reported. Adherence: monitored. Some participants unable to complete full number of sessions. 2. Social Support + SLT Intervention: "social support + conventional SLT". SLT: aim of improving communication ability. Materials: not reported. Procedures: SLT: encouraged use of automatic and serial speech, picture‐word/sentence matching, reading, writing, verbal encouragement. Social Support: therapist conversed with patient about predetermined topics (home, holidays, either, work, home town). 1 topic per session 10 times of info on each topic generated. Ungraded tasks. Mainly expressive language. Provided by: therapist or clinical psychologist. Qualified speech and language therapists each provided SLT. Clinical psychologist provided operant training or social support. Delivery: 1‐to‐1; face‐to‐face; rehabilitation inpatients. Regimen: 30 min session 4 times weekly for 4 weeks followed by 4 weeks with cross‐over intervention. Total dose = 16 h of contact (8 h SLT). Tailoring: SLT yes, some based on difficulty of task. Social support: none. Modification: as described in tailoring. Adherence: monitored. Some participants unable to complete full number of sessions. | |
| Outcomes | PICA, Token Test (shortened), ONT, word fluency naming tasks, picture description, self rating abilities | |
| Notes | Some participants unable to complete full number of sessions (leaving slightly early, insufficient therapist time, holidays occurring during trial) Based on unpublished data we were able to include statistical data included within the review meta‐analyses | |
| Risk of bias | ||
| Bias | Authors' judgement | Support for judgement |
| Random sequence generation (selection bias) | Low risk | Random numbers table |
| Allocation concealment (selection bias) | High risk | Partial: participants recruited by speech and language therapists then assigned to intervention by trialist |
| Blinding (performance bias and detection bias) | Low risk | Outcome assessors blinded |
| Incomplete outcome data (attrition bias) | High risk | ITT analysis not employed |
| Selective reporting (reporting bias) | Low risk | All prespecified outcomes reported (unpublished data and personal communication) |
| Other bias | Unclear risk | Groups were comparable at baseline |
| Methods | Cross‐over RCT (data extracted up to point of cross‐over), UK | |
| Participants | Inclusion criteria: moderate aphasia after stroke, no previous history of brain damage, to attend for a minimum of 8 weeks, PICA overall between 35th to 65th percentile Details of participants are shown in Table 1 | |
| Interventions | 1. Conventional SLT + operant training Intervention: aim of improving communication ability. Materials: not reported. Procedures: SLT: encouraged use of automatic and serial speech, picture‐word/sentence matching, reading, writing, verbal encouragement. Provided by: qualified therapists. Delivery: 1‐to‐1; face‐to‐face; rehabilitation inpatients. Regimen: 30 min session 4 times weekly for 4 weeks. Total dose = 8 h therapy (before cross‐over) Tailoring: hierarchy of tasks. Modification: not reported. Adherence: monitored. Some participants unable to complete full number of sessions. 2. Social support Intervention: "social support + conventional SLT". SLT: aim of improving communication ability. Materials: not reported. Procedures: SLT: encouraged use of automatic and serial speech, picture‐word/sentence matching, reading, writing, verbal encouragement. Social support: therapist conversed with patient about predetermined topics (home, holidays, either, work, home town). 1 topic per session 10 times of info on each topic generated. Ungraded tasks. Mainly expressive language. Provided by: therapist or clinical psychologist. Qualified speech and language therapists provided SLT. Clinical psychologist provided operant training or social support. Delivery: 1‐to‐1; face‐to‐face; rehabilitation inpatients. Regimen: 30 min session 4 times weekly for 4 weeks. Total dose = 8 h of contact (before cross‐over). Tailoring: none. Modification: none. Adherence: monitored. Some participants unable to complete full number of sessions. | |
| Outcomes | PICA, Token Test (shortened), ONT, word fluency naming tasks, picture description, self rating abilities | |
| Notes | Some participants unable to complete full number of sessions (leaving slightly early, insufficient therapist time, holidays occurring during trial) Based on unpublished data we were able to include statistical data included within the review meta‐analyses | |
| Risk of bias | ||
| Bias | Authors' judgement | Support for judgement |
| Random sequence generation (selection bias) | Low risk | Random numbers table |
| Allocation concealment (selection bias) | High risk | Partial: participants recruited by speech and language therapists then assigned to intervention by trialist |
| Blinding (performance bias and detection bias) | Low risk | Outcome assessors blinded |
| Incomplete outcome data (attrition bias) | High risk | ITT analysis not employed |
| Selective reporting (reporting bias) | Low risk | All prespecified outcomes reported (unpublished data and personal communication) |
| Other bias | Unclear risk | Groups were comparable at baseline |
| Methods | Parallel group RCT, UK | |
| Participants | Inclusion criteria: acute stroke, admitted to Nottingham hospital Details of participants are shown in Table 1 | |
| Interventions | 1. Conventional SLT Intervention: "speech and language therapy for aphasia (as per therapist judgement)". Materials: subject to individual therapists treatment plans. Procedures: subject to individual therapists treatment plans. Provided by: therapist Delivery: face‐to‐face; 1‐to‐1; in‐hospital or at home. Regimen: 1 h session 2 times weekly for 24 weeks. Total dose 48 h therapy. Tailoring: not reported. Modification: not reported. Adherence: monitored. 0‐12 sessions = 39/104 patients; 13‐14 sessions = 16/104 patients; 25‐36 sessions =22/104 patients; 37‐48 sessions = 27/104 patients. 2. No SLT Intervention: none. Materials: none. Procedures: (deferred SLT offered after trial ceased). Provided by: none. Delivery: none. Regimen: none. Tailoring: not reported. Modification: none. Adherence: none. | |
| Outcomes | PICA, FCP | |
| Notes | Method of randomisation and concealed allocation provided through personal communication with authors of original review Statistical data reported unsuitable for inclusion within the review meta‐analyses | |
| Risk of bias | ||
| Bias | Authors' judgement | Support for judgement |
| Random sequence generation (selection bias) | Low risk | Random numbers table |
| Allocation concealment (selection bias) | Low risk | Sequentially numbered sealed envelopes |
| Blinding (performance bias and detection bias) | Low risk | Outcome assessors blinded |
| Incomplete outcome data (attrition bias) | High risk | ITT analysis not employed |
| Selective reporting (reporting bias) | Low risk | All prespecified outcomes reported |
| Other bias | Unclear risk | Groups were comparable at baseline |
| Methods | Cross‐over RCT (data extracted up to point of cross‐over), UK | |
| Participants | Inclusion criteria: < 35th percentile of PICA, severe aphasia following stroke, spontaneous speech (few single words), writing limited to copying, poor auditory comprehension, less than average non‐verbal intellectual functioning Details of participants are shown in Table 1 | |
| Interventions | 1. Programmed instruction + operant training + SLT Intervention: "programmed instruction with operant training and SLT". Useful and effective methods that merit further investigation in aphasia intervention. SLT: aim of improving communication ability. Materials: electric board graded language tasks. Matching letters, cards with object names or line drawings of objects. Increasing difficulty based on frequency of use of the word. 13 sets of 6 object names in graded order of difficulty. SLT not reported. Procedures: cards arranged in 13 sets of 6 cards for both names and pictures. Sets representing words of decreasing frequency of occurrence in spoken English. Board lights in response to correct answer plus therapist provides verbal praise; for incorrect answers, there is no light response, therapist shakes head and provides verbal feedback 'no'. Mostly focused on comprehension activities. Provided by: SLT from therapist. Delivery: 1‐to‐1; face‐to‐face; rehabilitation inpatients. Regimen: 30 min session twice weekly for 4 weeks (followed by cross‐over). Total dose = 4 h therapy. Tailoring: task progression based on individual's progress. Modification: (as described in tailoring). Adherence: not reported. 2. Attention control + SLT Intervention: "attention placebo plus SLT". Attention control to programmed instruction with operant training. Materials: not reported. Procedures: non‐verbal tasks (matching, visuospatial tasks, copying, recall of designs, performance scale of WAIS, manual dexterity tasks). Provided by: SLT from therapist. Delivery: 1‐to‐1; face‐to‐face; rehabilitation inpatients. Regimen: 30 min session twice weekly for 4 weeks (followed by cross‐over). Total dose = 4 h SLT. Tailoring: task progression based on individual's progress. Modification: (as described in tailoring). Adherence: not reported. More detail is available from Lincoln NB. An Investigation of the Effectiveness of Language Retraining Methods with Aphasic Stroke Patients [PhD thesis] 1980. | |
| Outcomes | Outcomes measures: PICA, Token Test, Peabody PVT, ONT | |
| Notes | The same therapist provided conventional SLT to both groups Based on unpublished data, we were able to include statistical data included within the review meta‐analyses | |
| Risk of bias | ||
| Bias | Authors' judgement | Support for judgement |
| Random sequence generation (selection bias) | Low risk | Random numbers table |
| Allocation concealment (selection bias) | High risk | Partial: participants recruited by speech and language therapists then assigned to intervention by trialists |
| Blinding (performance bias and detection bias) | Unclear risk | Outcome assessor blinded for 1 measure only (PICA) |
| Incomplete outcome data (attrition bias) | Low risk | All randomised participants included in analyses |
| Selective reporting (reporting bias) | Low risk | All prespecified outcomes reported (unpublished data and personal communication) |
| Other bias | Unclear risk | Comparisons between group 1 and group 2 showed group 2 performed significantly better on PICA test (reading cards) and copying shapes than group 1 |
| Methods | Parallel group RCT, People's Republic of China | |
| Participants | Inclusion criteria: first onset aphasia, diagnosis of stroke following a CT scan; impaired language expression or comprehension skills; fully conscious (capable of concentrating for a minimum of 30 min) Exclusion criteria: obvious visual and auditory disturbances prior to onset; emotional lability; dementia; severe hepatic or renal dysfunction Group 1: 19 participants Group 2: 17 participants Details of participants are shown in Table 1 | |
| Interventions | 1. Conventional SLT plus acupuncture Intervention: "Speech training plus acupuncture". Materials: not reported. Procedures: SLT followed Schuell's stimulation method for psychological care, acupuncture and routine neurological remedies. Provided by: not reported. Delivery: not reported. Regimen (frequency (sessions weekly) x duration): not reported. Tailoring: not reported. Modification: not reported. Adherence: not reported. 2. No SLT No SLT, routine neurological remedies. Intervention: no SLT. Materials: none. Procedures: no SLT only routine neurological remedies. Provided by: none. Delivery: none. Regimen: none. Tailoring: none. Modification: none. Adherence: not reported. | |
| Outcomes | 'BADE' (sic) (BDAE?) and the CMA neurological branch scoring systems for the assessment of aphasia in Chinese | |
| Notes | ― | |
| Risk of bias | ||
| Bias | Authors' judgement | Support for judgement |
| Random sequence generation (selection bias) | Unclear risk | Not reported |
| Allocation concealment (selection bias) | Unclear risk | Not reported |
| Blinding (performance bias and detection bias) | Unclear risk | Not reported |
| Incomplete outcome data (attrition bias) | Low risk | All participants appear to have remained in the study |
| Selective reporting (reporting bias) | Low risk | All prespecified outcomes reported |
| Other bias | Unclear risk | Acupuncture was delivered alongside SLT provision Sample size calculation not reported Groups comparable for sex, age, time poststroke and lesion type |
| Methods | RCT, USA | |
| Participants | Inclusion criteria (patient): minimum 1 year after stroke, no bilateral brain damage, ability to ambulate short distances, function independently in primary ADL, English primary language, normal range of cognition, hearing and vision, weekly contact with primary caregiver, history free of psychosis Details of participants are shown in Table 1 | |
| Interventions | 1. Functionally‐based SLT Intervention: "Communication partners". Aims to restore a sense of purpose, direction and control to daily life for both patient and caregiver. A programme aimed at enhancing communication and well‐being in settings where patient and caregiver live and choose to interact. The plan underscores the viability of communication with a naive normal adult while concurrently strengthening more active, self determined and controlled role in daily life. Increased participation in life provides a much richer experiential base for subsequent communication between caregiver and patient. Life experience provides something to talk about. Rejuvenating the self is shown to be at the core of communication dysfunction. Materials: individualised plausible situations Procedures: 2 Phases; phase A: 6 week long. Establishing effective communication strategies between partner and person with aphasia. phase B: 14 weeks of activities of participant choice. Provided by: community volunteer communication partner. Protocol, examples. Delivery: face‐to‐face; triad (patient, volunteer, caregiver); at home or in community and 1 session, bridge between phase A and phase B, in clinic. Regimen: phase A: 1‐1.5 h twice weekly for 6 weeks; phase B: 1‐2 h session (clinic) plus 2‐4 h session (community) once weekly for 14 weeks. Total dose = not reported, estimated as phase A: 18 h, phase B: up to 110‐128 h therapy. Tailoring: individualised. Modification: individualised. Adherence: daily logs. Actual adherence or fidelity was not reported. 2. No SLT Intervention: no SLT (deferred). Materials: none. Procedures: none. Provided by: none. Delivery: none. Regimen: deferred until after study. Tailoring: none.Modification: none. Adherence: none. | |
| Outcomes | BDAE, CADL, ABS, Psychological Wellbeing Index, Communication Readiness and Use Index, informal subjective measures | |
| Notes | Some statistical data reported in a manner unsuitable for inclusion within the review meta‐analyses | |
| Risk of bias | ||
| Bias | Authors' judgement | Support for judgement |
| Random sequence generation (selection bias) | Unclear risk | Not reported |
| Allocation concealment (selection bias) | Unclear risk | Not reported |
| Blinding (performance bias and detection bias) | High risk | Outcome assessors inadequately blinded |
| Incomplete outcome data (attrition bias) | Unclear risk | All randomised participants appear to have been included in analyses, but it is not reported |
| Selective reporting (reporting bias) | Low risk | All prespecified outcomes reported |
| Other bias | Unclear risk | Comparability of groups at baseline not reported. Sample size calculation not reported |
| Methods | Parallel group RCT, USA | |
| Participants | Inclusion criteria: minimum age 30 years, poststroke aphasia, minimum 6 months postonset, living within 50 mile (80 km) radius of hospital/specified geographical area Details of participants are shown in Table 1 | |
| Interventions | 1. Volunteer‐facilitated SLT Intervention: "Community Stroke Study". Community volunteers facilitated SLT language and social stimulation. Materials: not reported. Procedures: not reported. Provided by: community volunteers. Trained by nurses and therapist. Delivery: face‐to‐face; 1‐to‐1; institutional and non‐institutional settings. Regimen: 3‐6 h once weekly for 1 year. Total dose = up to 312 h therapy. Tailoring: not reported. Modification: not reported. Adherence: not reported. 2. No SLT Intervention: no SLT. Materials: none Procedures: none. Provided by: none. Delivery: none. Regimen: deferred until after study. Tailoring: none.Modification: none. Adherence: none. | |
| Outcomes | CADL, trialist assessment measuring social/interpersonal skills, structured questionnaires assessing economic, medical and demographic factors (completed by caregivers/family members) | |
| Notes | Participants continued individual medical/nursing care Statistical data reported in a manner unsuitable for inclusion within the review meta‐analyses | |
| Risk of bias | ||
| Bias | Authors' judgement | Support for judgement |
| Random sequence generation (selection bias) | Unclear risk | Not reported |
| Allocation concealment (selection bias) | Unclear risk | Not reported |
| Blinding (performance bias and detection bias) | Low risk | Outcome assessors blinded |
| Incomplete outcome data (attrition bias) | High risk | ITT analysis not employed |
| Selective reporting (reporting bias) | High risk | No data for the prespecified outcomes were reported in the paper |
| Other bias | Unclear risk | Comparability of groups at baseline not reported |
| Methods | RCT, Italy | |
| Participants | Inclusion criteria: first ever acute stroke in the territory of the MCA; aphasia with mildly impaired oral comprehension, that is, comprehension sufficient to perform a screening task of the fMRI paradigm; native Italian speakers; right‐handed, absence of previous history of other neurological or psychiatric diseases; absence of general contraindications to MRI; age < 80 years; absence of hearing deficits; mild/moderate aphasia Details of participants are shown in Table 1 | |
| Interventions | 1. Daily language rehabilitation Intervention: SLT. Daily language rehab leads to improved language recovery and improved functional correlates, brain plasticity. Materials: Snodgrass and Vanderwart (1980) set (Snodgrass 1980). Procedures: mainly focusing on verbal comprehension and lexical retrieval. In each session, after a short and simple dialogue with the patient, covering his mood and status, as well as any relevant episodes occurred during the day, a naming task was usually conducted, where patients had to spontaneously name items taken from the Snodgrass and Vanderwart (1980) set (Snodgrass 1980). In the case of failure, all the facilitations were given. Single word as well as sentence comprehension was also treated with the help of available common objects and objects pictures. A semi‐structured rehabilitation setting was used, instead of a rigidly predetermined set of tasks identical for all the subjects, due to the clinical condition of the acute phase and the location (the stroke unit) where the rehabilitation was conducted. Generally, a stimulation of the impaired linguistic functions was conducted by the therapist, according to the deficits shown by the AAT. Provided by: speech and language therapists. Training not reported. Delivery: 1‐to‐1, face‐to‐face; location not reported. Regimen: 1 h session per day, for 5 d per week for 2 weeks. Total dose = 10 h therapy. Tailoring: yes. Modification: yes. Adherence: not reported. 2. No SLT Intervention: no SLT. As per usual clinical practice in that centre. But all exposed to the natural speech environment of people they were visited, and this could be considered an unstructured language therapy. Materials: none. Procedures: none. Provided by: none. Delivery: none. Regimen: none. Tailoring: none. Modification: none. Adherence: none. | |
| Outcomes | Primary outcomes: Aachen Aphasia Test (AAT) Secondary outcomes: AAT subtests of repetition, naming, reading, writing, oral, and written comprehension; a 50‐item version of the Token test; and a semi‐quantitative scoring of several aspects of spontaneous speech (communicative ability, articulation and prosody, automatic speech, semantic, phonemic, and syntactic structure). Data collection: baseline (T1: mean (SD), 2.2 (1.3) d after stroke), 2 weeks poststroke (T2: 16.2 (1.3) d after stroke). Follow‐up 6 months (T3: 190.0 (25.5) d after stroke). | |
| Notes | Statistical data included within the review meta‐analyses Dropouts are detailed in Table 2 | |
| Risk of bias | ||
| Bias | Authors' judgement | Support for judgement |
| Random sequence generation (selection bias) | Low risk | Random number generator |
| Allocation concealment (selection bias) | High risk | Inadequate |
| Blinding (performance bias and detection bias) | Low risk | Speech and language therapist blinded |
| Incomplete outcome data (attrition bias) | Low risk | Dropouts accounted for |
| Selective reporting (reporting bias) | Low risk | All prespecified outcomes reported |
| Other bias | Low risk | Groups were comparable at baseline in terms of age, education, aphasia severity, lesion volume, NIHSS |
| Methods | Parallel group RCT, UK | |
| Participants | Inclusion criteria: aphasia after stroke, minimum 3 weeks after stroke Details of participants are shown in Table 1 | |
| Interventions | 1. Volunteer‐facilitated SLT Intervention: "volunteer‐facilitated SLT". Efficient resource use. Materials: volunteers given basic background to aphasia, standard items of SLT equipment, initial and ongoing support and advice, encouraged to use initiative and ingenuity in developing therapeutic techniques. Procedures: SLT provided explanations to volunteers of nature of patient's disability, and test results indicated treatment focus with verbal, gestural and graphic tasks determining treatment strategy. Provided by: recruited volunteers (via newspapers, word of mouth). Included housewives, students, secretaries, retired nurse, postman. All passed interview. Introductory course (stroke, aphasia) and film. Each patient assigned 4 volunteers for 4 home visits weekly. Delivery: face‐to‐face; 1‐to‐1 and group; home (group sessions in rehab centre). Regimen: 4 home visits weekly plus group sessions for a mean of 20.8 (SD 13.5; range 2‐46) weeks. Varied. Participants remained in trial until 2 successful estimations on PICA showed no appreciable improvement, they requested withdrawal, or until end of trial in December 1978. Participants who plateaued exited trial and counted as successes. Tailoring: individualised therapy based on PICA results. Modification: not reported. Adherence: attendance recorded by therapists and volunteers. Not all documentation available at study end. 2 from volunteer group failed to complete treatment programme and excluded from analyses. 2. Conventional SLT Intervention: conventional SLT. Materials: chosen by speech and language therapist (no details). Procedures: as provided by qualified speech and language therapist. Provided by: speech and language therapist. Delivery: face‐to‐face; 1‐to‐1 and group; hospital. Regimen: 45 min session 3‐5 times weekly plus group sessions for a mean of 37.13 (SD 21.89; range 7 to 84) weeks. But varied, participants remained in trial until 2 successful estimations on PICA showed no appreciable improvement, they requested withdrawal or until end of trial. Participants who plateaued exited trial and counted as successes. Tailoring: not reported. Modification: not reported. Adherence: attendance recorded by therapists and volunteers. 5 participants missed up to half their possible treatments (illness, holidays, transport difficulties). | |
| Outcomes | PICA | |
| Notes | In the conventional SLT group 5 participants missed up to half their possible treatments (illness, holidays, transport difficulties) Statistical data included within the review meta‐analyses | |
| Risk of bias | ||
| Bias | Authors' judgement | Support for judgement |
| Random sequence generation (selection bias) | Unclear risk | Not reported |
| Allocation concealment (selection bias) | Unclear risk | Not reported |
| Blinding (performance bias and detection bias) | High risk | Outcome assessor not blinded |
| Incomplete outcome data (attrition bias) | High risk | ITT analysis not employed |
| Selective reporting (reporting bias) | Low risk | All prespecified outcomes reported |
| Other bias | Unclear risk | Group that received conventional SLT had more weeks in the trial than the volunteer‐facilitated SLT group |
| Methods | Parallel group RCT, Germany | |
| Participants | Inclusion criteria: 1 or more participating relative, single left hemisphere stroke, aphasia, minimum 6 months postonset, globally aphasic if residual expressive language, i.e. repeat short phrases Details of participants are shown in Table 1 | |
| Interventions | 1. Volunteer‐facilitated SLT Intervention: "volunteer‐facilitated constraint‐induced SLT". Intensive therapy more effective, but high personnel and financial costs. Lay people can be trained to provide. Materials: communicative language games, pairs of cards depicting objects, everyday situations or words. Therapy materials provided by psychologist. Procedures: screens between the participants prevents seeing each others cards; participant must choose a card from their own set and ask for the identical card from another participant; can be adjusted to target different levels of language complexity. Gestures permitted. Provided by: volunteer relatives (where 2 or more relatives were available they alternated each day). Received 2 h introduction to constraint‐induced SLT; supervised during first 2 of 10 sessions by experienced therapist; following 8 sessions experts were available, further group training sessions at end of each daily training session. Delivery: group; face‐to‐face; location not reported. Regimen: 3 h therapy daily for 10 consecutive working days. Total dose = 30 h therapy. Tailoring: some adjustment of individual task difficulty. Modification: adjustments described in treatment protocol, performance requirements, reinforcements, complexity of card sets. Adherence: all randomised participants completed study and analysed. 2. Conventional SLT Intervention: "constraint‐induced aphasia therapy (Psychologist Facilitated)". Rationale not reported. Materials: communicative language games, pairs of cards depicting objects, everyday situations or words. Procedures: screens between the participants prevents seeing each others' cards; participant must choose a card from their own set and ask for the identical card from another participant; can be adjusted to target different levels of language complexity. Gestures permitted. Provided by: experienced psychologists. Delivery: group; face‐to‐face; location not reported. Regimen: 3 h therapy daily for 10 consecutive working days. Total dose = 30 h therapy. Tailoring: some adjustment of individual task difficulty. Modification: adjustments described in treatment protocol, performance requirements, reinforcements, complexity of card sets. Adherence: all randomised participants completed study and analysed. | |
| Outcomes | Primary outcomes: AAT (Token Test, repetition, written language, naming, comprehension) | |
| Notes | 1 participant in each group had mild apraxia of speech Statistical data included within the review meta‐analyses | |
| Risk of bias | ||
| Bias | Authors' judgement | Support for judgement |
| Random sequence generation (selection bias) | Unclear risk | Not reported |
| Allocation concealment (selection bias) | Unclear risk | Not reported |
| Blinding (performance bias and detection bias) | Low risk | Outcome assessor blinded |
| Incomplete outcome data (attrition bias) | Low risk | All randomised participants included in analyses |
| Selective reporting (reporting bias) | Low risk | All prespecified outcomes reported |
| Other bias | Unclear risk | Participants receiving constraint‐induced SLT were younger than those in the trained volunteers group |
| Methods | RCT, Netherlands | |
| Participants | Inclusion criteria: aphasic after left hemisphere stroke, time poststroke 2‐3 months, premorbidly right‐handed, age 18‐80 years, native language Dutch, and MIT candidate. MIT candidacy was based on the MIT literature and defined as follows: nonfluent aphasia (< 50 ords/min), articulation deficits (Aachen Aphasia Test (AAT), subscore spontaneous language ≤ 3), repetition severely affected (AAT subtest repetition ≤ 100), and moderate to good auditory language comprehension (AAT subtest auditory comprehension ≥ 33); functional comprehension ≥ 5) Details of participants are shown in Table 1 | |
| Interventions | 1. MIT Intervention: MIT. Critical role of rhythm and formulaic language in MIT contribution of the right hemisphere is still not reported: some report increased right hemisphere activation related to MIT success. Others suggest that MIT‐induced language recovery is related to reactivation of left perilesional regions. Materials: set of utterances of increasing complexity to be trained. The first utterances in frequent use in daily life communication (e.g. "coffee please"). Later the utterances became longer, more complex, and less frequent in daily life. In addition, the patient composed a set of self chosen utterances that were functionally relevant to them (e.g. relating to hobbies). Home practice included ‐ iPod application containing short videos of a mouth singing the target utterances; patients could sing along with the video or repeat the utterance afterwards. Procedures: MIT following the American manual. The patient and the therapist sang short utterances together, while handtapping the rhythm. Gradually, the support from the therapist decreased and singing was replaced by speaking. A minimum of 50% of the therapy time was spent on the utterances provided. Provided by: speech and language therapists experienced in language rehabilitation. All trained to deliver MIT according to protocol. Delivery: 1‐to‐1, face‐to‐face, delivered in the rehabilitation centre or nursing home with rehabilitation facilities. Regimen: 6 weeks; 5 h/week (minimum face‐to‐face time 3 h/week). Total dose = 30 h of therapy. Tailoring: yes, based on selection of functionally relevant target utterances. Modification: yes, as above. Adherence: PI contacted the speech and language therapists at least once a week and asked them about what they were doing during therapy, patient acceptability, and if they had any questions or encountered problems. Speech and language therapists also were free to contact the PI whenever they had questions. 2. Control SLT Intervention: control SLT. Not aiming at language production. Used linguistic tasks often trained in severe nonfluent aphasia (e.g. written language production, language comprehension, and nonverbal communication strategies). Materials: home assignments included paper‐and‐pencil tasks (e.g. written sentence completion, word–picture matching, and word categorising tasks). Procedures: did not emphasise spoken output. Focused on other linguistic modalities usually trained in severe nonfluent aphasia (writing, language comprehension, nonverbal communication strategies). Spoken output was not discouraged but the therapists did not provide feedback regarding patients' verbal production and offered no structural training of language production. Provided by: speech and language therapists. Therapists delivering the control SLT received a protocol of what was permitted and what was not, as well as a manual containing practice materials and references that could be used. PI also helped create tailor‐made tasks for a specific patient. Delivery: 1‐to‐1, face‐to‐face, delivered in the rehabilitation centre or nursing home with rehabilitation facilities. Regimen: 6 weeks; 5 h/week (minimum face‐to‐face time 3 h/week). Total dose = 30 h of therapy. Tailoring: individualised therapy Modification: not reported. Adherence: PI contacted the speech and language therapists at least once a week, and asked them about what they were doing during therapy, patient acceptability, and if they had any questions or encountered problems. Speech and language therapists also were free to contact the PI whenever they had questions. | |
| Outcomes | Primary outcomes: Content Info Units (CIU) in Sabadel Story retelling task Secondary outcomes: ANELT, AAT (repetition and naming subtests); MIT repetition task, Semantic Association Task Data collection: baseline, and post‐treatment (6 weeks). No follow‐up (see phase 2 of RCT MIT 2014ii) | |
| Notes | Dropouts are detailed in Table 2 Statistical data included within the review meta‐analyses | |
| Risk of bias | ||
| Bias | Authors' judgement | Support for judgement |
| Random sequence generation (selection bias) | Low risk | Computer‐generated |
| Allocation concealment (selection bias) | Low risk | Consecutively numbered sealed opaque envelopes |
| Blinding (performance bias and detection bias) | Unclear risk | Researchers administering and scoring the assessments at each test moment were blinded for group allocation. In a few cases, blinding could not be maintained because the patients spontaneously informed the researcher about their therapy allocation |
| Incomplete outcome data (attrition bias) | Low risk | ITT analysis employed |
| Selective reporting (reporting bias) | Low risk | All prespecified outcomes reported |
| Other bias | Unclear risk | Groups comparable at baseline in terms of age, time poststroke, education and aphasia severity scores, handedness. Imbalance in sex (signif (P = 0.045) more males in control SLT group than MIT) Power calculation reported |
| Methods | Active parallel RCT, Netherlands | |
| Participants | Inclusion criteria: aphasic after left hemisphere stroke, time poststroke 2‐3 months, premorbidly right‐handed, age 18‐80 years, native language Dutch, and MIT candidate. MIT candidacy was based on the MIT literature and defined as follows: nonfluent aphasia (< 50 ords/min), articulation deficits (Aachen Aphasia Test (AAT), subscore spontaneous language ≤ 3), repetition severely affected (AAT subtest repetition ≤ 100), and moderate to good auditory language comprehension (AAT subtest auditory comprehension ≥ 33); functional comprehension ≥ 5) Details of participants are shown in Table 1 | |
| Interventions | 1. MIT Early + SLT Intervention: MIT (as descirbed in MIT 2014i above) followed by access to conventional SLT.Provided by: speech and language therapists experienced in language rehabilitation trained to deliver MIT according to protocol. Delivery: 1‐to‐1, face‐to‐face, delivered in the rehabilitation centre or nursing home with rehabilitation facilities. Regimen: 6 weeks (5 h/week; minimum face‐to‐face time 3 h/week) of MIT followed by 6 weeks of conventional SLT. Total dose = 30 h of MIT followed by SLT (not possible to record the dose and intensity). Tailoring: yes, selection of functionally relevant target utterances. Modification: yes, degree, based on selection of functionally relevant target utterances. Adherence: conventional therapy was delivered in a pragmatic manner and was not dictated by the trial. 2. Control SLT + Delayed MIT: Intervention: control SLT(as descirbed in MIT 2014i above) followed by MIT (as descirbed in MIT 2014i above). Regimen: 6 weeks (5 h per week; minimum face‐to‐face time 3 h/week) of Control SLT followed by 6 weeks of MIT.Total dose = 60 h of therapy Tailoring: yes, selection of functionally relevant target utterances. Modification: yes, degree, based on selection of functionally relevant target utterances. Adherence: PI contacted the speech and language therapists who were giving MIT or control therapy at least once a week, and asked them about what they were doing during therapy, whether they thought the patient liked it or not, and if they had any questions or encountered problems. Speech and language therapists also were free to contact the PI whenever they had questions. | |
| Outcomes | Primary outcomes: Content Info Units (CIU) in Sabadel Story retelling task Secondary outcomes: ANELT, AAT (repetition and naming subtests); MIT repetition task, Semantic Association Task Data collection: baseline, and post‐treatment (at 12 weeks) | |
| Notes | Dropouts are detailed in Table 2 Statistical data included within the review meta‐analyses | |
| Risk of bias | ||
| Bias | Authors' judgement | Support for judgement |
| Random sequence generation (selection bias) | Low risk | Computer‐generated |
| Allocation concealment (selection bias) | Low risk | Consecutively numbered sealed opaque envelopes |
| Blinding (performance bias and detection bias) | Unclear risk | Researchers administering and scoring the assessments at each test moment were blinded for group allocation. In a few cases, blinding could not be maintained because the patients spontaneously informed the researcher about their therapy allocation |
| Incomplete outcome data (attrition bias) | Low risk | ITT analysis employed |
| Selective reporting (reporting bias) | Low risk | All prespecified outcomes reported |
| Other bias | Unclear risk | Groups comparable at baseline in terms of age, time poststroke, education and aphasia severity scores, handedness. Imbalance in sex (signif (P = 0.045) more males in control SLT group than MIT) Power calculation reported |
| Methods | RCT, Australia | |
| Participants | Inclusion criteria: neurologically stable, had no previous aphasia or progressive cognitive difficulties, were proficient in English prior to their stroke and, where apraxia or dysarthria was present, these were mild and not their primary area of difficulty Details of participants are shown in Table 1 | |
| Interventions | 1. Narrative Intervention: NARNIA. Therapy directly targets discourse organisation to support earlier levels of language production and improve discourse production. Materials: narrative production using published picture sequences (Toomey's 'Sequence Plus', 1992) focusing initially on identifying the main event(s), production of relevant verb and nouns and creating a complete argument structure. Functionally relevant materials were chosen e.g. planning a holiday, shaving. A framework for narrative discourse, based on story grammar, was introduced, and the sentences organised around "setting the scene" (the beginning), "the events taking place" (the middle), and "concluding the story" (the end). Following sucess in use of the narrative framework, other discourse genre frameworks (recount, procedure and exposition) were used. Mind‐mapping was used to populate discourse frameworks and link ideas, events and words which in turn supported discourse structre and organisation. Use of visual prompts was gradually decreased as therapy progressed. Some pictorial resources were used to stimulate opinions (e.g. Skills for Daily Living: Social Behaviour, Speechmark, 2002), most topics were prompted from personal experiences. Procedures: metalinguistic approach to increase awareness of both sentence and discourse structure, at all times focusing attention on the word, sentence and discourse levels. Drew on developmental frameworks for discourse production used in the pedagogy of oral and written language. Word, sentence and discourse levels were integrated to increase metalinguistic awareness of specific microstructure elements of language, followed by frameworks for macrostructure that were used to scaffold the production of discourse across a range of everyday discourse genres. Once the principles of coherence were in place, cohesive devices were targeted. Self evaluation of performance was employed after each attempt using a visual scale that required self‐monitoring of performance on 7 different indices including success at finding nouns and verbs, to completing sentences, to structural components of the discourse sample, and overall clarity of the sample. Provided by: 2 speech and language therapists. Speech and language therapist professional and trial training. Delivery: 1‐to‐1, face‐to‐face, delivered predominantly within a clinical setting as most participants were inpatients at a rehabilitation hospital or attended outpatient services. In some instances, sessions were delivered in the participant's home. Regimen: 20 individual treatment sessions delivered, with few exceptions, 4 times weekly, over 5 weeks. Total dose = 20 h of therapy. In a small number of cases, participants could not commit to 4 x weekly sessions (over 5 weeks). Sessions were then spread over a longer period of time, e.g. 20 sessions delivered 3 times weekly over a (nearly) 7 week period. Tailoring: yes. Modification: the protocol was adhered to for each participant. Minor variations were permitted in delivery according to individual differences, e.g. more prompts could be provided in the presence of comprehension difficulties, greater elaboration of topics could be encouraged when participants were less severe to maintain motivation, visual templates could be faded out more quickly if participants showed a disinclination to them, but all core elements of the protocol were included. Adherence: regular discussion and recording a proportion of sessions on video to monitor adherence to the treatment protocol. Actual adherence: no instances of non‐adherence were noted in the sessions reviewed. The clinicians engaged in regular and informal reflection of delivery of the intervention. Client rating forms on their performance on all core elements of the protocol from each session that demonstrated that all components of the protocol had been focused on. 2. Conventional SLT Intervention: conventional SLT. Therapy focusing on training specific deficits. Materials: any SLT routinely used in clinical practice. Access to all assessment data with the exception of the Curtin University Discourse Protocol (CUDP) data. Procedures: based on usual practice procedures around goal setting ‐ exercises including sentence completion, improving patients' retrieval of words, learning sentence patterns, conversation on current topics, listening, to words, and repeating and following instructions. The therapist initiated the communicative activities. The aimed to target several modes of communication. Participants were permitted to use any communication mode, including non‐verbal communication. aimed to improve word or sentence production, reading, writing or more functional activities that frequently drew on several domains. Discourse could be included in usual care as a context for generalisation of therapy targets. Provided by: speech and language therapists. Training not reported. Delivery: 1‐to‐1, face‐to‐face, delivered predominantly within a clinical setting as most participants were inpatients at a rehabilitation hospital or attended outpatient services. In some instances, sessions were delivered in the participant's home. Regimen: 20 individual treatment sessions delivered, with few exceptions, 4 times weekly, over 5 weeks. Total dose = 20 h of therapy. In a small number of cases, participants could not commit to 4 x weekly sessions (over 5 weeks). Sessions were then spread over a longer period of time, e.g. 20 sessions delivered 3 times weekly over a (nearly) 7‐week period.Tailoring: yes, individualised to patient needs. Modification: the protocol was adhered to for each participant. Minor variations were permitted in delivery according to individual differences, e.g. more prompts could be provided in the presence of comprehension difficulties, greater elaboration of topics could be encouraged when participants were less severe to maintain motivation, visual templates could be faded out more quickly if participants showed a disinclination to them, but all core elements of the protocol were included. Adherence: regular discussion and recording a proportion of sessions on video to monitor adherence to the treatment protocol. Actual adherence: no instances of non‐adherence were noted in the sessions reviewed. The clinicians engaged in regular and informal reflection of delivery of the intervention. Client rating forms on their performance on all core elements of the protocol from each session that demonstrated that all components of the protocol had been focused on. | |
| Outcomes | Primary outcomes: Curtin University Discourse Protocol at word, sentence and discourse performance levels across 4 discourse genre Secondary outcomes: WAB‐R: bedside; and conceptual semantics (nouns – Pyramid and Palmtrees Test); verbs – Kissing and Dancing Test; Object and Action naming Battery Druks 2000, Northwestern Test of Verbs and Sentences (NAVS) (verb comprehension and verb naming subtests). Sentence level measures. NAVS Sentence Comprehension Test. Argument Structure Production Test of the NAVS (with and without lexical support) (Thompson 2011), Sentence Generation Test Data collection: baseline, and postintervention (at 5 weeks). Follow‐up at 4 to 5 weeks | |
| Notes | Statistical data included within the review meta‐analyses | |
| Risk of bias | ||
| Bias | Authors' judgement | Support for judgement |
| Random sequence generation (selection bias) | Low risk | Computerised random numbers |
| Allocation concealment (selection bias) | Low risk | Adequate. Conducted offsite by a person independent to the research team |
| Blinding (performance bias and detection bias) | Low risk | 2 experienced independent assessors who remained blind to treatment allocation |
| Incomplete outcome data (attrition bias) | Low risk | No dropouts |
| Selective reporting (reporting bias) | Low risk | All prespecified outcomes reported |
| Other bias | Low risk | Groups comparable at baseline |
| Methods | RCT, USA | |
| Participants | Inclusion criteria: right‐handed, non‐fluent aphasia, single left ischaemic stroke at least 6 months postonset A non‐randomised third group that acted as a control group was also included in the study report but was excluded from this review Details of participants are shown in Table 1 | |
| Interventions | 1. High‐intensity SLT Intervention: Oral Reading for Language in Aphasia (ORLA) Virtual therapist that people can use independently to recover or relearn language. Materials: based on neuropsychological models of reading. Connected discourse, 4 levels of difficulty based on length and reading level. Procedures: repeated practice of reading aloud sentences. Provided by: virtual therapist and RA to support technology set up and some social interaction. Delivery: computer facilitated; 1‐to‐1; aphasia clinic (outpatient). Regimen: 10 h therapy weekly for 6 weeks. Total dose = 60 h therapy. Tailoring: selection of appropriate levels of difficulty for individual participants. Modification: clear protocol of progressive levels of difficulty. Adherence: not reported. 2. Low‐intensity SLT Intervention: Oral Reading for Language in Aphasia (ORLA) Virtual therapist that people can use independently to recover or relearn language. Materials: based on neuropsychological models of reading. Connected discourse, 4 levels of difficulty based on length and reading level. Procedures: repeated practice of reading aloud sentences. Provided by: virtual therapist and RA to support technology set up and some social interaction. Delivery: face‐to‐face; 1‐to‐1 and group; aphasia clinic (outpatient). Regimen: 4 h weekly for 6 weeks. Total dose = 24 h therapy. Tailoring: selection of appropriate levels of difficulty for individual participants. Modification: clear protocol of progressive levels of difficulty. Adherence: not reported. | |
| Outcomes | Primary outcome: WABAQ Data collection: baseline and treatment end (6 weeks) | |
| Notes | Statistical data included within the review meta‐analyses | |
| Risk of bias | ||
| Bias | Authors' judgement | Support for judgement |
| Random sequence generation (selection bias) | Unclear risk | Not reported |
| Allocation concealment (selection bias) | Unclear risk | Not reported |
| Blinding (performance bias and detection bias) | Unclear risk | Not reported |
| Incomplete outcome data (attrition bias) | Low risk | All randomised participants included in analyses |
| Selective reporting (reporting bias) | Low risk | All prespecified outcomes reported |
| Other bias | Unclear risk | Groups seem to be comparable at baseline |
| Methods | RCT, USA | |
| Participants | Inclusion criteria: chronic aphasia (> 12 months), single left ischaemic stroke, non‐fluent aphasia, right‐handed, 12th grade education, visual acuity no worse than 20.100 corrected in the better eye, auditory acuity no worse than 30 dB HL at 500, 1000, 2000 Hz aided in the better ear Details of participants are shown in Table 1 | |
| Interventions | 1. Computer‐facilitated SLT Intervention: "Oral Reading for Language in Aphasia". Virtual therapist that people can use independently to recover or relearn language. Material based on neuropsychological models of reading. Materials: connected discourse, 4 levels of difficulty based on length and reading level. Procedures: repeated practice of reading aloud sentences. The person with aphasia systematically and repeatedly reads aloud sentences and paragraphs, first in unison with the clinician and then independently Provided by: virtual therapist and research assistant to support technology set up and some social interaction Delivery: computer facilitated; 1‐to‐1; aphasia clinic (outpatient). Regimen: 1 h therapy, 2‐3 times week, for total of 24 sessions (mean 11.4 weeks) (range 6 to 16 weeks). Total dose = 24 h therapy. Tailoring: selection of appropriate levels of difficulty for individual participants. Modification: clear protocol of progressive levels of difficulty. Adherence: all randomised participants included in analyses. 2. Therapist‐facilitated SLT Intervention: "Therapist‐facilitated SLT". Rationale not reported. Materials: neuropsychologically based connected discourse, 4 levels of difficulty based on length and reading level. Procedures: the person with aphasia systematically and repeatedly reads aloud sentences and paragraphs, first in unison with the clinician. Provided by: speech and language therapist. Delivery: 1‐to‐1, face‐to‐face, aphasia centre. Regimen: 1 h therapy, 2‐3 times per week, for up to 24 sessions (mean 13.31 weeks, range 9 to 22 weeks). Total dose = 24 h therapy. Tailoring: selection of appropriate levels of difficulty for individual participants. Modification: clear protocol of progressive levels of difficulty. Adherence: all randomised participants included in analyses | |
| Outcomes | Primary outcomes: WABAQ, WAB‐reading, WAB‐writing, discourse content information units per minute, discourse words per minute Data collection: baseline (and again pre‐treatment), post‐treatment | |
| Notes | Statistical data included within the review meta‐analyses | |
| Risk of bias | ||
| Bias | Authors' judgement | Support for judgement |
| Random sequence generation (selection bias) | Unclear risk | Not reported |
| Allocation concealment (selection bias) | Unclear risk | Not reported |
| Blinding (performance bias and detection bias) | Unclear risk | Not reported |
| Incomplete outcome data (attrition bias) | Low risk | All randomised participants included in analyses |
| Selective reporting (reporting bias) | Low risk | All prespecified outcomes reported |
| Other bias | Low risk | Sample size calculation not reported |
| Methods | Parallel group RCT, Netherlands | |
| Participants | Inclusion criteria: unilateral left CVA, minimum 3 months postonset, < 80% on auditory comprehension test, good prognosis for auditory comprehension per SLT, motivated and fit for participation Details of participants are shown in Table 1 | |
| Interventions | 1. Task specific SLT Intervention: "Systematic Therapy Programme for Auditory Comprehension Disorders (STACDAP) SLT". Treatment for auditory comprehension. Materials: pictures, audio tape recordings, picture matching tasks, picture sentence matching. Procedures: a series of 28 tasks; non‐verbal, phonology, lexical‐semantics and morphosyntax each of increasing complexity. Provided by: SLT Delivery: 1‐to‐1, face‐to‐face, location not reported. Regimen (frequency (sessions weekly) x duration): 2 sessions weekly for 5 months. Total dose of therapy delivered over the intervention not reported. Tailoring: variety of tasks qualitatively and quantitatively allows tailoring for different patient's needs. Modification: yes. Adherence: methods not reported. All randomised participants included in analysis 2. Conventional SLT Intervention: "Conventional stimulation therapy". Conventional SLT (e.g. Darley 1972, Sarno 1976, Schuell et al 1964, Wepman 1951). Materials: no details providedProcedures: conventional SLT: references given to other descriptions of stimulation therapy (as above). Provided by: therapist Delivery: 1‐to‐1, face‐to‐face; location not reported. Regimen: 2 sessions weekly for 5 months. Total dose = not reported. Tailoring: individualised. Modification: individualised. Adherence: all randomised participants included in analysis. | |
| Outcomes | Primary outcomes: word discrimination, body‐part identification, Token Test, miscellaneous commands, reading comprehension, naming, sentence construction, spontaneous speech, STACDAP phonology, lexicon and morphosyntax | |
| Notes | Participants in additional 'no treatment' group were not randomly allocated but matched to other groups, and were therefore excluded from the review Statistical data included within the review meta‐analyses | |
| Risk of bias | ||
| Bias | Authors' judgement | Support for judgement |
| Random sequence generation (selection bias) | Unclear risk | Not reported |
| Allocation concealment (selection bias) | Unclear risk | Not reported |
| Blinding (performance bias and detection bias) | Unclear risk | Outcome assessor blinding not reported |
| Incomplete outcome data (attrition bias) | Low risk | All randomised participants included in analyses |
| Selective reporting (reporting bias) | Low risk | All prespecified outcomes reported |
| Other bias | Unclear risk | STACDAP SLT group were older than the conventional SLT group at baseline |
| Methods | Parallel group RCT, Germany | |
| Participants | Inclusion criteria: single left MCA stroke, monolingual, competent German speakers Details of participants are shown in Table 1 | |
| Interventions | 1. Constraint‐induced aphasia therapy SLT Intervention: "Constraint Induced Language Therapy" (CILT). Enhancing rehabilitation via brain plasticity, adopting model from motor rehabilitation. Materials: 32 cards with 16 pictures x 2, barriers preventing participant seeing others' cards. Procedures: CILT: small groups (2 to 3 participants) involving barrier therapeutic games; all communication verbal. Pointing or gestures not permitted. Constraint introduced by material used, verbal instructions and shaping and reinforcement contingencies. Provided by: speech and language therapist Delivery: group, face‐to‐face, location not reported. Regimen: 3‐4 h daily for 10 d. Total dose = mean 31.5 (range 23 to 33) h therapy. Tailoring: yes, variable levels of constraint. Modification: yes. variable levels of constraint. Adherence: methods not reported. All randomised participants included in analysis. 2. Conventional SLT Intervention: "Syndrome‐specific standard intervention" e.g. Conventional approaches reflecting current practice (e.g. Schuell 1974, Kotten 1993) Materials: not reported.Procedures: naming, repetition, sentence completion, following instructions, conversation topics of participants' own choice. Provided by: SLT. Delivery: 1‐to‐1, face‐to‐face, location not reported. Regimen: 2 to 3 h daily for 3 to 5 weeks. Total dose = mean 33.9 (range 20 to 54) h therapy. Tailoring: individualised. Modification: individualised. Adherence: methods not reported. All randomised participants included in analysis. | |
| Outcomes | Primary outcomes: AAT (Token Test, comprehension, repetition, naming), CAL Data collection: assessed at baseline and at end of treatment | |
| Notes | Dropouts are detailed in Table 2 Statistical data included within the review meta‐analyses | |
| Risk of bias | ||
| Bias | Authors' judgement | Support for judgement |
| Random sequence generation (selection bias) | Low risk | Computer‐generated |
| Allocation concealment (selection bias) | Unclear risk | Not reported |
| Blinding (performance bias and detection bias) | Low risk | Outcome assessor blinded |
| Incomplete outcome data (attrition bias) | Low risk | All randomised participants included in analyses |
| Selective reporting (reporting bias) | Low risk | All prespecified outcomes reported |
| Other bias | High risk | Constraint‐induced aphasia therapy SLT group were longer after stroke (mean 98.2 (SD 74.2) months) than conventional SLT group (mean 24 (SD 20.6) months) at baseline |
| Methods | Parallel group RCT, Netherlands | |
| Participants | Inclusion criteria: > 3 months after stroke, experiencing both semantic and phonological deficits, moderate/severe aphasia Details of participants are shown in Table 1 | |
| Interventions | 1. Semantic SLT Intervention: "Semantic SLT (BOX, Visch‐Brink 2001)". Aimed to enhance semantic processing. Materials: written materials Procedures: multiple choice, (right/wrong format), several levels of difficulty. Provided by: speech and language therapist trained in allocated intervention programme via workshops and in an individual session with patient. Delivery: 1‐to‐1, face‐to‐face, location not reported. Regimen: 1.5 to 3.0 h weekly, 2 or 3 sessions up to 40 weeks. Total does = 40 to 60 h therapy. Tailoring: increasing levels of difficulty possible, number of distractors, strength of semantic relation and frequency and abstractness of work. Modification: as above. Adherence: not reported. 2. Phonological SLT Intervention: "Phonological SLT (FIKS, V an Rijn 2000)". No therapy provision unlikely to be feasible or ethically acceptable. Materials: written materials.Procedures: sound structure targeting phonological input and output routes over 10 subparts e.g. rhyming consonant clusters, stress patterns, compiling words, syllabification, phonetic similarity. Provided by: speech and language therapist trained in allocated intervention programme via workshops and in an individual session with patient. Delivery: 1‐to‐1, face‐to‐face, location not reported. Regimen: 1.5 to 3 h in 2 to 3 sessions weekly for up to 40 weeks. Total dose = 40 to 60 h therapy. Tailoring: variation in degree of difficulty. Modification: not reported. Adherence: methods not reported. Not all participants completed. | |
| Outcomes | Primary outcomes: ANELT‐A, SAT, PALPA synonym judgement, PALPA repetition of non‐words, PALPA auditory lexical decision | |
| Notes | Comorbidity: memory and executive function impairment Statistical data included within the review meta‐analyses | |
| Risk of bias | ||
| Bias | Authors' judgement | Support for judgement |
| Random sequence generation (selection bias) | Low risk | Computer‐generated |
| Allocation concealment (selection bias) | Low risk | Sequentially numbered sealed opaque envelopes |
| Blinding (performance bias and detection bias) | Low risk | Outcome assessors blinded |
| Incomplete outcome data (attrition bias) | High risk | Trialists reported ITT employed but 3 participants not included (ANELT scores missing) |
| Selective reporting (reporting bias) | Low risk | All prespecified outcomes reported |
| Other bias | High risk | Semantic SLT group older than phonological SLT group |
| Methods | Parallel group, Multicentre RCT, (15 hospitals across the Netherlands and Belgium) | |
| Participants | Inclusion criteria: aphasia after stroke (haemorrhagic or ischaemic stroke) less than 3 weeks previous, 18‐85 years old, life expectancy of more than 6 months, verbal communication disorder (score < 44/50 on the ANELT‐A) and a semantic disorder (SAT ‐ verbal score of less than 26/30 or Semantic Association (PALPA) score < 12/15) or a phonological disorder (Nonword Repetition Test score < 20/24 or Auditory Lexical Decision score < 76/80) Exclusion criteria: severe dysarthria, developmental dyslexia, visual perceptual disorder, premorbid dementia or aphasia, recent psychiatric disorder Group 1: 41 participants Group 2: 44 participants Details of participants are shown in Table 1 | |
| Interventions | 1. Cognitive Linguistic SLT Intervention: "Cognitive Linguistic SLT". "Addressing specific neural networks involved in semantics and phonology by specific treatment activities might facilitate or speed up neural recovery processes". Materials: written and oral materials and some computer based Procedures: used BOX (Visch‐Brink 2001), a lexical semantic treatment programme or FIKS (van Rijn 2000) a phonological treatment programme, or a combination of the 2 depending on individual language disorders Provided by: speech and language therapist. Training not reported. Delivery: 1‐to‐1, face‐to‐face, computer and home practice, clinic or at home. Regimen: 2‐5 h weekly for 6 months (or shorter if fully recovered). Total dose = 52 h therapy. Tailoring: individualised to needs of patient by therapist. Modification: individualised Adherence: speech and language therapists recorded content and amount of therapy and discussed with trial office every 2‐3 weeks. Patient attendance at therapy recorded. Some dropouts recorded. 2. Communicative SLT Intervention: "communicative treatment". "Focuses on the disability, patients are trained to use their residual language skills combined with compensatory strategies in order to optimise information transfer". Targeted verbal and non‐verbal strategies to improve communication. Materials: PACE, roleplaying and conversational coaching. No focus on semantics, phonology or syntax permitted Procedures: written multiple choice, communication books. Exercises embedded in communicative setting. Provided by: speech and language therapist. Training not reported. Delivery: 1‐to‐1, face‐to‐face and home practice, clinic or at home. Regimen: 2‐5 h weekly for 6 months (or shorter if fully recovered). Total dose = 52 h therapy. Tailoring: individualised. Modification: individualised. Adherence: speech and language therapists recorded content and amount of therapy and discussed with trial office every 2‐3 weeks. Patient attendance at therapy recorded. Some dropouts recorded. | |
| Outcomes | Primary outcome: ANELT‐A | |
| Notes | Dropouts: 10 (cognitive linguistic SLT 4; communicative SLT 6). Dropouts are detailed in Table 2 Statistical data included within the review meta‐analyses | |
| Risk of bias | ||
| Bias | Authors' judgement | Support for judgement |
| Random sequence generation (selection bias) | Low risk | Randomisation stratified by centre |
| Allocation concealment (selection bias) | Low risk | Uninvolved member of staff enclosed assignments in sealed sequentially numbered opaque envelopes stored in a drawer |
| Blinding (performance bias and detection bias) | Unclear risk | Assessment of primary outcome (ANELT‐A) was rated by 2 independent therapists blinded to treatment allocation and time point of assessment |
| Incomplete outcome data (attrition bias) | Low risk | ITT analysis employed |
| Selective reporting (reporting bias) | Low risk | All prespecified outcomes reported |
| Other bias | Low risk | Sample size calculation reported Groups comparable at baseline except for sex |
| Methods | Parallel group RCT, Canada | |
| Participants | Inclusion criteria: chronic Broca's aphasia (BDAE), produce sufficient speech for analyses, single left hemisphere stroke, native English speaker, normal hearing on screening Details of participants are shown in Table 1 | |
| Interventions | 1. Sentence mapping Intervention: SLT. Mapping therapy to address "mapping deficit" targets comprehension impairment but anticipating gains in production. This intervention aimed to target production in nonfluent aphasia based on mapping therapy approach. Cueing approach. Level 1 ‐ agent cue to produce sentence. Level 2 ‐ 1 agent cue to produce theme cue. Level 3 ‐ identification of both roles in fixed order. Level 4 ‐ role identification varied and randomised. 4 sentence structures trained ‐ active, subject, cleft, passive and object cleft sentences. Canonical and non‐canonical sentences were also closely matched. (Sample of treatment protocol provided Rochon 2005). Materials: stimuli came from large sentence bank of > 500 semantically reversible sentences. 144 sentences in treatment phase. Stimuli to elicit sentences were colour photos of actors clearly depicting action taken against a plain backdrop. 2 small black/white icons used to reinforce difference between agent/theme in target sentence. 6 sets of 24 sentences. Random order of presentation. Procedures: each session 12 sentences levels 1‐2 and 24 at levels 3‐4. Provided by: trained RA. Delivery: face‐to‐face; 1‐to‐1; location not reported. Regimen: 1‐h session twice weekly for approximately 2.5 months. Total dose (estimated) = 22 h therapy. Tailoring: not reported. Modification: not reported. Adherence: no dropouts. 2. Social support Intervention: attention "control intervention". Materials: none. Narrative re‐telling task Rochon 1994. Procedures: unstructured conversation about current events. Narrative retelling task on alternate sessions. Provided by: trained RA Delivery: 1‐to‐1, face‐to‐face, location not reported. Regimen: 1 h session twice weekly for approximately 2.5 months. Total dose (estimated) = 22 h therapy. Tailoring: not reported. Modification: not reported. Adherence: no dropouts. | |
| Outcomes | Outcomes: trained sentence structures: active, subject cleft, assive, object cleft; CHSPT; Picture Description and Structure Modeling Test; narrative task: mean length of utterance, percentage words in sentences, percentage well‐formed words, sentence elaboration index; PCB (reversible sentences); Picture Comprehension Test Social support and stimulation group also participated in between level probes | |
| Notes | Only 1 Group 1 participant entered all 4 levels; 1 only entered levels 1 and 2 (did not need levels 3 to 4); 1 participant entered levels 1, 2 and 4. Statistical data included within the review meta‐analyses | |
| Risk of bias | ||
| Bias | Authors' judgement | Support for judgement |
| Random sequence generation (selection bias) | Unclear risk | Not reported |
| Allocation concealment (selection bias) | Unclear risk | Not reported |
| Blinding (performance bias and detection bias) | High risk | Outcome assessor blinding inadequate |
| Incomplete outcome data (attrition bias) | Low risk | All randomised participants included in analyses |
| Selective reporting (reporting bias) | Low risk | All prespecified outcomes reported |
| Other bias | Unclear risk | Sample size calculation not reported Groups comparable at baseline |
| Methods | Cross‐over RCT (only data prior to cross‐over treatment included in this review), UK | |
| Participants | Inclusion criteria: at least 3 months poststroke onset of aphasia following a single symptomatic stroke. Word retrieval difficulty (10%‐60% of 150 item naming test) 25 randomised participants. Numbers allocated to the 2 groups is as yet not reported. Details of participants are shown in Table 1 | |
| Interventions | 1. Semantic Feature Analysis Intervention: Semantic Feature Analysis. Materials: the items assigned to this condition by the randomisation procedure.Procedures: protocol based. A very precise and detailed treatment procedure, negotiated with Prof Mary Boyle as owner/originator of SFA (Boyle 1995). Provided by: research therapist. Details of experience not reported. Delivery: not reported. Regimen: 2 sessions per week of 45 min over 6 weeks. Total dose = 9 h therapy. Tailoring: not reported. Modification: not reported. Adherence: not reported. 2. Repetition in the Presence of a Picture Intervention: repetition in the presence of a picture. Materials: not reported. Procedures: protocol based. A very precise and detailed treatment procedure, negotiated with Prof Lyndsey Nickels as 1 of the most prominent users/promoters of this treatment method. Provided by: research therapist. Details of experience not reported.Delivery: not reported.Regimen: 2 sessions per week of 45 min over 6 weeks. Total dose = 9 h therapy. Tailoring: not reported. Modification: not reported. Adherence: not reported. | |
| Outcomes | Primary outcomes: picture naming test (150 items) Secondary outcomes: word retrieval in spontaneous speech, QoL, semantic abilities, Data collection: baseline, post‐therapy 1 (cross‐over baseline 2, post‐therapy 2, follow‐up ‐ 6 weeks. Data following cross‐over are not included in this review) | |
| Notes | UKCRN ID 10507 Dropouts are detailed in Table 2 | |
| Risk of bias | ||
| Bias | Authors' judgement | Support for judgement |
| Random sequence generation (selection bias) | Low risk | External randomisation service |
| Allocation concealment (selection bias) | Low risk | Not reported (External randomisation service) |
| Blinding (performance bias and detection bias) | Low risk | Yes. Assessor blinded to therapy |
| Incomplete outcome data (attrition bias) | Unclear risk | Dropouts accounted for (25 participants enrolled, 2 died during trial and data for 23 completers analysed |
| Selective reporting (reporting bias) | Unclear risk | Insufficient data available at present, complete trial data report not yet published |
| Other bias | Unclear risk | Partial trial data available in 2 conference papers, and a presentation, but complete trial data report not yet published |
| Methods | Parallel group RCT (stratified for type and severity of aphasia), Canada | |
| Participants | Inclusion criteria: unilateral first CVA, Global, Broca's, Wernicke's, anomic, conduction per WAB, occlusive/stable intracerebral haemorrhagic stroke, functional English speakers Details of participants are shown in Table 1 | |
| Interventions | 1. Language Orientated Therapy SLT Intervention: "Language Orientated Therapy (LOT)". Based on psycholinguistic principles Materials: detailed in Shewan 1986 Procedures: detailed in Shewan 1986 Provided by: speech and language therapist. Trained in intervention. Delivery: 1‐to‐1, face‐to‐face; location not reported. Regimen: 1 h session 3 times weekly for 1 year (or 1.5 h twice weekly) for 12 months. Total dose = 156 h therapy. Tailoring: not reported. Modification: not reported. Adherence: fidelity to treatment delivery protocol reviewed 6 monthly by external therapist. Dropout rate recorded. 2. Conventional SLT Intervention: stimulation‐facilitation therapy based on Schuell and Wepman's approaches. Materials: not reported Procedures: not reported Provided by: speech and language therapist. Trained in intervention. Delivery: face‐to‐face; 1‐to‐1; location not reported. Regimen: 1 h session 3 times weekly for 1 year (or 1.5 h twice weekly) for 12 months. Total dose = 156 h therapy. Tailoring: not reported. Modification: not reported. Adherence: fidelity to treatment delivery protocol reviewed 6 monthly by external therapist. Dropout rate recorded. | |
| Outcomes | Primary outcomes: WAB, ACTS | |
| Notes | Participants refusing or unable to participate were allocated to a third no‐treatment group. This group were not included in this review Data reported unsuitable for inclusion within the review meta‐analyses | |
| Risk of bias | ||
| Bias | Authors' judgement | Support for judgement |
| Random sequence generation (selection bias) | Unclear risk | Not reported |
| Allocation concealment (selection bias) | Unclear risk | Not reported |
| Blinding (performance bias and detection bias) | Unclear risk | Outcome assessor blinding not reported |
| Incomplete outcome data (attrition bias) | High risk | ITT analysis not employed |
| Selective reporting (reporting bias) | Low risk | All prespecified outcomes reported |
| Other bias | Unclear risk | Sample size calculation not reported |
| Methods | Parallel group RCT (stratified for type and severity of aphasia), Canada | |
| Participants | Inclusion criteria: unilateral first CVA, Global, Broca's, Wernicke's, anomic, conduction per WAB, occlusive/stable intracerebral haemorrhagic stroke, functional English speakers Details of participants are shown in Table 1 | |
| Interventions | 1. Language Orientated Therapy SLT Intervention: "Language Orientated Therapy (LOT)". Based on psycholinguistic principles Materials: detailed in Shewan 1986 Procedures: detailed in Shewan 1986 Provided by: therapist trained in intervention. Delivery: 1‐to‐1, face‐to‐face; location not reported. Regimen: 1‐h session 3 times weekly for 1 year (or 1.5 h twice weekly) for 12 months. Total dose = 156 h therapy. Tailoring: not reported. Modification: not reported. Adherence: fidelity to treatment delivery protocol reviewed 6 monthly by external therapist. Dropout rate recorded. 2. Social support Intervention: "Social stimulation and support". Rationale not reported. Materials: based on stimulation orientation, providing psychological support, communication in unstructured settings. Procedures: communication stimulation Provided by: trained nurses (mostly). Given information about aphasia and instructed to stimulate communication to the best of their ability. They were neither permitted or expected to gain additional speech‐language pathology experience". Delivery: 1‐to‐1, face‐to‐face, "unstructured settings". Regimen: 1‐h session 3 times weekly for 1 year (or 1.5 h twice weekly) for 12 months. Total dose = 156 h. Tailoring: not reported. Modification: not reported. Adherence: fidelity monitored. Dropout rate recorded. | |
| Outcomes | Primary outcomes: WAB, ACTS | |
| Notes | Participants refusing or unable to participate were allocated to a third no‐treatment group but were not included in this review Data reported unsuitable for inclusion within the review meta‐analyses | |
| Risk of bias | ||
| Bias | Authors' judgement | Support for judgement |
| Random sequence generation (selection bias) | Unclear risk | Not reported |
| Allocation concealment (selection bias) | Unclear risk | Not reported |
| Blinding (performance bias and detection bias) | Unclear risk | Outcome assessor blinding not reported |
| Incomplete outcome data (attrition bias) | High risk | ITT analysis not employed |
| Selective reporting (reporting bias) | Low risk | All prespecified outcomes reported |
| Other bias | Unclear risk | Sample size calculation not reported |
| Methods | Parallel group RCT (stratified for type and severity of aphasia), Canada | |
| Participants | Inclusion criteria: unilateral first stroke, Global, Broca's, Wernicke's, anomic, conduction as per WAB, occlusive or stable intracerebral haemorrhagic stroke, functional English speakers Details of participants are shown in Table 1 | |
| Interventions | 2. Conventional SLT Intervention: stimulation‐facilitation therapy based on Schuell and Wepman's approaches. Materials: not reported Procedures: not reported Provided by: speech and language therapist. Trained in intervention. Delivery: face‐to‐face; 1‐to‐1; location not reported. Regimen: 1 h session 3 times weekly for 1 year (or 1.5 h twice weekly) for 12 months. Total dose = 156 h therapy. Tailoring: not reported. Modification: not reported. Adherence: fidelity to treatment delivery protocol reviewed 6 monthly by external therapist. Dropout rate recorded. 2. Social support Intervention: "Social stimulation and support". Rationale not reported. Materials: based on stimulation orientation, providing psychological support, communication in unstructured settings. Procedures: communication stimulation Provided by: trained nurses (mostly). Given information about aphasia and instructed to stimulate communication to the best of their ability. They were neither permitted or expected to gain additional speech‐language pathology experience".Delivery: 1‐to‐1, face‐to‐face, "unstructured settings". Regimen: 1 h session 3 times weekly for 1 year (or 1.5 h twice weekly) for 12 months. Total dose = 156 h. Tailoring: not reported. Modification: not reported. Adherence: fidelity monitored. Dropout rate recorded. | |
| Outcomes | Primary outcomes: WAB, ACTS | |
| Notes | Participants refusing or unable to participate were allocated to a third no‐treatment group but were not included in this review Data reported unsuitable for inclusion within the review meta‐analyses | |
| Risk of bias | ||
| Bias | Authors' judgement | Support for judgement |
| Random sequence generation (selection bias) | Unclear risk | Not reported |
| Allocation concealment (selection bias) | Unclear risk | Not reported |
| Blinding (performance bias and detection bias) | Unclear risk | Outcome assessor blinding not reported |
| Incomplete outcome data (attrition bias) | High risk | ITT analysis not employed |
| Selective reporting (reporting bias) | Low risk | All prespecified outcomes reported |
| Other bias | Unclear risk | Sample size calculation not reported |
| Methods | RCT, Germany | |
| Participants | Inclusion criteria: first‐ever stroke with aphasia in the sub‐acute stage defined as time since lesion onset from 1 to 4 months poststroke. Aphasia as per Aachener Aphasia Test (AAT). All patients had to understand the rules of the game for the CIAT group. This requirement was assessed by a test game. If the patients satisfied the criteria of understanding the aim of the game, naming of items with therapeutic help and identifying 1 of 4 presented cards with object drawings, they were included in the study. All participants were native German speakers. Pre‐morbid handedness was assessed with the Edinburgh Handedness Inventory Details of participants are shown in Table 1 | |
| Interventions | 1. Constraint‐induced aphasia therapy (CIAT) Intervention: CIAT. Avoiding learned non‐use phenomenon. Communication in verbal format has to be engaged with, thus forcing practice. Materials: therapeutic language games using card‐based object drawings, photos of everyday situations. Written language tasks (Meinzer 2005b). Visual barrier also used. Procedures: therapeutic language games. Massed practice, shaping and constraint of non‐verbal strategies. Where verbal skills good, writing to single word dictation used. Progressive degrees of difficulty built in. Also included 2 non‐aphasic patients from rehab centre in the group as groups members and 'able communicators'. Groups established of 4–6 patients plus speech therapist and 2 patients without aphasia (from the medical professional rehabilitation team). No home practice in the in the CIAT setting, but patients and relatives of both groups received professional advice. Provided by: speech and language therapist professional. Delivery: group, face‐to‐face with visual barrier between group members so they could not see each others' hands/cards, local rehab centre. Regimen: 2 h of training over 15 d. Total dose = 30 h of therapy. Tailoring: yes. The rules of communication were formulated, individualised for each participant and were gradually increased. The therapist provided as much cueing as necessary, depending on the level of each participant's verbal ability, for a successful response. Modification: yes, individualised to patient needs. After discharge from research programme continued to receive outpatient treatment at a comparable intensity level at an average of 1.9 h per week. Adherence: progressive difficulty, addition of writing tasks. Monitored. 2. Conventional SLT Intervention: conventional SLT. Usual care. Materials: not reported Procedures: standard SLT 'focused on training specific deficits' e.g. sentence completion, improving patients' retrieval of words, learning sentence patterns, conversation on current topics, listening to words, and repeating and following instructions. The therapist initiated the communicative activities. The interventions aimed to target several modes of communication. Provided by: speech and language therapists. Training not reported. Delivery: 1‐to‐1, face‐to‐face, local rehab centre. Regimen: 2 h of training over 15 d. Total dose = 30 h of therapy. Tailoring: yes. Modification: yes, individualised to patient needs. After discharge from research programme continued to receive outpatient treatment at a comparable intensity level at an average of 2.13 h per week. Adherence: progressive difficulty, addition of writing tasks. Monitored. | |
| Outcomes | Primary outcomes: Aachen Aphasia Test Secondary outcomes: Communicative Activity Log (short version) Data collection: baseline, at 3 weeks (i.e. immediately post‐training). Follow‐up 8 weeks and 1 year | |
| Notes | Dropouts are detailed in Table 2 Statistical data included within the review meta‐analyses | |
| Risk of bias | ||
| Bias | Authors' judgement | Support for judgement |
| Random sequence generation (selection bias) | Low risk | Computer‐generated randomisation code |
| Allocation concealment (selection bias) | Low risk | Adequate |
| Blinding (performance bias and detection bias) | Low risk | Yes. Speech and language therapists not involved in study |
| Incomplete outcome data (attrition bias) | High risk | Dropouts not accounted for |
| Selective reporting (reporting bias) | Low risk | All prespecified outcomes reported |
| Other bias | Low risk | Groups comparable at baseline for age, sex, aetiology, handedness, aphasia syndrome, time postonset mean = 34.8 d; premorbid education (6 to 12 years) (M=9.2); severity AAT spontaneous speech |
| Methods | Parallel group RCT, Italy | |
| Participants | Inclusion criteria: left unilateral CVA, limb apraxia lasting a minimum of 2 months, aphasia Details of participants are shown in Table 1 | |
| Interventions | 1. Conventional SLT Intervention: "Conventional treatment for aphasia". Attention control for limb apraxia therapy intervention based on Basso 1979 approach. Materials: not reported. Procedures: not reported. Provided by: speech and language therapist. Delivery: not reported. Regimen: 50 minutes 3 times weekly for 10 weeks. Total dose = 25 h therapy. Tailoring: not reported. Modification: not reported. Adherence: not reported. 2. No SLT Intervention: "Limb apraxia therapy only" . Materials: not reported. Procedures: not reported. Provided by: not reported. Delivery: not reported. Regimen: 50 minutes 3 times weekly for 10 weeks. Total dose = 25 h therapy. Tailoring: not reported. Modification: not reported. Adherence: not reported. | |
| Outcomes | Primary outcomes: Token Test, Gestural comprehension (not described) | |
| Notes | All participants had apraxia Statistical data included within the review meta‐analyses | |
| Risk of bias | ||
| Bias | Authors' judgement | Support for judgement |
| Random sequence generation (selection bias) | Low risk | Random numbers table |
| Allocation concealment (selection bias) | High risk | Co‐ordinating trialists allocated participants to groups |
| Blinding (performance bias and detection bias) | Low risk | Outcome assessor blinded |
| Incomplete outcome data (attrition bias) | High risk | ITT was not employed |
| Selective reporting (reporting bias) | Unclear risk | Not all of the prespecified outcomes were reported. Discrepancy between the reporting of comprehension language tests as 'significant improvement' in the text but then the table says they are 'ns' or non‐significant with a P value of < 0.01. |
| Other bias | Unclear risk | Sample size calculation not reported |
| Methods | Parallel group RCT (subgroup within larger trial), UK | |
| Participants | Inclusion criteria: hospital catchment area, measurable residual neurological deficit, no life‐threatening concurrent illness, fit for intensive therapy, independent prior to stroke, inpatient for not more than 2 months after stroke Details of participants are shown in Table 1 | |
| Interventions | 1. High‐intensity SLT Intervention: "Intensive SLT". Investigating intensity of therapy. Materials: not reported. Procedures: not reported. Provided by: speech and language therapist. Delivery: 1‐to‐1, face‐to‐face; rehabilitation department (as outpatient). Regimen: 1 h 4 times weekly for up to 12 months. Total dose = up to 208 h therapy. Tailoring: not reported. Modification: not reported. Adherence: per protocol intent was 50 h of therapy but only 21 h (group not reported) 2. No SLT Intervention: no SLT. Materials: none. Procedures: none. Provided by: none but usual poststroke care e.g. visit from health visitors but frequency not reported Delivery: none Regimen: none. Tailoring: none. Modification: none. Adherence: none. | |
| Outcomes | Primary outcomes: MTDDA, GHQ | |
| Notes | Difficult to maintain intensive SLT input after first 3 months Statistical data reported unsuitable for inclusion within the review meta‐analyses | |
| Risk of bias | ||
| Bias | Authors' judgement | Support for judgement |
| Random sequence generation (selection bias) | Unclear risk | Not reported |
| Allocation concealment (selection bias) | Unclear risk | Not reported |
| Blinding (performance bias and detection bias) | High risk | Outcome assessors not blinded |
| Incomplete outcome data (attrition bias) | High risk | ITT analysis not employed |
| Selective reporting (reporting bias) | High risk | Statistical data not available (personal communication) |
| Other bias | Unclear risk | 20 patients in main trial had mild dementia, not reported whether any were participants with aphasia |
| Methods | Parallel group RCT (subgroup within larger trial), UK | |
| Participants | Inclusion criteria: lives in hospital catchment area, measurable residual neurological deficit, no life‐threatening concurrent illness, fit for intensive therapy if assigned, independent prior to stroke, inpatient for not more than 2 months postonset Details of participants are shown in Table 1 | |
| Interventions | 1. Conventional SLT Intervention: "Conventional SLT". Investigating intensity of therapy. Materials: not reported. Procedures: not reported. Provided by: speech and language therapist. Delivery: 1‐to‐1 (5 also received group therapy), face‐to‐face; rehabilitation department (as outpatient). Regimen: 40 minutes twice weekly for up to 12 months. Total dose = up to 69.3 h therapy. Tailoring: not reported. Modification: not reported. Adherence: unclear. 2. No SLT Intervention: no SLT. Materials: none. Procedures: none. Provided by: none but usual poststroke care e.g. visit from health visitors but frequency not reported Delivery: none Regimen: none. Tailoring: none. Modification: none. Adherence: none. | |
| Outcomes | Primary outcomes: MTDDA, GHQ | |
| Notes | Participants also receiving physiotherapy and occupational therapy Statistical data reported unsuitable for inclusion within the review meta‐analyses | |
| Risk of bias | ||
| Bias | Authors' judgement | Support for judgement |
| Random sequence generation (selection bias) | Unclear risk | Not reported |
| Allocation concealment (selection bias) | Unclear risk | Not reported |
| Blinding (performance bias and detection bias) | High risk | Outcome assessors not blinded |
| Incomplete outcome data (attrition bias) | High risk | ITT analysis not employed |
| Selective reporting (reporting bias) | High risk | Statistical data not available, personal communication |
| Other bias | Unclear risk | 20 patients in main trial had mild dementia, not reported whether any were participants with aphasia |
| Methods | Parallel group RCT (subgroup within larger trial), UK | |
| Participants | Inclusion criteria: lives in hospital catchment area, measurable residual neurological deficit, no life‐threatening concurrent illness, fit for intensive therapy if assigned, independent prior to stroke, inpatient for not more than 2 months postonset Details of participants are shown in Table 1 | |
| Interventions | 1. High‐intensity SLT Intervention: "Intensive SLT". Investigating intensity of therapy. Materials: not reported. Procedures: not reported. Provided by: speech and language therapist. Delivery: 1‐to‐1, face‐to‐face; rehabilitation department (as outpatient). Regimen: 1 h 4 times weekly for up to 12 months. Total dose = up to 208 h therapy. Tailoring: not reported. Modification: not reported. Adherence: per protocol intent was 50 h of therapy but only 21 h (group not reported) 2. Conventional SLT Intervention: "Conventional SLT". Investigating intensity of therapy. Materials: not reported. Procedures: not reported. Provided by: speech and language therapist. Delivery: 1‐to‐1 (5 also received group therapy), face‐to‐face; rehabilitation department (as outpatient). Regimen: 40 minutes twice weekly for up to 12 months. Total dose = up to 69.3 h therapy. Tailoring: not reported. Modification: not reported. Adherence: not reported. | |
| Outcomes | Primary outcomes: MTDDA, GHQ | |
| Notes | Distinction between intensive and conventional became impossible to maintain after first 3 months as individual patterns of therapy attendance emerged; in first 3 months mean 21/50 h intended Statistical data reported unsuitable for inclusion within the review meta‐analyses | |
| Risk of bias | ||
| Bias | Authors' judgement | Support for judgement |
| Random sequence generation (selection bias) | Unclear risk | Not reported |
| Allocation concealment (selection bias) | Unclear risk | Not reported |
| Blinding (performance bias and detection bias) | High risk | Outcome assessors not blinded |
| Incomplete outcome data (attrition bias) | High risk | ITT analysis not employed |
| Selective reporting (reporting bias) | High risk | Statistical data not available, personal communication |
| Other bias | Unclear risk | 20 patients in main trial had mild dementia, unclear whether any were participants with aphasia |
| Methods | RCT, Portugal | |
| Participants | Inclusion criteria: aged 40‐80 years; native Portuguese speaker; brain imaging confirming a single left hemisphere infarct of the MCA territory; Aphasia quotient (AQ) (the arithmetic mean of the percentage score obtained in fluency, object naming, word repetition and sentence comprehension subtests of the Lisbon Aphasia Battery (BAAL) (Castro‐Caldas 1979), ranging between 6 and 77, comprising mild/moderate (50–77) and severe (6–49) aphasia; willingness to participate; and personal or family member written consent. Details of participants are shown in Table 1 | |
| Interventions | 1. High‐intensity SLT Intervention: intensive SLT. Intensity of therapy thought to be important component of intervention but study controls for amount. Materials: all therapists used same materials (not specified). Procedures: multimodal Stimulation Approach (MSA) (Duffy 2001). Based on stimulation, facilitation, motivation. Each linguistic modality is used to stimulate another following a programme of progressive complexity. Activities: picture confrontation naming, naming from definition and description, description of picture using complete sentences, phrase completion, comprehension of instruction exercises, yes/no questions, Wh‐ questions, detection of syntactic and semantic errors in incorrect phrases; interpretation of proverbs, reading and retelling daily news writing to dictation. Provided by: speech and language therapists supervised sessions. 5 professional speech and language therapists. Trained in MSA. Joint meetings to keep approach similar. Delivery: 1‐to‐1, face‐to‐face, 2 medical centres: SLT rehab outpatients with acute stroke unit and rehab centre with in‐and outpatients. Regimen: 2 h per day × 5 d per week, 10 weeks. Total dose = 100 h of therapy. Tailoring: yes. Modification: yes, individualised to patient needs. Adherence: monitored. If participants missed more than 5 h of consecutive therapy sessions then they were excluded from study. Unclear whether any were excluded for this reason alone. Also, non‐completions were recorded as death, transport or other logistical problems, or ill health 2. Low‐intensity SLT Intervention: low‐intensity SLT. Conventional SLT. Materials: all therapists used same materials (not specified). Procedures: Multimodal Stimulation Approach (Duffy 2001). Based on stimulation, facilitation, motivation. Each linguistic modality is used to stimulate another following a programme of progressive complexity. Activities: picture confrontation naming, naming from definition and description, description of picture using complete sentences, phrase completion, comprehension of instruction exercises, yes/no questions, Wh‐ questions, detection of syntactic and semantic errors in incorrect phrases; interpretation of proverbs, reading and retelling daily news writing to dictation. Provided by: speech and language therapists supervised sessions. 5 professional speech and language therapists. Trained in MSA. Joint meetings to keep approach similar. Delivery: 1‐to‐1, face‐to‐face, 2 medical centres (1) SLT rehab outpatients with acute stroke unit and (2) rehab centre with in‐and outpatients. Regimen: 2 h per week × 50 weeks. Total dose = 100 h of therapy. Tailoring: yes. Modification: yes, individualised to patient needs. Adherence: monitored. If participants missed more than 5 h of consecutive therapy sessions then they were excluded from study. Unclear whether any were excluded for this reason alone. Also, non‐completions were recorded as death, transport or other logistical problems, or ill health | |
| Outcomes | Primary outcomes: Aphasia Severity Rating Scale (ASRS) of the BDAE Secondary outcomes: subtests of speech fluency, object naming, word repetition and understanding simple commands of the Lisbon Aphasia Assessment Battery (BAAL) (Castro‐Caldas 1979) and estimation of AQ and subtests of Aachen Aphasia battery (Portuguese version, PAAT) (Huber 1983; Lauterbach 2008) namely, the Token Test, reading comprehension for words and sentences and writing to dictation. Functional Communication Profile (FCP) (Sarno 1969) and Stroke Aphasia Depression Questionnaire—SAD‐Q (Portuguese version) (Rodrigues 2006; Stutcliffe 1998) Data collection: baseline, postintensive SLT (10 weeks), postusual SLT (50 weeks). Follow‐up 3 months after intervention | |
| Notes | Portugal Dropouts are detailed in Table 2 Statistical data included within the review meta‐analyses | |
| Risk of bias | ||
| Bias | Authors' judgement | Support for judgement |
| Random sequence generation (selection bias) | Low risk | Computer‐generated randomisation code, stratified by baseline severity (AQ mild‐mod or severe) and in blocks of 8 |
| Allocation concealment (selection bias) | Low risk | Sequentially numbered opaque sealed envelopes |
| Blinding (performance bias and detection bias) | Low risk | Neurologist or speech and language therapist blinded to the therapeutic group |
| Incomplete outcome data (attrition bias) | Low risk | ITT analysis employed |
| Selective reporting (reporting bias) | Low risk | All prespecified outcomes reported |
| Other bias | Unclear risk | Sample size calculation (N=114) a priori |
| Methods | RCT, USA | |
| Participants | Inclusion criteria: history of LMCA stroke and residual moderate aphasia Details of participants are shown in Table 1 | |
| Interventions | 1. Constraint‐induced aphasia therapy (CIAT) Intervention: CIAT. Designed to promote verbal communication, and to limit compensatory non‐verbal strategies. Materials: not reported. Procedures: not reported. Provided by: 2 speech and language therapists, supervised sessions. Training not reported. Delivery: not reported if 1‐to‐1 or group, face‐to‐face, location not reported. Regimen: 10 daily sessions each 4 h long. Total dose = 40 h of therapy. Tailoring: yes (no details). Modification: yes (no details). Adherence: not reported. 2. No SLT Intervention: no SLT. Observation group. Materials: none. Procedures: none. Provided by: none. Delivery: none. Regimen: none. Tailoring: none. Modification: none. Adherence: none. | |
| Outcomes | Primary outcomes: Boston Naming Test Secondary outcomes: Semantic Fluency Test, Controlled Oral Word Association Test, Complex Ideational subtest of the BDAE, Peabody Picture Vocabulary Test Data collection: baseline, 1 week prior to intervention, within 1 week of intervention. Follow‐up 3 months after intervention | |
| Notes | Dropouts are detailed in Table 2 | |
| Risk of bias | ||
| Bias | Authors' judgement | Support for judgement |
| Random sequence generation (selection bias) | Unclear risk | Not reported |
| Allocation concealment (selection bias) | Unclear risk | Not reported |
| Blinding (performance bias and detection bias) | Low risk | Yes ‐ data collection team blinded until all assessment completed |
| Incomplete outcome data (attrition bias) | Unclear risk | Not reported |
| Selective reporting (reporting bias) | Unclear risk | Insufficient data available at present, complete trial data report not yet published |
| Other bias | Low risk | Groups were comparable at baseline (demographics, age, time from stroke, sex and co‐ morbidities) |
| Methods | Parallel group RCT, Netherlands | |
| Participants | Inclusion criteria: neurologically stable, > 3 months after stroke, aphasia, motivated, clear but 'not too severe' naming difficulties Details of participants are shown in Table 1 | |
| Interventions | 1. Task Specific Naming SLT Intervention: task‐specific SLT. Materials: therapy equipment for the practice of naming was formed by half the number of items of the naming test. The 40 images were distributed as follows: 10 animals, 10 objects from the house, 10 objects without any relation to each other and 10 action verbs. The therapy material for practicing the sentence making also contained half of the number of items that was used for the test for 'making sentences'. The 15 training sentences had the following structure: 3 sentences NP‐V, NP‐5 sentences V‐NP, and NP‐7 sentences V‐PP. Procedures: systematic tracking of a number of steps. The steps that must be carried out by the practitioner are dependent on the response of the patient. This response consists of a description (B), a semantic (C) or a phonological paraphasia (D), the therapist responds with cues as respectively: "Yes, it is to sleep in, so .." (bed) , "It's not a table, but a ...?" (chair), or "It's not unicorn, but ..?" (squirrel). If the patient after these cues did not give the right response, or no response (A), then the patient will be prompted for the initial sound of the target word. If the patient does not know the initial sound, then this is offered by the therapist. In the next step, the patient is invited to designate the target word on a map, where there are 4 words in large letters (the target word, a semantically related word, a phonetic‐cognate and non‐cognate) are presented. The final step in the practice consists of the repetition of the intended word. For the naming task: for each picture, the patient is first given the opportunity to produce the appropriate sentence. When the patient fails, the patient is helped depending on the response. The patient is helped with questions like, "Who is this? '(e.g. a girl), "What is she doing? "(e.g. letter) and "What do they write?" (e.g. letter). After the lack of proper response to any of these questions, the answer is always offered by the therapist. When the patient, despite these cues, is not able to produce the correct sense, the whole sentence is offered, which the patient has to repeat. In each therapy session, the 15 items were offered once. Provided by: phase 1: research speech and language therapists, phase 2: participant's own speech and language therapist Delivery: 1‐to‐1, face‐to‐face, location not reported. Regimen: phase 1: 1 h twice weekly for 6 weeks. Phase 2: 3 weeks 'free therapy'. Tailoring: individualised. Modification: individualised. Adherence: not reported 2. Conventional SLT Intervention: general stimulation speech and language therapy especially expressive tasks. Materials: not reported.Procedures: spontaneous language (approximately 15 minutes), repeating words (approximately 10 minutes), reading out sentences (about 10 minutes), and sentence construction (about 15 minutes). With the exception of spontaneous speech, the emphasis in all these tasks was on repeated exposure to the items. If the patient was not able to produce the correct response, the correct response was given by the therapist, and the patient repeated the response. The therapy material was the same for every patient. Provided by: speech and language therapist Delivery: 1‐to‐1, face‐to‐face, location not reported. Regimen: not reported but continued for 9 weeks. Tailoring: none. Modification: not reported. Adherence: not reported | |
| Outcomes | Outcome measures: FE‐Scale (expression), naming (test not specified), sentence construction (not described) | |
| Notes | Translated by Mrs Christine Versluis (Netherlands), Ms Floortje Klijn and Mr Bart Lamers (Netherlands) Statistical data included within the review meta‐analyses | |
| Risk of bias | ||
| Bias | Authors' judgement | Support for judgement |
| Random sequence generation (selection bias) | Unclear risk | Not reported |
| Allocation concealment (selection bias) | Unclear risk | Not reported |
| Blinding (performance bias and detection bias) | Unclear risk | Outcome assessor blinding not reported |
| Incomplete outcome data (attrition bias) | Low risk | All randomised participants included in analyses |
| Selective reporting (reporting bias) | Low risk | All prespecified outcomes reported |
| Other bias | Unclear risk | Groups comparable at baseline (age, time poststroke) |
| Methods | RCT (cross‐over), UK | |
| Participants | 50 participants randomised a Inclusion criteria: unilateral left‐hemisphere lesion, adults, at least 6 months poststroke, apraxia of speech Group 1: 25 participants reported Details of participants are shown in Table 1 | |
| Interventions | 1. Self administered computer programme therapy targeting whole word production and error reduction strategies ("Speech‐first") Intervention: computer SLT . Errorless learning, therapy delivered at level of sufficient level of difficulty and intensity to facilitate neuronal reorganisation. Materials: computer‐based programme. Procedures: participant practiced automatic, fluent, errorless speech production. Aim for non‐fluent speech attempts and struggle and groping reduced. Self administered for 6 weeks. Computer booted up at point where participant had previously left off. Provided by: self administered but with access to support if required. Delivery: computer‐facilitated, 1 to computer, at home. Regimen: average of 3.3 h/week delivered over 6 weeks. Total dose = approx 20 h of self administered therapy. Tailoring: automatic tailoring of level of difficulty within computer programme. Modification: none other than the automated process. Adherence: computer programme recorded activity, mean 1187 (SE 135.2; range 254‐3029) min 2. Visuo‐spatial sham computer programme ("Sham‐first") Intervention: no SLT. Sham programme, minimal speech/language content, visuo‐spatial problem solving. Materials: delayed matching of complex designs. Procedures: automatically booted up to where participants had left off at previous session. Provided by: self administered but with access to support if required. Delivery: computer‐facilitated, 1 to computer, at home. Regimen: self administered over 6 weeks. Total dose = up to approx 18 h of self administered therapy. Tailoring: automatic tailoring of level of difficulty within computer programme. Modification: none other than the automated process. Adherence: computer programme recorded activity, mean 1058 (SE 154.22; range137‐3129) min | |
| Outcomes | Primary outcomes: word Repetition Secondary outcomes: Comprehensive Aphasia Test (subtest Comprehension of Spoken Sentences); PALPA (written word to picture matching subtest); Picture naming test Data collection: baseline (x 2); post‐therapy 1; post‐therapy 2; follow‐up 8 weeks post‐therapy (time point 3) | |
| Notes | Dropouts are detailed in Table 2 | |
| Risk of bias | ||
| Bias | Authors' judgement | Support for judgement |
| Random sequence generation (selection bias) | Low risk | Web‐based randomisation system, block randomised |
| Allocation concealment (selection bias) | Low risk | Adequate (blind envelope system by investigator blind to case) |
| Blinding (performance bias and detection bias) | Low risk | Adequate |
| Incomplete outcome data (attrition bias) | Low risk | Dropouts accounted for ITT analysis employed |
| Selective reporting (reporting bias) | Low risk | All prespecified outcomes reported |
| Other bias | Unclear risk | Groups were comparable at baseline in relation to measures of aphasia and apraxia severity (Spoken Picture Naming, Spoken Reversible Sentence Comprehension, Auditory Lexical Decision, Auditory Minimal Pairs, non‐word repetition accuracy; Repetition of words of increasing syllable length; non‐speech oro motor tasks, mean phonation time in seconds, DDK rates), mean time postonset 22 months (range 5‐105) months. There was a sex imbalance in the 'speech‐first' condition, with more men than women. Power calculation a priori |
| Methods | RCT (cross‐over), UK | |
| Participants | 50 participants randomised Inclusion criteria: unilateral left‐hemisphere lesion, adults, at least 6 months poststroke, apraxia of speech. Group 1: 23 participants reported Details of participants are shown in Table 1 | |
| Interventions | 1. Early self administered computer programme therapy targeting whole word production and error reduction strategies + late visuo‐spatial sham computer programme ("Speech‐first/Sham‐second" group) Intervention: previously described in Varley 2016i. 2. Late self administered computer programme therapy targeting whole word production and error reduction strategies + early visuo‐spatial sham computer programme ("Speech‐second/Sham‐first" group) Intervention: previously described in Varley 2016i. After a 4‐week rest phase, the cross‐over period began. The speech‐first group received sham intervention, and the sham‐first group received the speech programme. Programmes were again available for approx 6 weeks. Laptops were then withdrawn. | |
| Outcomes | Primary outcomes: word repetition Secondary outcomes: Comprehensive Aphasia Test (subtest Comprehension of Spoken Sentences); PALPA (written word to picture matching subtest); Picture naming test Data collection: baseline (x 2); Post‐therapy 1; Post‐therapy 2; Follow‐up 8 weeks post‐therapy (Time point 3) Further reassessment was completed (outcome 2 (O2)). | |
| Notes | Dropouts are detailed in Table 2 | |
| Risk of bias | ||
| Bias | Authors' judgement | Support for judgement |
| Random sequence generation (selection bias) | Low risk | Web‐based randomisation system, block randomised |
| Allocation concealment (selection bias) | Low risk | Adequate (blind envelope system by investigator blind to case) |
| Blinding (performance bias and detection bias) | Low risk | Adequate |
| Incomplete outcome data (attrition bias) | Low risk | Dropouts accounted for ITT analysis employed |
| Selective reporting (reporting bias) | Low risk | All prespecified outcomes reported |
| Other bias | Unclear risk | Groups were comparable at baseline in relation to measures of aphasia and apraxia severity (Spoken Picture Naming, Spoken Reversible Sentence Comprehension, Auditory Lexical Decision, Auditory Minimal Pairs, non‐word repetition accuracy; repetition of words of increasing syllable length; non‐speech oro motor tasks, mean phonation time in seconds, DDK rates), mean time postonset 22 months (range 5‐105) months. 39 right (or predominantly right) handed, 3 mixed laterality, 2 predominantly left‐handed) Power calculation a priori |
| Methods | RCT, Australia | |
| Participants | Inclusion criteria: acute stroke admission within 5 d of stroke symptoms, CT or MRI confirmed diagnosis of stroke within 24 h after admission, aphasia as identified using the FAST, conscious, medically stable, can maintain a wakeful and alert state for at least 30 minutes, WABAQ < 93.8 Exclusion criteria: previous history of aphasia, mental illness, dementia, subarachnoid or subdural haemorrhage or neurosurgical intervention, non‐English speaking background, uncorrected hearing or vision impairment Group 1: 32 participants Group 2: 27 participants Details of participants are shown in Table 1 | |
| Interventions | 1. High‐intensity SLT Intervention: "High intensity SLT" with intervention chosen from Lexical‐sematic SLT (BOX, Visch‐Brink 2001); Mapping SLT; or Semantic Feature Analysis: "adhered to principles of neurorehab, incorporating repetitious trained activity with facilitation of error free learning", "Picture description task involved planning and execution of verbal communication in supported context". Materials: "resources provided to each treating site".Procedures: "as per published instructions". Picture description tasks. Provided by: speech and language therapist. Delivery: 1‐to‐1, face‐to‐face, inpatients in acute hospital. Regimen: 30‐80 min 5 d weekly up to 4 weeks (or 20 sessions). Total maximum dose = 26.5 h therapy (Min of 2.5 h). Tailoring: therapists were instructed to provide treatment from the above therapy types, according the participant's needs. Modification: therapists were instructed to provide treatment from the above therapy types, according the participant's needs. Adherence: therapist recorded and monitored. Patient compliance monitored. Some self selected to drop out. 2. Conventional SLT Intervention: "Usual care", with intervention chosen from Lexical‐sematic SLT (BOX, Visch‐Brink 2001); Mapping SLT; or Semantic Feature Analysis: "adhered to principles of neurorehab, incorporating repetitious trained activity with facilitation of error free learning" "Picture description task involved planning and execution of verbal communication in supported context". Materials: "resources provided to each treating site".Procedures: "as per published instructions". Picture description tasks. Provided by: speech and language therapist. Delivery: 1‐to‐1, face‐to‐face, inpatients in acute hospital. Regimen: up to 80 minutes, 1 session per week up to 4 weeks. Total maximum dose = 5.3 h therapy. Tailoring: therapists were instructed to provide treatment from the above therapy types, according the participant's needs. Modification: therapists were instructed to provide treatment from the above therapy types, according the participant's needs. Adherence: therapist recorded and monitored. Patient compliance monitored. Some self‐selected to drop out. | |
| Outcomes | Primary outcome measures: AQ and FCP at acute hospital discharge Data collection: 4 weeks then follow‐up at 6 months' poststroke | |
| Notes | 3 acute‐care hospitals Groups comparable at baseline in relation to age, sex, previous stroke, stroke type and stroke classification Dropouts: 8 (intensive SLT 7; conventional SLT 1); loss to follow‐up: 6 (intensive SLT 4; conventional SLT 2). Dropouts are detailed in Table 2 Statistical data included within the review meta‐analyses | |
| Risk of bias | ||
| Bias | Authors' judgement | Support for judgement |
| Random sequence generation (selection bias) | Low risk | Random number generator |
| Allocation concealment (selection bias) | Low risk | Sealed envelopes |
| Blinding (performance bias and detection bias) | Low risk | Assessors blinded (3 speech and language therapists and 3 final year SLT students) |
| Incomplete outcome data (attrition bias) | Low risk | ITT was employed |
| Selective reporting (reporting bias) | Low risk | All prespecified outcomes reported |
| Other bias | Low risk | Some indication that the 2 groups' severity of stroke and severity of aphasia differed at baseline (P = 0.057), but this was adjusted for in the analysis |
| Methods | RCT, Australia | |
| Participants | Inclusion criteria: acute stroke diagnosed by a neurologist or stroke physician and confirmed by computer tomography, MRI or both with 48 h of hospital admission, aphasia as diagnosed by a score of less than 13/20 on the shortened FAST, medical stability as measured by a GCS > 10 indicating a moderate level of alertness, sufficient wakefulness to participate in therapy demonstrated by the ability to maintain sufficient alertness to interact for at least 30 consecutive minutes, WABAQ < 93.7 Exclusion criteria: documented previous diagnosis of aphasia, head injury, neurodegenerative disease or mental illness, previous medical history of sub‐arachnoid and/ or sub‐dural haemorrhage or neurosurgical intervention, uncorrected hearing or vision impairment and non‐fluent English as a second language Group 1: 12 participants Group 2: 8 participants Details of participants are shown in Table 1 | |
| Interventions | 1. CIAT Intervention: CIAT. Based on principles of constraint induced movement therapy and neuroplasticity, provision of intensive therapy and massed practice. CIAT also provides pragmatically communicative therapeutic context thus communicative effectiveness is maximised and learned non‐use of expressive language minimised. Materials: target materials designed to shape individuals' language production with rules and reinforcement contingencies used to extend expressive output. The picture stimuli within each set of cards accommodated a verbal response ranging from single words to sentences. Increased target description, extended phrasal and clausal structures and politeness markers were encouraged to achieve increased utterance complexity and appropriateness according to each player's ability. The therapist provided language support as required to each player according to their individual needs. This was established at initial assessment and monitored and adjusted in response to the individual's performance within the treatment sessions. Full treatment protocol is available. Procedures: on CIAT as outlined by Pulvermuller 2001. Due to the early nature of the intervention, therapy was modified from the original 3 h per day to 1 h per day. Therapy was conducted by 1 speech pathologist with groups of 2‐4 people with aphasia playing CIAT. The therapy task of CIAT was a request and response language game in which participants aimed to collect the highest number of pairs of picture cards. Participants were constrained to interact through verbal production only. Sitting around a table, each participant had a visual barrier preventing them from seeing the cards of other group members, while allowing them to see and hear each other. Shielded by the screen, participants could use self cued gesture to facilitate their verbal production. Participants took turns to try to obtain a card from another player by verbally requesting a card. Each request prompted a verbal response such as confirmation, clarification or negation. Provided by: 8 speech and language therapists. Range of experience (1‐23 years), All had 3 h of therapy training prior to delivery of therapy in trial. Delivery: group, face‐to‐face, acute or rehab hospitals. Regimen: 45‐60 minutes, 5 d a week for 20 sessions over 5 weeks. Total dose = 15‐20 h therapy. Tailoring: increased target description, extended phrasal and clausal structures and politeness markers were encouraged to achieve increased utterance complexity and appropriateness according to each player's ability. The therapist provided language support as required to each player according to their individual needs. This was established at initial assessment and monitored and adjusted in response to the individual's performance within the treatment sessions. Modification: (as described in Tailoring). Adherence: not reported 2. Conventional SLT Intervention: conventional SLT. Usual care. Materials: Semantic Feature Therapy (Boyle 1995), Cued Naming Therapy (Nettleton 1991), Lexical Semantic (BOX) Therapy (Visch‐Brink 1997), Mapping Therapy (Schwartz 1994), and Phonological Feature Mapping (Raymer 1993). The therapies were administered following the respective published instructions. Participants received either 1 therapy or a combination of therapy types as appropriate. Procedures: participants in this therapy arm received an individualised programme tailored to meet their needs. Using the individual's initial assessment results to inform their decision making, the treating therapist selected the appropriate therapy from a range of approaches. Provided by: 8 speech and language therapists. Range of experience (1‐23 years), All had 3 h of therapy training prior to delivery of therapy in trial. Delivery: 1‐to‐1, face‐to‐face. Acute or rehab hospitals. Regimen: 45‐60 minutes, 5 d a week for 20 sessions over 5 weeks. Total dose = 15‐20 h therapy. Tailoring: yes, individualised programme tailored to meet individual patient needs. Initial assessment results informed decision making and selection of appropriate therapy. Modification: as therapy progressed based on individual monitoring of patient and progression through treatment hierarchies accordingly. Adherence: not reported | |
| Outcomes | Primary outcomes: WABAQ Data collection: baseline, post‐treatment, 12 and 26 weeks poststroke | |
| Notes | Statistical data included within the review meta‐analyses | |
| Risk of bias | ||
| Bias | Authors' judgement | Support for judgement |
| Random sequence generation (selection bias) | Low risk | Computer‐generated, blocked randomisation |
| Allocation concealment (selection bias) | Low risk | Sealed opaque envelopes controlled by admin staff external to the trial |
| Blinding (performance bias and detection bias) | Low risk | Trained assessors not involved in provision of therapy and blinded to group allocation |
| Incomplete outcome data (attrition bias) | Low risk | No dropouts reported ITT not employed |
| Selective reporting (reporting bias) | Low risk | All prespecified outcomes reported |
| Other bias | Unclear risk | Groups were comparable at baseline for age, sex, stroke type, hemisphere, mRS, admission to assessment (d) and aphasia severity (AQ) (but significantly (P = 0.037 more PACS in CIAT; More TACS in usual care by Oxfordshire stroke scale) |
| Methods | Parallel group, multicentre RCT, USA (5 sites) | |
| Participants | Inclusion criteria: male veteran, aged 40‐80 years, premorbidly literate in English, first thromboembolic left CVA, no co‐existing major medical complications, hearing no worse than 40 dB in poorer ear, corrected vision no worse than 20/100 in poorer eye, adequate sensory/motor ability in 1 hand to write/gesture, 4 weeks postonset, language severity 15th to 75th overall percentile on PICA Details of participants are shown in Table 1 | |
| Interventions | 1. Group SLT Intervention: "Group SLT". Direct SLT contact designed to stimulate language through social interaction, no direct manipulation of deficits, encouraged group discussion on current events and topics; no direct attempts to improve or correct incorrect responses (4 h weekly) and group recreational activities (4 h weekly). Materials: not reported. Procedures: groups 3‐7 participants. 4 h in group with therapist plus 4 h of group activities weekly. Followed treatment protocol. Provided by: speech and language therapist. Delivery: group, face‐to‐face (4 h with therapist and group; 4 h with group); medical centre. Regimen: 4 h in group with therapist plus 4 h of group activities weekly for up to 44 weeks.Total dose = 352 h. Tailoring: some suggestion of individualised prompts to participate if required. Modification: not reported. Adherence: treatment tasks and patient performance recorded in treatment logs. Dropouts were noted. 2. Conventional SLT Intervention: "Conventional SLT". Direct, stimulus‐response manipulation of speech and language deficits plus 4 h of machine‐assisted treatment and SLT drill. Materials: not reported.Procedures: 4 h with therapist plus 4 h machine‐assisted treatment and SLT drills weekly. Traditional, individual, stimulus response type treatment of speech and language deficits in all communicative modalities. Provided by: research SLT employed to deliver all treatments and "machine‐assisted treatment" (not reported). Delivery: 1‐to‐1, face‐to‐face and machine assisted; medical centre. Regimen: 4 h with therapist plus 4 h machine‐assisted treatment and SLT drills weekly for up to 44 weeks.Total dose = 352 h therapy. Tailoring: "individualised". Modification: yes. Adherence: treatment tasks and patient performance recorded in treatment logs. Dropouts were noted. | |
| Outcomes | Primary outcomes: PICA, Token Test, word fluency measure, Conversational Rating, informants' ratings of functional language use | |
| Notes | Dropouts: 33 participants (group SLT 16; conventional SLT 17). Dropouts are detailed in Table 2 Some statistical data included within the review meta‐analyses | |
| Risk of bias | ||
| Bias | Authors' judgement | Support for judgement |
| Random sequence generation (selection bias) | Unclear risk | Not reported |
| Allocation concealment (selection bias) | Unclear risk | Not reported |
| Blinding (performance bias and detection bias) | Low risk | Outcome assessors blinded |
| Incomplete outcome data (attrition bias) | High risk | ITT analysis not employed |
| Selective reporting (reporting bias) | Unclear risk | Not all prespecified outcomes reported in the paper |
| Other bias | Unclear risk | Groups comparable at baseline |
| Methods | Cross‐over group, multicentre RCT (only data collected prior to cross‐over treatment included in this review), USA (5 sites) | |
| Participants | Inclusion criteria: male veteran, maximum 75 years old, 2‐24 weeks postonset, single left thromboembolic CVA, no previous or co‐existing neurological, serious medical or psychological disorder, no worse than 20/100 corrected vision in better eye, hearing no worse than 40 dB unaided in better ear, sensory/motor ability in 1 upper limb to gesture or write, premorbidly literate in English, maximum 2 weeks between onset and trial entry, language severity 10th to 80th PICA overall, non‐institutionalised living environment, outside assistant volunteer available Details of participants are shown in Table 1 | |
| Interventions | 1. Conventional SLT Intervention: clinic treatment. Rationale not reported. Materials: details not reported. Procedures: "stimulus‐response treatment, designed to improve language deficits in auditory comprehension, reading, oral‐expressive language and writing". Techniques ranged from traditional facilitation methods (picture description, verbal repetition, sentence completion and confrontation naming) to specific programmes such as Melodic Intonation Therapy and PACE Provided by: speech and language therapist. Delivery: 1‐to‐1, face‐to‐face, clinic. Regimen: 8‐10 h weekly for 12 weeks. Total dose = up to 120 h therapy. Tailoring: individualised. Modification: individualised. Adherence: yes, but method not reported. 2. No SLT Intervention: deferred SLT . Materials: none. Procedures: SLT after cross‐over at 12 weeks Provided by: none Delivery: none. Regimen: not applicable. Tailoring: not applicable. Modification: not applicable. Adherence: yes, but method not reported. | |
| Outcomes | Primary outcomes: PICA, CADL, RCBA, Token Test | |
| Notes | Estimated sample size Statistical data included within the review meta‐analyses | |
| Risk of bias | ||
| Bias | Authors' judgement | Support for judgement |
| Random sequence generation (selection bias) | Unclear risk | Not reported |
| Allocation concealment (selection bias) | Unclear risk | Not reported |
| Blinding (performance bias and detection bias) | Low risk | Outcome assessors blinded |
| Incomplete outcome data (attrition bias) | High risk | ITT analysis not employed |
| Selective reporting (reporting bias) | Low risk | All prespecified outcomes reported |
| Other bias | Low risk | Groups comparable at baseline |
| Methods | Cross‐over group, multicentre RCT (only data collected prior to cross‐over treatment included in this review), USA (5 sites) | |
| Participants | Inclusion criteria: male veteran, maximum 75 years old, 2‐24 weeks postonset, single left thromboembolic CVA, no previous neurological involvement/co‐existing serious medical or psychological disorder, no worse than 20/100 corrected vision in better eye, hearing no worse than 40 dB unaided in better ear, sensory/motor ability in 1 upper limb to gesture/write, premorbidly literate in English, maximum 2 weeks between onset and trial entry, language severity 10th to 80th PICA overall, non‐institutionalised living environment, outside assistant volunteer available Details of participants are shown in Table 1 | |
| Interventions | 1. Volunteer‐facilitated SLT Intervention: "Home treatment by trained volunteer". Rationale not reported. Materials: general treatment principles specified in treatment protocol but specific techniques designed to meet each patient's deficits. Techniques ranged from traditional facilitation methods (picture description, verbal repetition, sentence completion and confrontation naming) to specific programmes such as Melodic Intonation Therapy and PACE Procedures: planned and directed by SLT, treatment programme "usually stimulus‐response treatment, designed to improve language deficits in auditory comprehension, reading, oral‐expressive language and writing". Provided by: trained volunteer (family member/friend) ‐ no experience in health care prior to study. Received 6‐10 h of training including information about aphasia, observation of treatment on videotapes and demonstration and practice with treatment techniques volunteers would use with patient. Delivery: 1‐to‐1, face‐to‐face, home‐based. Regimen: 8 ‐10 h weekly for 12 weeks. Total dose = up to 120 h therapy. Tailoring: individualised.Modification: individualised. Adherence: yes, weekly communication with volunteers to review and answer questions. modify treatment tasks, via weekly face‐to‐face or telephone contact. Every 2 weeks patient and volunteer were videotaped in a half hour session and reviewed and adjustments were suggested when necessary. 2. No SLT Intervention: deferred SLT . Materials: none. Procedures: SLT after cross‐over at 12 weeks Provided by: none Delivery: none. Regimen: not applicable. Tailoring: not applicable. Modification: not applicable. Adherence: yes, but method not reported. | |
| Outcomes | Primary outcomes: PICA, CADL, RCBA, Token Test | |
| Notes | USA over 5 sites Statistical data included within the review meta‐analyses | |
| Risk of bias | ||
| Bias | Authors' judgement | Support for judgement |
| Random sequence generation (selection bias) | Unclear risk | Not reported |
| Allocation concealment (selection bias) | Unclear risk | Not reported |
| Blinding (performance bias and detection bias) | Low risk | Outcome assessors blinded |
| Incomplete outcome data (attrition bias) | High risk | ITT analysis not employed |
| Selective reporting (reporting bias) | Low risk | All prespecified outcomes reported |
| Other bias | Low risk | Groups comparable at baseline |
| Methods | Cross‐over group, multicentre RCT (only data collected prior to cross‐over treatment included in this review), USA (5 sites) | |
| Participants | Inclusion criteria: male veteran, maximum 75 years old, 2‐24 weeks after single left thromboembolic stroke, no previous neurological involvement/co‐existing serious medical or psychological disorder, at least 20/100 corrected vision, hearing at least 40 dB unaided, sensory/motor ability in 1 upper limb to gesture or write, premorbidly literate in English, maximum 2 weeks between onset and trial entry, language severity 10th to 80th percentile on PICA, non‐institutionalised living, volunteer available Details of participants are shown in Table 1 | |
| Interventions | 1. Volunteer‐facilitated SLT Intervention: "Home treatment by trained volunteer". Rationale not reported. Materials: general treatment principles specified in treatment protocol but specific techniques designed to meet each patient's deficits. Techniques ranged from traditional facilitation methods (picture description, verbal repetition, sentence completion and confrontation naming) to specific programmes such as Melodic Intonation Therapy and PACE Procedures: planned and directed by SLT, treatment programme "usually stimulus‐response treatment, designed to improve language deficits in auditory comprehension, reading, oral‐expressive language and writing". Provided by: trained volunteer (family member/friend) ‐ no experience in health care prior to study. Received 6‐10 h of training including information about aphasia, observation of treatment on videotapes and demonstration and practice with treatment techniques volunteers would use with patient. Delivery: 1‐to‐1, face‐to‐face, home‐based. Regimen: 8‐10 h weekly for 12 weeks. Total dose = up to 120 h therapy. Tailoring: individualised.Modification: individualised. Adherence: yes, Weekly communication with volunteers to review and answer questions. modify treatment tasks, via weekly face‐to‐face or telephone contact. Every 2 weeks patient and volunteer were videotaped in a half hour session and reviewed and adjustments were suggested when necessary. 1. Conventional SLT Intervention: clinic treatment. Rationale not reported. Materials: details not reported. Procedures: "stimulus‐response treatment, designed to improve language deficits in auditory comprehension, reading, oral‐expressive language and writing". Techniques ranged from traditional facilitation methods (picture description, verbal repetition, sentence completion and confrontation naming) to specific programmes such as Melodic Intonation Therapy and PACE) Provided by: speech and language therapist. Delivery: 1‐to‐1, face‐to‐face, clinic. Regimen: 8‐10 h weekly for 12 weeks. Total dose = up to 120 h therapy. Tailoring: individualised. Modification: individualised. Adherence: yes, but method not reported. 20 participants (conventional SLT 9; no SLT 11). | |
| Outcomes | Primary outcomes: PICA, CADL, RCBA, Token Test | |
| Notes | Estimated sample size Statistical data included within the review meta‐analyses | |
| Risk of bias | ||
| Bias | Authors' judgement | Support for judgement |
| Random sequence generation (selection bias) | Unclear risk | Not reported |
| Allocation concealment (selection bias) | Unclear risk | Not reported |
| Blinding (performance bias and detection bias) | Low risk | Outcome assessors blinded |
| Incomplete outcome data (attrition bias) | High risk | ITT analysis not employed |
| Selective reporting (reporting bias) | Low risk | All prespecified outcomes reported |
| Other bias | Low risk | Groups comparable at baseline |
| Methods | Multicentre RCT, Netherlands | |
| Participants | Inclusion criteria: adult, isolated first stroke, imaging confirmed left hemisphere stroke, moderate fluent aphasia with phonological and semantic deficits (based on (lang) Stanine norms of Token test; (semantic) AAT comprehension; Verbal Semantic Association Test; PALPA Synonym Judgement and Semantic Word Association of low imageability words, (phonological) AAT Repetition, PALPA Nonword Repetition and Auditory Lexical Decision), also had to score above the 75th percentile on Raven's Coloured Progressive Matrices (Raven 1976) (visuoperceptual problem solving). by means of a standard handedness inventory (Oldfield 1971) Details of participants are shown in Table 1 | |
| Interventions | 1. Constraint Induced Aphasia Therapy Intervention: CIAT. Intensive constraint‐based intervention thought to be effective. Materials: CIAT treatment is a communication‐based group interaction by means of communicative card games. The picture cards contain objects of high as well as low frequent words, black‐and‐white line drawings as well as colored pictures, pictures of objects as well as action cards, and pictures with minimal pairs (e.g. sock and rock) based on Maher 2006, Meinzer 2005b, Meinzer 2007, Pulvermuller 2001. Patients were allowed to produce gestures in order to facilitate verbal output, but their gestures were hidden from the other participants by a 40 cm high screen between the patient and the other participants. Procedures: dual card game was used (e.g. Maher 2006). Participants dealt cards from a set of 32‐42 coloured cards (i.e., 16‐21 pairs of identical cards) per 45 min treatments. They take turns either requesting an identical card from the other participant (4 to 6 cards per participant) or responding to that request. Constraints were along 3 dimensions: difficulty of the material; the rules of the game, as indicated by verbal instruction and shaping; and reinforcement contingencies (Pulvermuller 2001). Provided by: 7 trained speech language therapy students (3rd year professional bachelor level). Students under supervision of 6 experienced and professionally trained speech and language therapists. Students were trained according to the training protocol of lay people designed by Meinzer 2007. The speech and language therapists had been given detailed instructions by means of a 2 h presentation in which the study was presented. The basic principles of BOX and CIAT were introduced, and the materials, procedures, and approaches of both types of intervention were carefully explained. In addition, students were given a 1 h practical training session. Instruction sessions contained illustrative video materials. The students and therapists were given a detailed manual with explicit guidelines about CIAT and BOX. Delivery: group, face‐to‐face, 1 of 4 hospital settings in the Netherlands. Regimen: 2‐3 h sessions per day on 9 or 10 consecutive working days (total mean duration ± SD = 1195 ± 59, pauses not included). Each session was interrupted by 2 breaks of 10 to 15 min. Tailoring: daily records were used for a daily evaluation and critical assessment of each session in order to adjust individual or group task difficulty for the next session. Modification: yes, adjusted to individual or group task difficulty for the next session. Adherence: students and therapists kept a detailed daily record of each intervention, specifying the presence of participants and therapists, the duration of the training in minutes, and the training materials used. Actual adherence or fidelity to treatment not reported. 2. BOX Intervention: Semantic SLT. A Dutch drill‐based lexical‐semantic treatment therapy programme (Visch‐Brink 2001). Materials: focuses on the interpretation of written words, sentences, and texts (also with an auditory presentation by the speech and language therapist if required). Procedures: BOX contains a variety of semantic decision tasks aimed at enhancing semantic processing. 8 different types of exercises within each task, and the patient is required to deny or confirm the semantic relationship between (written and auditorily presented) content words, either presented separately or within the context of a sentence or text. Word choice, number of distractors, semantic relatedness, and ambiguity were taken into account in creating the different levels of difficulty (Visch‐Brink 1997). The patients in the BOX group worked alternatively by themselves on worksheets and with the therapist according to a therapy schedule (see Table 2), which allowed 1 therapist to supervise 2 patients. For example, on the first day, patient 1 started with 30 min of therapy (Therapy Schedule BOX 1) whereas patient 2 began with a 30 min individual working session (Therapy Schedule BOX 2). The next day, participants swapped therapy schedules. Patients were able to adjust their personal level of difficulty. | |
| Outcomes | Primary outcomes: Amsterdam Nijmegen Everyday Language Test Secondary outcomes: AAT, BNT, PALPA, SAT, ANELT CETI. Particpants also completed a written nonstandardised questionnaire (6 questions on a 7‐point Likert rating scale) regarding their satisfaction. Questions were about the satisfaction of participation, whether or not they would participate a second time, the feasibility and the pleasantness of the intensive treatment, and the preference of an intensive treatment above a nonintensive treatment. Data collection: pretreatment and 1 week after treatment | |
| Notes | Statistical data included within the review meta‐analyses | |
| Risk of bias | ||
| Bias | Authors' judgement | Support for judgement |
| Random sequence generation (selection bias) | Low risk | Computer‐generated |
| Allocation concealment (selection bias) | Low risk | Sequentially numbered opaque, sealed envelopes until randomisation |
| Blinding (performance bias and detection bias) | Unclear risk | Not reported |
| Incomplete outcome data (attrition bias) | Low risk | No dropouts |
| Selective reporting (reporting bias) | Low risk | All prespecified outcomes reported |
| Other bias | Low risk | Groups comparable at baseline (for age, aphasia duration, eduational level) |
| Methods | RCT, UK | |
| Participants | Inclusion criteria: at least 6 months postleft hemisphere stroke, word‐finding difficulties from aphasia (20%‐70% on spoken picture naming subtest of CATs), retained demonstrated picture recognition and memory skills (scoring at least 70% on the CAT semantic and recognition memory subtests); they showed no signs of visual neglect (scoring within normal limits on the CAT line bisection test); no hearing loss > 40dB (established via pure tone audiometry); no secondary neurological diagnosis such as dementia; not receiving speech and language therapy elsewhere. Participants were also required to nominate a family member, friend or volunteer who could act as their partner in a conversation assessment and, if relevant, support their use of technology. Partners had no neurological impairment and no significant hearing loss. Details of participants are shown in Table 1 | |
| Interventions | 1. Remote telerehab Intervention: telerehab SLT. Telerehabilitation enables patients to "access remote rehabilitation services in their own homes, typically by using internet video conferencing technologies. There are efficiency savings for both patients and service providers, mainly because the need to travel is eliminated. Such savings are particularly relevant in the context of stroke rehabilitation, where there are high levels of unmet need, and where demands on services are likely to increase". Materials: standard protocol, manualised therapy. Participants had workshop comprising pictures of their target words. Procedures: 50 words each targeted at least once per session. The therapist worked with a corresponding book, which also delineated the tasks and cues that were to be used with each word. The therapy tasks were as follows. semantic verification: the therapist pointed to the target picture and asked 2 yes/no questions about the properties of the item (e.g. for lemon: "Can you squeeze it?"; "Is it sweet?"); picture naming: the therapist pointed to the picture and asked the participant to name it. If the participant was successful, they were asked to repeat the word 3 times. If the participant was unable to name the item the therapist offered the following cues (in the given order): semantic cue (e.g. for lemon: "We eat it with sugar on pancakes"), sentence or phrase completion cue (e.g. "sour as a …" lemon), first phoneme (sound) cue ("it begins with /l/"), first syllable cue ("It begins with /lƐ/"), whole word for repetition. Once the word was produced, the participant was asked to repeat it 3 times. If they were unable to say it, the therapist repeated the word 3 times. Provided by: speech and language therapist. Therapist training not reported. Participants and partners had at least 1 technology training session and a simple written and pictorial instructions. Delivery: FaceTime via iPad (or in 1 case via Skype and PC) and use of workbook; 1‐to‐1 (with partner support) delivered at home. Regimen: 1 h sessions of therapy delivered twice a week over 4 weeks.Total dose = 8 h. Tailoring: yes. Degree of difficulty and self administered practice. Modification: yes. Degree of difficulty and self administered practice. Adherence: monitored attendance and intervention fidelity. Of those randomised no sessions missed 2. Conventional SLT Intervention: face‐to‐face SLT. Conventional naming therapy. Materials: standard protocol, manualised therapy. Participants had workshop comprising pictures of their target words. Procedures: 50 words each targeted at least once per session. The therapist worked with a corresponding book, which also delineated the tasks and cues that were to be used with each word. The therapy tasks were as follows. Semantic verification: the therapist pointed to the target picture and asked 2 yes/no questions about the properties of the item (e.g. for lemon: "Can you squeeze it?"; "Is it sweet?"); picture naming: the therapist pointed to the picture and asked the participant to name it. If the participant was successful, they were asked to repeat the word 3 times. If the participant was unable to name the item the therapist offered the following cues (in the given order): semantic cue (e.g. for lemon: "We eat it with sugar on pancakes"), sentence or phrase completion cue (e.g. "sour as a …" lemon), first phoneme (sound) cue ("it begins with /l/"), first syllable cue ("It begins with /lƐ/"), whole word for repetition. Once the word was produced, the participant was asked to repeat it 3 times. If they were unable to say it, the therapist repeated the word 3 times. Provided by: speech and language therapist. Therapist training not reported. Delivery: face‐to‐face and home use of workbook 1‐to‐1 (with partner support), at clinic and home practice. Regimen: 1 h sessions of therapy delivered twice a week over 4 weeks.Total dose = 8 h. Tailoring: yes. Degree of difficulty and self administered practice. Modification: yes. Degree of difficulty and self administered practice. Adherence: monitored attendance and intervention fidelity. Monitored via video and a human computer interaction, researcher not participating in therapy intervention | |
| Outcomes | Primary outcomes: feasibility issues, Spoken picture naming (Best 2013) with selection of 100 (2 matched sets of 50) words (treated/untreated for the SLT group) Secondary outcomes: free conversation with partner. Discourse analysis (substantive turns, number of content words per turn, number of nouns per turn). Data collection: baseline, post‐treatment (8 weeks) and 6 week follow‐up (14 weeks) | |
| Notes | UK Statistical data included within the review meta‐analyses | |
| Risk of bias | ||
| Bias | Authors' judgement | Support for judgement |
| Random sequence generation (selection bias) | Low risk | Computer‐generated, blocked stratification |
| Allocation concealment (selection bias) | Low risk | Adequate |
| Blinding (performance bias and detection bias) | High risk | Member of research team ‐ so partially (but 70% of data secondary coded by additional researcher blinded to allocation and time point). Transcription and scoring was by blinded researcher |
| Incomplete outcome data (attrition bias) | Low risk | Dropouts accounted for |
| Selective reporting (reporting bias) | Low risk | All prespecified outcomes reported |
| Other bias | Low risk | Groups were comparable at baseline (age, time poststroke and naming and picture recognition and memory screening scores) |
| Methods | RCT, UK | |
| Participants | Inclusion criteria: at least 6 months postleft hemisphere stroke, word‐finding difficulties from aphasia (20‐70% on spoken picture naming subtest of CATs), retained demonstrated picture recognition and memory skills (scoring at least 70% on the CAT semantic and recognition memory subtests); they showed no signs of visual neglect (scoring within normal limits on the CAT line bisection test); no hearing loss > 40dB (established via pure tone audiometry); no secondary neurological diagnosis such as dementia; not receiving speech and language therapy elsewhere. Participants were also required to nominate a family member, friend or volunteer who could act as their partner in a conversation assessment and, if relevant, support their use of technology. Partners had no neurological impairment and no significant hearing loss. Details of participants are shown in Table 1 | |
| Interventions | 1. Teleconf supported SLT Intervention: telerehab SLT. Telerehabilitation enables patients to "access remote rehabilitation services in their own homes, typically by using internet video conferencing technologies. There are efficiency savings for both patients and service providers, mainly because the need to travel is eliminated. Such savings are particularly relevant in the context of stroke rehabilitation, where there are high levels of unmet need, and where demands on services are likely to increase". Materials: standard protocol, manualised therapy. Participants had workshop comprising pictures of their target words. Procedures: 50 words each targeted at least once per session. The therapist worked with a corresponding book, which also delineated the tasks and cues that were to be used with each word. The therapy tasks were as follows: semantic verification: the therapist pointed to the target picture and asked 2 yes/no questions about the properties of the item (e.g. for lemon: "Can you squeeze it?"; "Is it sweet?"); picture naming: the therapist pointed to the picture and asked the participant to name it. If the participant was successful, they were asked to repeat the word 3 times. If the participant was unable to name the item the therapist offered the following cues (in the given order): semantic cue (e.g. for lemon: "We eat it with sugar on pancakes"), sentence or phrase completion cue (e.g. "sour as a …" lemon), first phoneme (sound) cue ("it begins with /l/"), first syllable cue ("It begins with /lƐ/"), whole word for repetition. Once the word was produced, the participant was asked to repeat it 3 times. If they were unable to say it, the therapist repeated the word 3 times. Provided by: speech and language therapist. Therapist training not reported. Participants and partners had at least 1 technology training session and a simple written and pictorial instructions. Delivery: FaceTime via iPad (or in 1 case via Skype and PC) and use of workbook; 1‐to‐1 (with partner support) delivered at home. Regimen: 1 h sessions of therapy delivered twice a week over 4 weeks.Total dose = 8 h. Tailoring: yes. Degree of difficulty and self administered practice. Modification: yes. Degree of difficulty and self administered practice. Adherence: monitored attendance and intervention fidelity. Of those randomised, no sessions missed 2. Teleconference‐supported conversation Intervention: social support. Attention control. Materials: none. Procedures: conversational support techniques from trained SLT students. Provided by: speech and language therapy students. Received 1/2 day training session in supported conversation techniques (conversation initiation, adaptation of communication; resolve breakdowns, use of iPad and FaceTime technology), also given handbook with further advice. Delivery: facetime via iPad, 1‐to‐1, in patients home from university. Regimen 8 remote conversations, scheduled twice a week (8 h in total). Tailoring: yes, to patient conversation. Modification: yes, individualised conversational support. Adherence: not reported | |
| Outcomes | Primary outcomes: feasibility issues, spoken picture naming (Best 2013) with selection of 100 (2 matched sets of 50) words (treated/untreated for the SLT group) Secondary outcomes: free conversation with partner. Discourse analysis (substantive turns, number of content words per turn, number of nouns per turn). Data collection: baseline, post‐treatment (8 weeks) and 6 week follow‐up (14 weeks) | |
| Notes | Statistical data included within the review meta‐analyses | |
| Risk of bias | ||
| Bias | Authors' judgement | Support for judgement |
| Random sequence generation (selection bias) | Low risk | Computer‐generated, blocked stratification |
| Allocation concealment (selection bias) | Low risk | Adequate |
| Blinding (performance bias and detection bias) | High risk | Member of research team ‐ so partially (but 70% of data secondary coded by additional researcher blinded to allocation and time point). Transcription and scoring was by blinded researcher |
| Incomplete outcome data (attrition bias) | Low risk | Dropouts accounted for |
| Selective reporting (reporting bias) | Low risk | All prespecified outcomes reported |
| Other bias | Low risk | Groups were comparable at baseline (age, time poststroke and naming and picture recognition and memory screening scores) |
| Methods | RCT, UK | |
| Participants | Inclusion criteria: at least 6 months postleft hemisphere stroke, word finding difficulties from aphasia (20‐70% on spoken picture naming subtest of CATs), retained demonstrated picture recognition and memory skills (scoring at least 70% on the CAT semantic and recognition memory subtests); they showed no signs of visual neglect (scoring within normal limits on the CAT line bisection test); no hearing loss >40dB (established via pure tone audiometry); no secondary neurological diagnosis such as dementia; not receiving speech and language therapy elsewhere. Participants were also required to nominate a family member, friend or volunteer who could act as their partner in a conversation assessment and, if relevant, support their use of technology. Partners had no neurological impairment and no significant hearing loss. Details of participants are shown in Table 1 | |
| Interventions | 1. Conventional SLT Intervention: face‐to‐face SLT. Conventional naming therapy. Materials: standard protocol, manualised therapy. Participants had workshop comprising pictures of their target words. Procedures: 50 words each targeted at least once per session. The therapist worked with a corresponding book, which also delineated the tasks and cues that were to be used with each word. The therapy tasks were as follows: semantic verification: the therapist pointed to the target picture and asked 2 yes/no questions about the properties of the item (e.g. for lemon: "Can you squeeze it?"; "Is it sweet?"); picture naming: the therapist pointed to the picture and asked the participant to name it. If the participant was successful, they were asked to repeat the word 3 times. If the participant was unable to name the item the therapist offered the following cues (in the given order): semantic cue (e.g. for lemon: "We eat it with sugar on pancakes"), sentence or phrase completion cue (e.g. "sour as a …" lemon), first phoneme (sound) cue ("it begins with /l/"), first syllable cue ("It begins with /lƐ/"), whole word for repetition. Once the word was produced, the participant was asked to repeat it 3 times. If they were unable to say it, the therapist repeated the word 3 times. Provided by: speech and language therapist. Therapist training not reported. Delivery: face‐to‐face and home use of workbook 1‐to‐1 (with partner support), at clinic and home practice. Regimen: 1 h sessions of therapy delivered twice a week over 4 weeks.Total dose = 8 h. Tailoring: yes, degree of difficulty and self administered practice. Modification: yes, degree of difficulty and self administered practice. Adherence: monitored attendance and intervention fidelity. Monitored via video and a human computer interaction, researcher not participating in therapy intervention 2. Teleconf supported conversation Intervention: social support. Attention control. Materials: none. Procedures: vconversational support techniques from trained SLT students. Provided by: speech and language therapy students. Received 1/2 day training session in supported conversation techniques (conversation initiation, adaptation of communication; resolve breakdowns, use of iPad and Facetime technology), also given handbook with further advice. Delivery: facetime via iPad, 1‐to‐1, in patients home from University. Regimen 8 remote conversations, scheduled twice a week (8 h in total). Tailoring: yes, to patient conversation. Modification: yes, individualised conversational support. Adherence: not reported | |
| Outcomes | Primary outcomes: feasibility issues, spoken picture naming (Best 2013), with selection of 100 (2 matched sets of 50) words (treated/untreated for the SLT group) Secondary outcomes: free conversation with partner. Discourse analysis (substantive turns, number of content words per turn, number of nouns per turn). Data collection: baseline, post‐treatment (8 weeks) and 6‐week follow‐up (14 weeks) | |
| Notes | Statistical data included within the review meta‐analyses | |
| Risk of bias | ||
| Bias | Authors' judgement | Support for judgement |
| Random sequence generation (selection bias) | Low risk | Computer‐generated, blocked stratification |
| Allocation concealment (selection bias) | Low risk | Adequate |
| Blinding (performance bias and detection bias) | High risk | Member of research team ‐ so partially (but 70% of data secondary coded by additional researcher blinded to allocation and time point). Transcription and scoring was by blinded researcher |
| Incomplete outcome data (attrition bias) | Low risk | Dropouts accounted for |
| Selective reporting (reporting bias) | Low risk | All prespecified outcomes reported |
| Other bias | Low risk | Groups were comparable at baseline (age, time poststroke and naming and picture recognition and memory screening scores) |
| Methods | Parallel group RCT, People's Republic of China | |
| Participants | Inclusion criteria: none described Details of participants are shown in Table 1 | |
| Interventions | 1. Conventional SLT Intervention: "2 step method for aphasia". Rationale not reported. Materials: not reported. Procedures: visual stimulus, gesture and word pattern, following pronunciation, reading single word and entertainments. Provided by: step 1: doctor or nurse; step 2: family members trained by doctors and nurses. Delivery: face‐to‐face; 1‐to‐1; step 1: inpatient; step 2: at home. Regimen (frequency (sessions weekly) x duration): frequency of therapy delivered over 6 months not reported. Total dose of therapy delivered over the intervention ‐ not reported. Tailoring: not reported. Modification: not reported. Adherence: not reported. 2. No SLT Intervention: "No SLT" | |
| Outcomes | None available | |
| Notes | Translated by Chinese Cochrane Centre | |
| Risk of bias | ||
| Bias | Authors' judgement | Support for judgement |
| Random sequence generation (selection bias) | Unclear risk | Not reported |
| Allocation concealment (selection bias) | Unclear risk | Not reported |
| Blinding (performance bias and detection bias) | Low risk | Outcome assessor blinded |
| Incomplete outcome data (attrition bias) | Low risk | All randomised participants included in analyses |
| Selective reporting (reporting bias) | High risk | Lack of any statistical data analysis reported for outcomes |
| Other bias | Unclear risk | Not reported whether groups were comparable at baseline |
| Methods | RCT, People's Republic of China | |
| Participants | Inclusion criteria: Broca's aphasia 1‐3 months poststroke Details of participants are shown in Table 1 | |
| Interventions | 1. Conventional SLT Intervention: SLT. Usual therapy. Materials: not reported. Procedures: not reported. Provided by: not reported. Delivery: mode and location of delivery not reported. Regimen: 30mins/day, once a day, 5 d/week. Tailoring: not reported. Modification: not reported. Adherence: not reported. 2. No SLT Intervention: no SLT. Materials: none. Procedures: none Delivery: none. Regimen: none. Tailoring: none. Modification: none. Adherence: none. | |
| Outcomes | Primary outcomes: Chinese Rehabilitation Research Centre Aphasia Examination (CRRCAE) Secondary outcomes: WAB, BDAE Data collection: "post‐treatment" (not specified) | |
| Notes | Abstract only Statistical data not included within the review | |
| Risk of bias | ||
| Bias | Authors' judgement | Support for judgement |
| Random sequence generation (selection bias) | Unclear risk | Not reported |
| Allocation concealment (selection bias) | Unclear risk | Not reported |
| Blinding (performance bias and detection bias) | Unclear risk | Not reported |
| Incomplete outcome data (attrition bias) | Low risk | No dropouts |
| Selective reporting (reporting bias) | High risk | Lack of any statistical data analysis reported for outcomes |
| Other bias | Unclear risk | Not reported if groups were comparable at baseline |
| Methods | RCT (matched and then randomised), People's Republic of China | |
| Participants | Inclusion criteria: "clinically diagnosed with stroke suffering spoken language impairment" Details of participants are shown in Table 1 | |
| Interventions | 1. Language training Intervention: SLT. Role in rehab. Materials: not reported. Procedures: training of attention, memory, words, hearing and cognition, instructions, sentence comprehension, use of communicating cards, gesture, pronunciation, sentence expression. Provided by: nurses. Some suggestion that family also involved in delivering the therapy. Training not reported. Delivery: face‐to‐face; unclear if therapy was 1‐to‐1 or group, not reported if therapy was delivered at home. Regimen: 6 times a week, 1 h each time delivered over 12 months. Total dose of therapy delivered over the intervention = 312 h. Tailoring: not reported. Modification: not reported. Adherence: not reported. 2. No SLT Intervention: no SLT. Materials: none. Procedures: none. Delivery: none. Regimen: none. Tailoring: none. Modification: none. Adherence: none. | |
| Outcomes | Primary outcomes: Chinese Language Impairment Examination Secondary outcomes: none described Data collection: baseline, 6 months (mid intervention) and 12 months | |
| Notes | ― | |
| Risk of bias | ||
| Bias | Authors' judgement | Support for judgement |
| Random sequence generation (selection bias) | Unclear risk | No details available ("randomised") |
| Allocation concealment (selection bias) | Unclear risk | Not reported |
| Blinding (performance bias and detection bias) | Low risk | Yes. ("assessment was carried out by a fixed person all Ihrough the study, who did not amend the language function training and therefore did not know the group the patient belonged to") |
| Incomplete outcome data (attrition bias) | Low risk | No dropouts reported |
| Selective reporting (reporting bias) | High risk | Lack of any statistical data analysis reported for outcomes |
| Other bias | Low risk | Groups were comparable at baseline (age, education level, type of spoken language impairment, severity of spoken language impairment, degree of spoken language comprehension) |
| Methods | Parallel group RCT, People's Republic of China | |
| Participants | Inclusion criteria: poststroke aphasia Details of participants are shown in Table 1 | |
| Interventions | 1. Group SLT Intervention: "Collective Language Strenghtening Training". Rationale not reported. Materials: not reported. Procedures: doctor or nurse talked to all patients, and they were encouraged to communicate with each other in small groups (10 participants). Provided by: doctor or nurse (training not reported). Delivery: face‐to‐face; group; location not reported. Regimen: therapy delivered daily for 28 d. Total dose of therapy delivered over the intervention not reported. Tailoring: not reported. Modification: not reported. Adherence: not reported. 2. No SLT Intervention: no therapy. Materials: none Procedures: none. Provided by: none. Delivery: none. Regimen: none. Tailoring: none. Modification: none. Adherence: not reported. | |
| Outcomes | Primary outcome: CRRCAE | |
| Notes | Translated by Chinese Cochrane Centre Statistical data included within the review meta‐analyses | |
| Risk of bias | ||
| Bias | Authors' judgement | Support for judgement |
| Random sequence generation (selection bias) | Unclear risk | Not reported |
| Allocation concealment (selection bias) | Unclear risk | Not reported |
| Blinding (performance bias and detection bias) | Low risk | Outcome assessor blinded |
| Incomplete outcome data (attrition bias) | Low risk | All randomised participants included in analyses |
| Selective reporting (reporting bias) | Low risk | All prespecified outcomes reported |
| Other bias | Unclear risk | Comparability of groups at baseline not reported |
| Methods | Parallel group RCT, People's Republic of China | |
| Participants | Inclusion criteria: poststroke aphasia Details of participants are shown in Table 1 | |
| Interventions | 1. Conventional SLT Intervention: "One‐to‐one rehabilitative training". Rationale not reported. Materials: not reported. Procedures: nurse talked to each patient. Provided by: doctor or nurse (training not reported). Delivery: face‐to‐face; 1‐to‐1; location not reported. Regimen: therapy delivered daily for 28 d. Total dose of therapy delivered over the intervention not reported. Tailoring: not reported. Modification: not reported. Adherence: not reported. 2. No SLT Intervention: no therapy. Materials: none Procedures: none. Provided by: none. Delivery: none. Regimen: none. Tailoring: none. Modification: none. Adherence: not reported. | |
| Outcomes | CRRCAE | |
| Notes | Translated by Chinese Cochrane Centre Statistical data included within the review meta‐analyses | |
| Risk of bias | ||
| Bias | Authors' judgement | Support for judgement |
| Random sequence generation (selection bias) | Unclear risk | Not reported |
| Allocation concealment (selection bias) | Unclear risk | Not reported |
| Blinding (performance bias and detection bias) | Low risk | Outcome assessor blinded |
| Incomplete outcome data (attrition bias) | Low risk | All randomised participants included in analyses |
| Selective reporting (reporting bias) | Low risk | All prespecified outcomes reported |
| Other bias | Unclear risk | Comparability of groups at baseline not reported |
| Methods | Parallel group RCT, People's Republic of China | |
| Participants | Inclusion criteria: aphasia following stroke Details of participants are shown in Table 1 | |
| Interventions | 1. Group SLT Intervention: "Collective Language Strenghtening Training". Rationale not reported. Materials: not reported. Procedures: doctor or nurse talked to all patients and they were encouraged to communicate with each other in small groups (10 participants). Provided by: doctor or nurse (training not reported). Delivery: face‐to‐face; group; location not reported. Regimen: therapy delivered daily for 28 d. Total dose of therapy delivered over the intervention not reported. Tailoring: not reported. Modification: not reported. Adherence: unclear. 2. Conventional SLT Intervention: "One‐to‐one rehabilitative training". Rationale not reported. Materials: not reported. Procedures: nurse talked to each patient. Provided by: doctor or nurse (training not reported). Delivery: face‐to‐face; 1‐to‐1; location not reported. Regimen: therapy delivered daily for 28 d. Total dose of therapy delivered over the intervention not reported. Tailoring: not reported. Modification: not reported. Adherence: not reported. | |
| Outcomes | Primary outcome: CRRCAE | |
| Notes | Translated by Chinese Cochrane Centre Statistical data included within the review meta‐analyses | |
| Risk of bias | ||
| Bias | Authors' judgement | Support for judgement |
| Random sequence generation (selection bias) | Unclear risk | Not reported |
| Allocation concealment (selection bias) | Unclear risk | Not reported |
| Blinding (performance bias and detection bias) | Low risk | Outcome assessor blinded |
| Incomplete outcome data (attrition bias) | Low risk | All randomised participants included in analyses |
| Selective reporting (reporting bias) | Low risk | All prespecified outcomes reported |
| Other bias | Unclear risk | Comparability of groups at baseline not reported |
| Methods | Parallel group RCT, People's Republic of China | |
| Participants | Inclusion criteria outpatients with "apoplectic aphemia" Exclusion criteria: none available Group 1: 19 participants Group 2: 17 participants Details of participants are shown in Table 1 | |
| Interventions | 1. SLT Intervention: "Rehabilitation". Rationale not reported. Materials: not reported. Procedures: rehabilitation, visual‐listening, articulation, speech training. Provided by: other therapists working in setting. Delivery: not reported. Regimen: not reported. Tailoring: not reported. Modification: not reported. Adherence: not reported. 2. No SLT Intervention: no therapy. Materials: none Procedures: none. Provided by: none. Delivery: none. Regimen: none. Tailoring: none. Modification: none. Adherence: not reported. | |
| Outcomes | Primary outcomes: Aphasia Battery of Chinese (verbal expression, comprehension, reading, writing), CFCP, BDAE Data collection: assessed before and after therapy | |
| Notes | People's Republic of China Dropouts: none | |
| Risk of bias | ||
| Bias | Authors' judgement | Support for judgement |
| Random sequence generation (selection bias) | Unclear risk | Not reported |
| Allocation concealment (selection bias) | Unclear risk | Not reported |
| Blinding (performance bias and detection bias) | Low risk | Assessor blinded |
| Incomplete outcome data (attrition bias) | Low risk | All randomised participants appear to have been included within the analyses |
| Selective reporting (reporting bias) | Unclear risk | Not reported |
| Other bias | Unclear risk | Details not reported Groups comparable at baseline |
| Methods | Parallel group RCT, People's Republic of China | |
| Participants | Inclusion criteria outpatients with "apoplectic aphemia" Exclusion criteria: not reported Group 1: 20 participants Group 2: 17 participants Details of participants are shown in Table 1 | |
| Interventions | 1. SLT Intervention: "Rehabilitation plus acupuncture group". Rationale not reported. Materials: not reported. Procedures: rehabilitation, visual‐listening, articulation, speech training and acupuncture. Provided by: other therapists working in setting. Delivery: not reported. Regimen: not reported. Tailoring: not reported. Modification: not reported. Adherence: not reported. 2. No SLT Intervention: no therapy. Materials: none. Procedures: none. Provided by: none. Delivery: none. Regimen: none. Tailoring: none. Modification: none. Adherence: not reported. | |
| Outcomes | Primary outcomes: Aphasia Battery of Chinese, CFCP, BDAE Data collection: assessed before and after therapy | |
| Notes | Dropouts: none | |
| Risk of bias | ||
| Bias | Authors' judgement | Support for judgement |
| Random sequence generation (selection bias) | Unclear risk | Not reported |
| Allocation concealment (selection bias) | Unclear risk | Not reported |
| Blinding (performance bias and detection bias) | Low risk | Assessor blinded |
| Incomplete outcome data (attrition bias) | Low risk | All randomised participants appear to have been included within the analyses |
| Selective reporting (reporting bias) | Unclear risk | Not reported |
| Other bias | Unclear risk | Not reported Groups comparable at baseline |
| Methods | Parallel group RCT, People's Republic of China | |
| Participants | Inclusion criteria: people with aphasia from "ischaemic apoplexy" Exclusion criteria: not reported Group 1: 98 participants Group 2: 40 participants | |
| Interventions | 1. SLT Intervention: speech and language therapy with acupuncture. Rationale not reported. Materials: not reported. Procedures: not reported. Provided by: nursing staff, training not reported. Delivery: not reported. Regimen: not reported. Delivered over 2 months. Tailoring: not reported. Modification: not reported. Adherence: not reported. 2. No SLT No SLT, routine medicine over 2 months. Materials: none. Procedures: none. Provided by: none. Delivery: none. Regimen: none. Tailoring: none. Modification: none. Adherence: not reported. | |
| Outcomes | Primary outcomes: Aphasia Battery of Chinese | |
| Notes | Dropouts: none | |
| Risk of bias | ||
| Bias | Authors' judgement | Support for judgement |
| Random sequence generation (selection bias) | Unclear risk | Not reported |
| Allocation concealment (selection bias) | Unclear risk | Not reported |
| Blinding (performance bias and detection bias) | Unclear risk | Not reported |
| Incomplete outcome data (attrition bias) | Low risk | All randomised participants appear to have been included within the analyses |
| Selective reporting (reporting bias) | Unclear risk | Not reported |
| Other bias | Unclear risk | Not reported No statistically significant differences reported between the groups at baseline |
AAC: Alternative and Augmentative Communication; AAT: Aachen Aphasia Test; ACTS: Auditory Comprehension Test for Sentences; ADL: activities of daily living; AMERIND:American Indian, a general communication system; ANELT: Amsterdam‐Nijmegen Everyday Language Test; AQ: Aphasia Quotient; BDAE: Boston Diagnostic Aphasia Examination; CADL:Communication Abilities of Daily Living; CETI: Communicative Effectiveness Index; CFCP: Chinese Functional Communication Profile; CHSPT: Caplan and Hanna Sentence Production Test; CIAT: constraint‐induced aphasia therapy; CMA: Canadian Medical Association; CRRCAE: Chinese Rehabilitation Research Centre Aphasia Examination; CT: computerised tomography; CVA: cerebrovascular accident; DA: discourse analysis; dB: decibels; FAST: Frenchay Aphasia Screening Test; FCP: FunctionalCommunication Profile; FE scale: Functional‐Expression scale; GCS: Glasgow coma scale; GHQ: general health questionnaire; GP: general practitioner; ITT: intention‐to‐treat; MAACL: Multiple Adjective AffectCheck‐List; MCA: middle cerebral artery; MDT: multidisciplinary team; MRI: magnetic resonance imaging; MTDDA: Minnesota Test for the Differential Diagnosis of Aphasia; NGA: Norsk Grunntest for Afasi; NHP: Nottingham Health Profile; NHS: National Health Service (UK); NIHSS: National Institutes of Health Stroke Scale; ONT: Object Naming Test; ORLA: Oral Reading for Language in Aphasia; PACE: Promoting Aphasics' Communicative Effectiveness; PALPA: Psycholinguistic Assessments of Language Processing in Aphasia; PCB: Philidelphia Comprehension Battery; Peabody PVT: Peabody Picture Vocabulary Test; PICA: Porch Index of Communicative Abilities; RCBA: Reading Comprehension Battery for Aphasia; RCT: randomised controlled trial; SAQolL: stroke and aphasia quality of life scale; SAT: Semantic Association Test; SD: standard deviation; SLT: speech and language therapy; SPICA: Shortened Porch Index of Communicative Abilities; STACDAP: Systematic Therapy for Auditory Comprehension Disorders in Aphasic Patients; TACS: Texas Aphasia Contrastive‐Language Series; TOMs: Therapy Outcomes Measures; WAB: Western Aphasia Battery; WAIS: Wechsler Adult Intelligence Scale.
Characteristics of excluded studies [ordered by study ID]
| Study | Reason for exclusion |
| Non‐RCT | |
| Non‐RCT | |
| Non‐RCT | |
| Non‐RCT | |
| Non‐RCT | |
| Non‐SLT intervention (music therapy) | |
| Non‐RCT | |
| Experimental and control groups had same SLT intervention with experimental group also receiving cortical stimulation | |
| Non‐SLT intervention (epidural cortical stimulation) | |
| Non‐RCT | |
| Quasi‐randomised trial | |
| Included conditions other than stroke | |
| Included conditions other than stroke | |
| Single‐subject, multiple baseline across behaviours design | |
| non‐RCT | |
| Non‐RCT | |
| Unable to obtain aphasia‐specific data | |
| Unable to obtain aphasia‐specific data | |
| Quasi‐randomised trial | |
| Non‐RCT | |
| Quasi‐randomised trial | |
| Non‐RCT | |
| Unable to obtain aphasia‐specific data | |
| Non‐RCT | |
| Non‐SLT intervention (acupuncture) | |
| Randomisation to groups inadequate; group allocation could be predicted | |
| Quasi‐randomised trial | |
| Not all participants had aphasia | |
| Non‐RCT | |
| Randomisation dictated order of task presentation | |
| Quasi‐randomised trial | |
| Pharmacological intervention evaluation | |
| Pharmacological intervention evaluation | |
| Non‐RCT | |
| Non‐RCT | |
| Stroke specific data unavailable | |
| Non‐RCT | |
| Non‐SLT comparison (SLT + acupuncture versus SLT) | |
| Non‐RCT | |
| Non‐RCT | |
| Intervention did not aim to improve communication skills but learning of non‐words | |
| Non‐RCT | |
| Non‐RCT | |
| Randomisation to groups inadequate; group allocation could be predicted | |
| Non‐RCT | |
| Included conditions other than stroke (mixed aetiology ‐ stroke and TBI) | |
| Non‐SLT intervention (acupuncture) | |
| Quasi‐randomised trial | |
| Non‐SLT intervention | |
| Non‐RCT | |
| Non‐RCT | |
| Unable to obtain aphasia‐specific data | |
| Included conditions other than stroke | |
| Quasi‐randomised trial | |
| Non‐RCT Unclear whether any postintervention assessment of language function is available | |
| Study was not completed | |
| Non‐RCT | |
| Non‐SLT intervention (transcranial direct current stimulation) | |
| Not all participants had aphasia | |
| Non‐SLT intervention (transcranial magnetic stimulation) | |
| Non‐RCT (2 cohort comparison study design) | |
| Non‐RCT (matched controls) | |
| Unable to obtain aphasia‐specific data | |
| Included conditions other than stroke | |
| Mixed aetiology (18 traumatic brain injury, 18 brain infarct, 6 brain ischaemia, 6 brain poisoning, 12 brain haemorrhage) | |
| Unable to obtain aphasic‐specific data |
RCT: randomised controlled trial; SLT: speech and language therapy; TBI: traumatic brian injury.
Characteristics of studies awaiting assessment [ordered by study ID]
| Methods | "An experimental group and a control group of subjects, with patients assigned randomly to one or other treatment." |
| Participants | N = 40 Inclusion criteria: within 6 weeks of stroke, severe global aphasia Exclusion criteria: none |
| Interventions | 20 sessions over 3 to 5 weeks 1. E‐VIC delivered by therapist 2. Conventional SLT delivered by therapist |
| Outcomes | Unclear 'primary goal of the project is to determine whether training with the experimental intervention has an effect on rate and level of recovery of language function' |
| Notes | — |
| Methods | RCT ("randomly divided into two equal groups") |
| Participants | 8 "aphasia patients (aged 41 to 77) with predominantly expressive aphasia" Inclusion criteria: not reported Exclusion criteria: not reported |
| Interventions | 1. Experimental group: first level of melodic intonation therapy based on Sparks 1974 2. Control group: intervention details not reported All participants received "three 1 hour individual weekly sessions" |
| Outcomes | Not reported |
| Notes | Abstract only. British Library cannot locate the full‐text paper |
| Methods | "Prospective comparative study, randomised, multicenter, superiority, a student study group for 3 months using the workbook C.COM compared to a control group not using it, but receiving the same amount of speech therapy using such non‐imaged media of communication" |
| Participants | 29 recent stroke patients with severe expressive aphasia from 43 to 91 years, without visual gnostic disorder, were included in 6 participating centres of the great Southwest. The 2 groups did not differ at baseline in terms of severity of aphasia, related disorders, and pragmatic assessment of the communication |
| Interventions | "In France, the communication workbook C.COM, associated with a specific procedure for the construction, use, and guidance of partner and caregiver, has been used since 2004. Communication is studied on a test of pragmatic communication (test of the 6 tasks) with 6 arbitrary instructions, graded according to 2 levels of difficulty, with a double‐blind videotape evaluation. Secondarily, the study examines what patient and partner think about the effectiveness of the C.COM, its effective use every day, the scores on tests assessing associated verbal communication, functional communication, the analytical capabilities of language, the depressive state" |
| Outcomes | Not reported |
| Notes | Abstract only. Further information sought from the authors regarding randomisation and who delivered the intervention, but no response received to date |
| Methods | No details available |
| Participants | No details available |
| Interventions | No details available |
| Outcomes | No details available |
| Notes | Website reference only. No abstract available. Clarification sought from authors but not obtained |
| Methods | Cross‐over RCT |
| Participants | 12 adults with chronic acquired aphasia Inclusion criteria: "specific word‐finding problems, as a consequence of acquired aphasia; were at least 6 months and mostly several years post onset; no severe visual problems; could repeat single words; no visual agnosia; and agreed to take part in the experiment" Exclusion criteria: none listed |
| Interventions | 1. Semantic treatment 2. Phonological treatment "Each patient in the study participated in both types of treatment (obviously with different target sets); 4 weeks (without formal therapy) intervened between the two types. Half the patients had 2 weeks of treatment with each method and half had 1 week. Half of the patients began with semantic and half with phonological therapy; equal numbers of patients in each treatment duration condition received the treatments in each of the two orders" |
| Outcomes | Picture naming test |
| Notes | — |
| Methods | Health technology assessment. No other information available at present |
| Participants | Data not available |
| Interventions | Data not available |
| Outcomes | Data not available |
| Notes | No abstract available. Project commissioned by German Agency for Health Technology Assessment at the German Institute for Medical Documentation and Information (DAHTA DIMDI) http://onlinelibrary.wiley.com/o/cochrane/clhta/articles/HTA‐32015000383/frame.html |
| Methods | Randomised stratified trial with involvement from Biometrical Center Aachen |
| Participants | 156 Inclusion criteria: aphasia, at least 4 months post onset Exclusion criteria: 75 years or older, bilateral lesions, retro and anterograde amnesia, progressive disease (e.g. dementia), inability to complete first part of Token Test, failure to pass screening test for computer use Group 1: 77.9% had aphasia following stroke |
| Interventions | 1. Conventional SLT (as below) augmented by computer‐facilitated SLT (additional 30 h) 2. Conventional SLT ‐ 5 h weekly for 6 weeks |
| Outcomes | AAT (and subtests Token Test, repetition, written language, naming, language comprehension) |
| Notes | Funded by the German Ministry for Research and Technology (BMFT) |
| Methods | "Randomly divided into a music therapy group (N = 42) and speech language therapy group (N = 42) . . . based on table of random numbers" |
| Participants | 84 Inclusion criteria: "post‐stroke patients with non‐fluent aphasia" Exclusion criteria: none reported |
| Interventions | 1. Conventional SLT 2. Music therapy No other details about the individual interventions are available in the abstract |
| Outcomes | Chinese version: WAB Data collection: "before and after therapy" (1 month post‐treatment) |
| Notes | Abstract only. Difficulty locating the full text paper as there is limited information about the journal this trial is published in |
AAT: Aachen Aphasia Test; SLT: speech and language therapy; WAB: Western Aphasia Battery.
Characteristics of ongoing studies [ordered by study ID]
| Trial name or title | Reducing the psychosocial impact of aphasia on mood and quality of life in people with aphasia and the impact of caregiving in family members through the Aphasia Action Success Knowledge (Aphasia ASK) program: a cluster randomised controlled trial ("In stroke patients with aphasia and their caregivers does the Aphasia ASK Action Success Knowledge (ASK) program, compared to an attention control package, promote better mood and overall quality of life outcomes?") |
| Methods | RCT. Hospital clusters will be randomised to either 1 of the 2 treatment arms. Participants will undergo the assigned treatment arm with a qualified speech pathologist from when they are first recruited until 12 months poststroke. Allocation is not concealed |
| Participants | 344 people with aphasia and their family members Inclusion criteria: within 6 months poststroke, diagnosis of aphasia as a result of first stroke (as assessed using the Western Aphasia Battery‐Revised), 18 years of age or older, have adequate hearing and vision levels to participate as judged by the treating speech pathologist Exclusion criteria: concomitant cognitive disorders such as dementia or primary progressive aphasia, aphasia of an aetiology other than stroke, a history of recurrent depression (3 or more previous diagnosed episodes defined as needing to see a health practitioner for treatment – either psychotherapy or medication prescribed, confirmed by self report), current psychiatric diagnosis (e.g. depressive disorder; anxiety disorder, confirmed by medical record), current depressive symptoms upon screening with Stroke Aphasic Depression Questionnaire Hospital Version‐10 (score of 9 or more) or the Depression Intensity Scale Circles (score of 3 or more), currently receiving treatment in a psychiatric setting, enrolment in other aphasia or depression clinical treatment studies |
| Interventions | 1. The Aphasia ASK intervention consists of a face‐to‐face intervention and follow‐up phone calls provided by a speech pathologist up until 12 months poststroke. The intervention is for 6‐8 weeks for an hour each week. The topics in the intervention include a number of modules and cover a range of areas including: caregiver training (e.g. communication partner training), education (on aphasia, successful coping strategies and support services) stress management, positive adaptive strategies, sharing of personal stories and developing peer‐based support. The participants will be able to prioritise the order of modules based on their personal interest and needs. The prioritisation occurs during the module 'Before we begin'. The first session establishes the goals for the programme using collaborative goal setting techniques. The goals form the basis for prioritising the modules that are covered in future weeks. For example, if the participant's goal is to stay positive, there is a module on positive thinking that includes information about and practice on exercises for strategies which were drawn from the counselling literature. At the end of each module, further resources are recommended including community based options/programmes/resources. Goals are revisited each session. The modules are designed as a guide and should be incorporated with clinical skill and knowledge to ensure the programme is person‐centred. Aphasia ASK is to be delivered as individual sessions with only 1 participant with aphasia and their family member(s) involved at any time. Follow‐up monthly phone calls or visits (whichever method is suitable for the participants) will be made until 12 months poststroke. The follow‐up calls with revisit the participant goals set during the programme and provide additional information and resources where necessary. An Aphasia ASK programme manual has been written for the provider therapist and a separate aphasia friendly workbook has been written for the recipients. Recipients will receive the written materials prior to each session 2. A secondary stroke prevention programme forms the content of the attention control package. It will be provided in a similar dosage (1 h session per week for 6‐8 weeks and follow‐up monthly phone calls until 12 months poststroke) and similar format (written support materials, delivered to both patients and their family) to the Aphasia ASK intervention The information that will inform the modules will include: What is stroke? Recovery from stroke Understanding risk factors for stroke; Lifestyle interventions; Barriers to implementing lifestyle changes; Understanding your medication |
| Outcomes | Primary outcomes: Assessment for Living with Aphasia (ALA); Stroke and Aphasia Depression Questionnaire (SADQ‐21) Secondary outcomes: Bakas Caregiver Outcomes Scale –Revised (BCOS); General Health Questionnaire (GHQ‐28), self reported stroke risk‐related behaviours of people with aphasia Data collection: baseline (enrolment of study, within 6 months of aphasia onset) and at postintervention (at 12 months post aphasia onset) of stroke |
| Starting date | 18 May 2015 |
| Contact information | Prof Linda Worrall Address: CCRE in Aphasia Rehabilitation, School of Health and Rehabilitation Sciences, Level 8, Therapies Building 84a, The University of Queensland, St Lucia, QLD 4072 Australia |
| Notes | http://www.anzctr.org.au/ACTRN12614000979651.aspx Expected completion: 31/12/2018 |
| Trial name or title | A study to assess the clinical and cost effectiveness of aphasia computer treatment versus usual stimulation or attention control long term post stroke (Big CACTUS) |
| Methods | Pragmatic, parallel group randomised controlled adjunct trial design |
| Participants | N = 285 Inclusion criteria: participants will be included if aged 18 or over, diagnosis of stroke(s), onset of stroke at least 4 months prior to randomisation, diagnosis of aphasia, subsequent to stroke, as confirmed by a trained speech and language therapist, word retrieval difficulties tested by the naming test of the Comprehensive Aphasia Test (score of 10%‐90%, 5‐43/48) and ability to perform a simple matching task with the StepbyStep programme (to confirm sufficient vision and cognitive ability to participate in the intervention) Exclusion criteria: participants will be excluded from the study if they have another premorbid speech and language disorder caused by a neurological deficit other than stroke (a formal diagnosis can be reported by the participant or relatives and confirmed by the recruiting speech and language therapist); they are unable to repeat words (suggesting presence of severe dyspraxia), they require treatment for a language other than English (as the software is in English) and they are currently using the StepbyStep computer programme or other computer speech therapy aimed at word retrieval/naming |
| Interventions | 1. self managed computerised therapy intervention plus usual care (UC) (N = 95). The intervention targets word retrieval as it is 1 of the challenges most frequently experienced by people with aphasia, restricting their communication. The intervention is composed of 3 components: SLT‐tailored computer exercises; regular self managed practice and volunteer support to assist with treatment adherence and carryover into daily activity 2. Usual care control arm (N = 95). Usual care may consist of participation in a range of activities to a greater or lesser extent. This may include face‐to‐face speech and language therapy targeting language impairment (reading, writing, speaking or understanding); therapy focusing on compensatory communication strategies, provision of communication aids or psychological support; attendance at voluntary support groups or informal communication support from family and friends. Participants randomised to the UC group will not receive any project‐specific intervention 3. Attention control plus UC group (N = 95). SLT to select puzzle book of appropriate level. Contacted month by research team to check progress with puzzles and see if need another book |
| Outcomes | Primary outcomes: change in the number of words (of personal relevance to the participant) named correctly at 6 months will be measured by a picture‐naming task; improvement in functional communication will be measured by blinded ratings of video‐recorded conversations between a speech and language therapist and participants using the activity scale of the Therapy Outcome Measures and number of target words used in conversation, at 6 months Secondary outcomes: improvement in patient perception of communication will be measured using the COAST ‐ a patient‐reported measure of communication participation and related quality of life Data collection: baseline, 6 months, 9 months and 12 months |
| Starting date | 01 September 2014 |
| Contact information | Dr Rebecca Palmer, School of Health and Related Research, University of Sheffield, |
| Notes | http://www.nets.nihr.ac.uk/projects/hta/122101 Trial website: http://www.sheffield.ac.uk/scharr/sections/dts/ctru/bigcactus Expected recruitment completion 30/07/2016. Reporting: 30 June 2018 |
| Trial name or title | Computerised Therapy in Chronic Stroke (CATChES) |
| Methods | Cross‐over design 3 fMRI/DTI time points before and after iPad facilitated therapy for expressive speech problems |
| Participants | N = 40 Inclusion Criteria: left hemisphere, first ever stroke; non‐fluent expressive aphasia, aged > 18 years, adequate co‐operation for scanning, right‐handed prior to stroke (Edinburgh Inventory of Handedness), native British‐English speakers, no history of neurological or psychiatric disorders, no specific cognitive deficits (other than language), no contra‐indication to MRI scan (as per WBIC protocol), able to lie flat in scanner for 2 hours, provision of consent from patient, chronic aphasia (present for more than 12 months) Exclusion Criteria: women with any chance of pregnancy, claustrophobia, contra‐indication to MRI (as per WBIC protocol), concomitant medical disorder that means patient unable to lie flat for 2 hours, history of significant premorbid cognitive impairment, alcohol or illicit drug abuse, history of significant neurological disease, major organ failure, age more than 80 years. Following recruitment ‐ demonstration of intact inner speech with good overt speech or demonstration of poor inner speech with poor overt speech |
| Interventions | 1. Computerised therapy delivered at home via a portable tablet 2. Mind games (attention, memory, spatial awareness and executive function) therapy delivered at home via a portable tablet |
| Outcomes | Primary outcome: brain changes as measured by fMRI and DTI Secondary outcomes: effectiveness, feasibility and adherence to computerised therapy used on portable tablet. Qualitative feedback. Number of participants showing language improvements as measured by neuropsychological language batteries Data collection: measured at 5, 10 and 18 weeks from baseline |
| Starting date | November 2013 |
| Contact information | Prof Elizabeth Warburton [email protected] |
| Notes | National Institute for Health Research. Results expected by 2016 http://clinicaltrials.gov/show/NCT01928602 |
| Trial name or title | Constraint induced or multi‐modal aphasia rehabilitation: an RCT of therapy for stroke‐related chronic aphasia (COMPARE) |
| Methods | 3‐arm RCT |
| Participants | N = 198 (66 participants in each arm) Patients with chronic poststroke aphasia will be eligible for this trial Inclusion criteria: documented single stroke resulting in aphasia at least 6 months and not more than 3 years prior to assessment; aphasia of any type (<93.8 WABAQ); normal or corrected hearing and vision Exclusion criteria: previous stroke or neurological event/diagnosis (head injury, neurosurgery, dementia, epilepsy), severe apraxia of speech or dysarthria, diagnosed major clinical depression or other mental health condition, English as a second language |
| Interventions | 1. Multi‐modal aphasia rehabilitation (M‐MAT) 2. Constraint induced aphasia therapy (CIAT Plus) 3. Usual care (standardised, limited aphasia therapy) For both CIAT and M‐MAT, 30 h of treatment (3 h/d, 5 d/week, for 2 weeks) and a daily home practice communication task (15 minutes) will be given to each participant, consistent with previous CIAT and M‐MAT studies All aphasia therapy will be delivered in a small group setting (3 participants per group) by a qualified speech pathologist |
| Outcomes | Primary outcomes: Western Aphasia Battery‐ Aphasia Quotient (WABAQ) Secondary outcomes: Stroke and Aphasia Quality of Life Scale (SAQOL‐39), Communicative Effectiveness Index (CETI), connected speech measures and resource utilisation Data collection: baseline, immediately after treatment and at 12 weeks post‐treatment |
| Starting date | 2015 (trial set‐up); 2016 (recruitment) |
| Contact information | Assoc Prof Miranda Rose, La Trobe University, Melbourne, Australia |
| Notes | Expected completion: 2018 Clinical trials registration no currently being organised |
| Trial name or title | FCET2EC (From controlled experimental trial to = 2 everyday communication): How effective is intensive integrative therapy for stroke‐induced chronic aphasia under routine clinical conditions? |
| Methods | Prospective randomised open blinded end‐point (PROBE) design |
| Participants | N = 126 Inclusion criteria: non‐haemorrhagic or haemorrhagic cortical, subcortical, or subcortico‐cortical stroke; presence of aphasia for at least 6 months; aged 18‐70 years; German as (the first) native language; score of at least 1 (between 0 and 5) on the communicative ability scale of the Aachen Aphasia Test (AAT); less than the maximum score of 10 error points on the first of 5 sub‐tests of the AAT Token Test (securing basic comprehension of spoken instructions) Exclusion criteria: no verifiable aphasia according to the criteria of the AAT; aphasia due to traumatic brain injury or neurodegenerative diseases; severe uncontrolled medical problems; severe uncorrected‐to‐normal visual or auditory impairment |
| Interventions | 1. Intensive integrative aphasia therapy. Intensive language therapy (3 weeks, 5 d/week ≥ 10 h/week) provided in regular clinical setting and consisting of a combination of language systematic and communicative‐pragmatic treatment. Group starts intensive language therapy within 3 workdays (or as soon as possible) after baseline exam 2. Waiting list control group. Control group starts intensive language therapy after a 3‐week waiting period with assessments prior to and after the waiting period |
| Outcomes | Primary outcome: ANELT‐A Secondary outcomes: specially devised screening measures for language systematic and communicative‐pragmatic communication ability; the German version of the Stroke and Aphasia Quality of Life Scale‐39/SAQOL‐39; German version of the Communicative Effectiveness Index/CETI; B‐scale (intelligibility) of the ANELT scenarios; ratings of the syntactic complexity of the ANELT scenarios using the AAT scoring system for spontaneous speech; ratings of non‐verbal communication skills on the ANELT scenarios (based on the Scenario test, measures of general cognitive functioning Data collection: baseline, 3 weeks and at 6 months post‐treatment. A subgroup from both conditions will also be assessed 5 weeks post‐treatment |
| Starting date | Trial started in February 2012; patient recruitment started 1 April 2012 |
| Contact information | Annette Baumgaertner, PhD Faculty of Health and Social Sciences, Fresenius University of Applied Sciences, Alte Rabenstrasse 2, 20148 Hamburg, Germany, email: baumgaertner@hs‐fresenius.de Caterina Breitenstein, PhD Dept of Neurology, University of Muenster, Albert‐Schweitzer‐Campus 1, bldg A1 48149 Muenster, Germany Email: caterina.breitenstein@uni‐muenster.de |
| Notes | Last patient enrolled in June 2014 (last patient out after 6‐month follow‐up: January 2015) N = 156 participants enrolled (N = 78 per group); no participants lost to immediate follow‐up; N = 2 participants lost at the 6‐months follow‐up |
| Trial name or title | IMITATE: an intensive computer‐based treatment for aphasia based on action observation and imitation |
| Methods | N = 57 participants with aphasia randomised into 2 groups |
| Participants | Inclusion criteria: single ischaemic infarction in the MCA territory involving the cerebral cortex, aphasia, visual attention and language comprehension sufficient to perform imitation fMRI tasks, right‐handed prior to stroke Exclusion criteria: cardiac pacemakers, claustrophobia, neurosurgical clips, significant cognitive impairment likely to impair co‐operation on cognitive tasks |
| Interventions | 1. IMITATE: home‐based, 30 min, 3 times daily, 6 d weekly (total of 9 h weekly) for 6 weeks' observation of audio‐visual presentations of words and phrases followed by oral repetition of the stimuli 2. Control: not reported |
| Outcomes | Primary outcome: WAB Secondary outcome measures: subtests from the Apraxia Battery for Adults, the BNT, the 'cookie theft' picture description task from the BDAE, the SAQoL Data collection: not reported |
| Starting date | August 2007 |
| Contact information | Professor Steven Small |
| Notes | Expected completion: 2013 NCT00713050 |
| Trial name or title | Timing and intensity of SLT services among people with aphasia |
| Methods | N = 40 participants with aphasia randomised into 4 groups that vary in the intensity of SLT allocated and in the onset of therapy |
| Participants | Inclusion criteria: 50‐80 years old, first CVA in the left hemisphere, living locally, diagnosis in university hospital, diagnosis confirmed by CT/MRI, availability of a relative; therapy sessions stating 4 weeks after onset |
| Interventions | 1. High‐intensity SLT group: 45 minutes 2 times per day, 5 d per week for 6 weeks |
| Outcomes | Primary outcome measure: functional communicative skills (CETI) (people with aphasia and their caregiver(s) complete the forms separately Secondary outcome measures: speech comprehension (Token Test, Pizzamigglio Sentence Test, Token Test and subtests from the BDAE); Speech production (BDAE subtests) and BNT, Quick Aphasia Screening Test,and time to complete tests is also measured. Emotional well being: Montgomery & Åberg Depression scale (people with aphasia) and with Beck's Depression scale (caregivers) Data collection: assessments were administered at 1 , 4, 10, 14, 20, 32 and 52 weeks poststroke . Each participant had a over 1 year (56 weeks) follow‐up |
| Starting date | October 2002 ‐ May 2007 (data collection completed) No dropouts, but 4 participants died within 2 months post onset |
| Contact information | Tarja Kukkonen, Speech and Language Therapist Ph, MEsc, MSc Lecturer in Logopedics, Department of Speech, Communication and Voice Research, 33014 University of Tampere, Finland Tel. +358 44 3455033 |
| Notes | No dropouts from study |
| Trial name or title | Overcoming learned non‐use in chronic aphasia |
| Methods | Single blind parallel group RCT |
| Participants | N = 24 Inclusion criteria: unilateral left hemisphere stroke at least 6 months earlier; aphasia with moderate‐to‐severe word retrieval impairments; at least 21 years of age; premorbidly right handed; native speaker of English Exclusion criteria: history of developmental learning difficulties; history of prior neurological illnesses; chronic medical illnesses that restrict participation in intensive therapy; recent alcohol or drug dependence; severe uncorrected impairments of vision or hearing; any contraindication to a 3T MRI procedure (e.g. claustrophobia, metal implants or fragments in body, pregnancy) |
| Interventions | 1. Constrained‐intensive language action therapy |
| Outcomes | Primary outcome: change from baseline on Confrontation Naming Task Secondary outcomes: change from baseline Boston Diagnostic Aphasia Examination; change from baseline Boston Naming Test; change from baseline discourse samples; change from baseline Assessment of Living with Aphasia Data collection: baseline, assessments immediately post‐treatment (2 weeks) and assessments post home practice programme at approximately 6 and 12 months post‐treatment |
| Starting date | February 2013 |
| Contact information | Dr Jacquie Kurland, University of Massachusetts, Amherst, Massachusetts, United States, 01003 Tel. +413‐545‐4007 |
| Notes | Expected completion: August 2016 |
| Trial name or title | A stratified randomised control trial of an intensive, comprehensive aphasia program to compare patient outcomes post stroke with usual care Short title: Can a new intensive model of aphasia rehabilitation achieve better outcomes than usual care? |
| Methods | Parallel single blinded 2 arm stratified block randomisation pragmatic trial Stratified randomisation will be used in order to ensure balance between LIFT and usual care groups with respect to severity of aphasia (mild/moderate, severe) using the Language Screening Test (LAST) screening assessment |
| Participants | N = 234 Family members/carers of people with aphasia (N = 234) Treating speech pathologists (N = up to 50): Stakeholders (N = 30) Inclusion criteria: Participants with aphasia: confirmed stroke (medical chart) and confirmed aphasia using the Language Screening Test; score above cut‐off on the cognitive subtest of the Comprehensive Aphasia Test; willing to forego other speech therapy for the duration of the study and during follow‐up; able to toilet independently or with the assistance of an accompanying caregiver; requires at least 7 more weeks of therapy as reported by the referring speech pathologist; English language, hearing and vision sufficient for therapy as judged by the referring speech pathologist and the research assistant. Family members/carers of participants with aphasia: able to speak English. Treating speech pathologists: qualified practising speech pathologists, employed by either the University of Queensland (UQ) or the partner hospitals, who are providing either LIFT or usual care to the people with aphasia in this study. Speech pathology stakeholders: speech pathology managers, speech pathologists and consumers (i.e. people with aphasia and their family members/carers) Exclusion criteria: Participants with aphasia: a co‐existing neurological or mental health condition (e.g. dementia, severe depression); severe apraxia of speech or severe dysarthria; global aphasia preventing completion of assessments tasks; transition care patients who receive aphasia services at home on discharge from hospital. Family members/carers of people with aphasia: must not have dementia or other cognitive impairments; must not have uncorrected vision or hearing impairments that will prevent participation. Treating speech pathologists: no exclusion criteria. Speech pathology stakeholders: no exclusion criteria |
| Interventions | 1. LIFT: 3 week intensive programme + 4 weeks maintenance, delivered by trained speech pathologists at The UQ CCRE Aphasia Clinic and other rehabilitation centres of our Partner Organisations. Participants in LIFT attend 60 minute sessions 10 times a week for individual therapy, 60 minute sessions 5 times each week of computer‐based therapy and 60 minute sessions twice per week of group therapy 2. Usual care: any aphasia therapy up to 12 months poststroke, delivered by typical speech pathology service providers in outpatient hospital setting or community based rehabilitation setting in the patients' homes or centres |
| Outcomes | Primary outcome: Content Information Units (CIUs) and Assessment for Living with Aphasia (ALA) Secondary outcomes: Comprehensive Aphasia Test (CAT), the Philadelphia Naming Test (Short Forms A and B), participant satisfaction (measured using a semi‐structured interview), Assessment of Quality of Life (AQoL‐4D). Secondary outcomes for use with family members of people with aphasia include: Communicative Effectiveness Index (CETI), Bakas Caregiver Outcomes Scale and participant satisfaction. Secondary outcomes for use with treating SLT include: Australian Therapy Outcome Measure (AUSTOMs). Secondary outcomes for use with speech language stakeholders include semi‐structured stakeholder interviews Data collection: baseline, post‐treatment and 12 months post onset of stroke |
| Starting date | 1 January 2014 |
| Contact information | Professor Linda Worrall Address: CCRE in Aphasia Rehabilitation, School of Health and Rehabilitation Sciences, Level 8, Therapies Building 84a, The University of Queensland, St Lucia, QLD 4072 Australia |
| Notes | www.anzctr.org.au/trial/registration/trialreview.aspx?ACTRN=12613001182785 Expected completion: 31/08/2019 |
| Trial name or title | Melodic Intonation Therapy USA |
| Methods | Interventional, randomised, active control, efficacy study, parallel assignment, single blind (outcomes assessor) treatment |
| Participants | Inclusion criteria: first ischaemic left‐hemisphere stroke, minimum of 12 months post onset, right‐handed prior to stroke, diagnosis of non‐fluent or dysfluent aphasia Exclusion criteria: > 80 years of age; > 1 stroke; presence of metal, metallic or electronic devices (cannot be exposed to MRI environment); terminal health condition; history of major neurological or psychiatric disease (e.g. epilepsy, meningitis, encephalitis); use of psychoactive drugs/medications (e.g. antidepressants, antipsychotic, stimulants); active participation in other stroke recovery trials testing experimental interventions |
| Interventions | 1. 75 sessions of MIT (approximately 16 weeks) 2. 75 sessions of speech repetition therapy (developed for this study ‐ verbal treatment method of equal intensity) (approximately 16 weeks) 3. No therapy (16 weeks) |
| Outcomes | Primary outcome: number of correct information units per minute produced during spontaneous speech Secondary outcomes: standard picture naming test, timed automatic speech, linguistically based measures of phrase and sentence analysis, functional and structural imaging measures Data collection at baseline (x 2), midpoint of therapy, end of therapy, 4 weeks after end of therapy |
| Starting date | 2008 |
| Contact information | Gottfried Schlaug (PI): [email protected] Andrea Norton, Music and Neuroimaging Laboratory, Stroke Recovery Laboratory, Beth Israel Deconess Medical Centre and Harvard Medical School, 330 Brookline Avenue_palmer 127, Boston MA 02215 Tel: +1 617 6328926 www.muscianbrain.com |
| Notes | ClinicalTrials.gov ID: NCT00903266 Expected completion: 2012 |
| Trial name or title | To study the effectiveness of 'Comprehensive Neuropsychological Rehabilitation' as an adjunct to standard pharmacological treatment for improving language and quality of life in patients with post stroke aphasia: a randomised controlled clinical trial |
| Methods | Randomised, parallel group, placebo controlled trial |
| Participants | N = 40 Inclusion criteria: participants of either sex aged 18‐65 years; any education level; language: Hindi or English; handedness: right; patients suffering first‐time ischaemic stroke diagnosed with non‐fluent or fluent aphasia within a year of index event; all consenting patients; caregiver (taking up the role of home‐based therapist) is available who has frequent contact with the subject (e.g. an average of 10 h per week or more), and can accompany the subject to all clinic visits for the duration of the rehabilitation programme Exclusion criteria: patients suffering from more than 1 episode of stroke affecting language and cognition, any medical condition limiting life expectancy; any major neurological disorder affecting cognition; any major psychiatric disorder; use of psychoactive drugs; active participation in other stroke recovery trials testing experimental intervention about cognition; pregnant women; patients with any contraindication for MRI and patients having claustrophobia |
| Interventions | 1. Intervention: comprehensive neuropsychological rehabilitation with aphasia therapy would be given along with normal clinical course of treatment by the treating doctor(neurologist). The rehabilitation would be patient specific and would likely be 4‐8 weeks for each patient. The next session would only be introduced if the patient is able to reach the ceiling effect for the tasks of the current week. The patient would be called once a week. Each session would last for 45 minutes to an hour 2. Control group: no comprehensive neuropsychological rehabilitation with aphasia therapy would be given, however, the normal clinical course of treatment would continue by the treating doctor. The control group patients would be called the same number of times as the patients of the intervention group by maintaining a follow‐up with the treating doctor (neurologist) and not the clinical neuropsychologist |
| Outcomes | Primary outcomes: change in the scores of language functioning from pre to postintervention in the following Secondary outcomes: change in scores from pre to postintervention of the following: cognitive functioning (memory, attention and executive functioning); depression and correlate with changes in neural activations (imaging using fMRI) Data collection: baseline, post‐1 month treatment and post‐3 months of comprehensive neuropsychological rehabilitation with aphasia therapy with the use of fMRI |
| Starting date | 01 May 2014 |
| Contact information | Assoc Prof Ashima Nehra, All India Institute of Medical Sciences, Faculty Chambers, Room # NS‐718, VIIth Floor, NEUROSCIENCES CENTER (AIIMS) All India Institute of Medical Sciences, New Delhi South, DELHI 110029 India |
| Notes | Expected completion: 01 May 2017 |
| Trial name or title | ORLA Write ‐ enhancing written communication in persons with aphasia |
| Methods | RCT |
| Participants | N = 50 Inclusion criteria: men or women with diagnosis of an aphasia subsequent to a left‐hemisphere infarct(s) that is confirmed by CT scan or MRI, an Aphasia Quotient score on the Western Aphasia Battery of 50 to 85, 6 months post injury, premorbidly right‐handed, determined by Edinburgh Handedness Inventory, completed at least an eighth grade education, premorbidly literate in English, visual acuity may be corrected but must be sufficient for reading visual stimuli on computer screen, auditory acuity may be aided but must be sufficient for hearing auditory stimuli in ORLA programme Exclusion Criteria: any other neurological condition that could potentially affect cognition or speech, such as Parkinson's Disease, Alzheimer's Dementia, traumatic brain injury, any significant psychiatric history prior to the stroke, such as severe major depression or psychotic disorder requiring hospitalisation, subjects with mood disorders who are currently stable on treatment will be considered, active substance abuse |
| Interventions | 1. ORLA: (Oral Reading for Language in Aphasia), a computer‐based virtual therapy system, for 90 min/d, 6 d/week for 6 weeks 2. ORLA + writing: practice on ORLA + writing computer programme Both 90 min/d, 6 d/week for 6 weeks |
| Outcomes | Primary outcomes: writing Score on the Western Aphasia Battery‐Revised (WAB‐R) Secondary outcomes: Western Aphasia Battery‐Revised Aphasia Quotient and Language Quotient (WAB‐R AQ and LQ); Written Language Sample Analysis; correct information units within written response to the picture description task of the WAB‐R; Communicative Effectiveness Index (CETI); ASHA Quality of Communication Life Scale (QCL); Data collection 6 weeks |
| Starting date | February 2013 |
| Contact information | Prof Leora Cherney, Rehabilitation Institute of Chicago [email protected] Dr. Jaime B. Lee, Rehabilitation Institute of Chicago [email protected] |
| Notes | Trial Registration: NCT01790880 End date: December 2015 |
| Trial name or title | Constraint in aphasia therapy. Is it important for clinical outcomes? |
| Methods | Pilot RCT with cross‐over |
| Participants | Clients with a diagnosis of aphasia with expressive language impairments |
| Interventions | 1. Constraint‐induced aphasia therapy (CIAT) 2. Unconstrained aphasia therapy (UAT) Therapy was conducted for 90 min/d 2 x week for 4 weeks. Following reassessment, groups received alternate treatment type |
| Outcomes | Not reported |
| Starting date | 2012 |
| Contact information | Prof Lyndsey Nickels, ARC Centre of Excellence in Cognition and its Disorders (CCD), NHMRC Centre of Clinical Research Excellence in Aphasia Rehabilitation, Department of Cognitive Science, Macquarie University, Sydney, NSW 2109 Australia |
| Notes | Expected completion: late 2015 Personal communication |
| Trial name or title | Speech therapy for aphasia: comparing two treatments (PMvSFA) |
| Methods | Parallel group RCT |
| Participants | N = 80 Inclusion criteria: single, left‐hemisphere stroke, English as primary language prior to stroke Exclusion criteria: other neurological disorders, untreated depression |
| Interventions | 1. Phonomotor therapy 2. Semantic feature analysis therapy Individuals in both groups will receive 60 h of therapy for free (2 h/d, 5 d/week, 6 weeks) |
| Outcomes | Primary outcome: spoken word production (confrontation naming) Secondary outcomes: response latency, verb production (confrontation naming) Data collection: baseline and 3 months following treatment termination |
| Starting date | March 2014 |
| Contact information | Dr Diane L Kendall, Department of Veterans Affairs, University of Washington |
| Notes | Expected completion: October 2017 (final data collection date for primary outcome measure) |
| Trial name or title | The efficacy of cognitive linguistic therapy in the acute stage of aphasia: an RCT |
| Methods | Parallel group RCT Cognitive linguistic SLT versus no SLT |
| Participants | N = 150 participants with aphasia within 2 weeks of acute stroke |
| Interventions | 1. Cognitive linguistic therapy: BOX (semantic therapy), FIKS (phonological therapy), or both for 7 h/week for 4 weeks (at least 2 h each week is 1‐to‐1 SLT with the therapist) |
| Outcomes | Primary outcome: ANELT‐A Data collection: 4 weeks (end of therapy), 3 months after randomisation, 6 months after randomisation |
| Starting date | January 2011 |
| Contact information | EG Visch‐Brink e.visch‐[email protected] |
| Notes | Expected completion: July 2014 |
| Trial name or title | TnT: Tablets and Technology during stroke Recovery. Determining the effect of access to and use of tablet technology on stroke survivor quality of life |
| Methods | Parallel RCT |
| Participants | N = 60 Inclusion criteria: aged 18+ years, admitted for rehabilitation for a recent (< 12 weeks ago) stroke (infarct or haemorrhagic) and received training and used tablet technology (i.e. iPad) during their inpatient stay Exclusion criteria: unable to follow 1 stage instructions, pre‐morbid or stroke related impairments preventing effective use of the iPad (may include cognition, motor planning or visual impairments) and patient has arranged access to a tablet device to use after discharge |
| Interventions | 1. Intervention group: given an iPad on discharge from inpatient rehabilitation. They will have it for 4 weeks and during this time will be able to use the iPad and the accompanying applications, in any way they so desire. Applications loaded on the iPads given to patients will include but are not limited to those which by design facilitate: communication (i.e. Speech Sounds on Cue, Conversation TherAppy), cognitive function (Memory, iMazing), dexterity (i.e. Dexteria), movement (i.e. physiotherapyexercises.com), socialisation (i.e. Facebook, Safari for email access) and participation in fun leisure‐based games (i.e. Angry Birds, Uno). Frequency of use of computer technology (which includes tablet devices such as the iPad, but also computers/smart phones/iPods) will be collected in both the control and intervention group through weekly telephone surveys 2. Standard post inpatient rehabilitation and care. Standard care is defined access to all the usual postdischarge services (i.e. referral to outpatient therapy/day hospital programmes/in home services) which is available within the patient's health service |
| Outcomes | Primary outcome: quality of life using the Stroke and Aphasia Quality of Life (SaQOL) Secondary outcome measures: WAB, Self efficacy using the Stroke Self‐Efficacy Questionnaire, participation using the Activity Card Sort (ACS) Data collection: baseline and 1 month postdischarge from inpatient rehabilitation |
| Starting date | 28 January 2014 |
| Contact information | Dr Heidi Janssen PhD, MHSC, BPhysio Hunter Medical Research Institute Stroke Research Team Level 3 East Lot 1, Kookaburra Circuit, New Lambton Heights NSW 2305 Mailing Address: HMRI, Locked Bag 1000, New Lambton NSW 2305 Australia |
| Notes | Recruitment completed. Data currently being analysed and will be published in due course ANZCTR (Ref 23308) |
| Trial name or title | U‐Health Service using mobile device for improvement of post‐stroke upper limb function and aphasia |
| Methods | Parallel group RCT |
| Participants | N = 36 Inclusion criteria: stroke confirmed by brain imaging study, impairment in upper extremity function or speech, native speaker of Korean Exclusion criteria: previous history of aphasia, psychiatric or psychotic problem, severe cognitive dysfunction, severe hearing or visual loss, cannot sit with devices |
| Interventions | 1. Mobile programme for occupational and speech therapy 2. Traditional rehabilitation therapy |
| Outcomes | Primary outcomes: Fugl‐Meyer upper extremity scale, short form K‐FAST (Korean version of Frenchay Aphasia Screening) Secondary outcomes: hand grip strength, Korean version of the Western Aphasia Battery (K‐WAB) Data collection: baseline and at 4 weeks |
| Starting date | March 2013 |
| Contact information | Prof Nam‐Jong Paik Department of Rehabilitation Medicine, Seoul National University, Republic of Korea |
| Notes | Trial Reg No: NCT01815905 |
| Trial name or title | Very Early Rehabiliation in SpEech (VERSE): the development of an Australian randomised controlled trial of aphasia therapy after stroke |
| Methods | 3‐arm prospective multicentre RCT |
| Participants | Inclusion criteria: acute stroke with resultant acute aphasia of any type and score < 93.7 of the Aphasia Quotient (no TIA, SAH or SDH), medical stability at recruitment, ability to maintain a wakeful alert state for 30 consecutive minutes within 14 d of stroke onset, normal or corrected hearing and vision Exclusion criteria: pre‐existing aphasia, patients who have suffered a head injury, have had or require neurosurgery, pre‐existing clinical diagnosis of dementia or major depression, concurrent progressive neurological disorders, patients unable to participate in English‐based therapy due to English being a second language |
| Interventions | 1. Usual care (ward‐based aphasia therapy at discretion of therapist likely to include non‐standardised aphasia therapy, counselling and patient/family education) likely to be 1 to 3 sessions of 30 min/week 2. Usual care plus (daily 1‐to‐1 ward‐based aphasia therapy; non‐standardised aphasia therapy, counselling, patient/family education) 20 sessions of 45‐60 min (minimum 3 to maximum 5 sessions per week) 3. Very Early Rehabiliation in Speech (VERSE) (daily 1‐to‐1 ward‐based prescribed aphasia therapy; standardised intervention prescribed by expert advisory committee to meet goals based on patient needs) 20 sessions of 45‐60 minutes (minimum 3 to maximum 5 sessions per week) SLT starts before day 14 post aphasia onset. 20 sessions |
| Outcomes | Primary outcome: Western Aphasia Battery Aphasia Quotient Score Secondary outcome: Western Aphasia Battery Aphasia Quotient Score, Discourse Analysis (correct information units), anxiety Depression Rating Score, Stroke and Aphasia Quality of Life (SAQoL), Resources Utilisation Questionnaire Data collection: baseline, 12 and 26 weeks poststroke. Blinded outcome assessment |
| Starting date | 23 September 2013 |
| Contact information | Dr Erin Godecke School of Psychology and Social Sciences, Edith Cowan University, Australia |
| Notes | Trial Reg No: ACTRN12613000776707 |
ABC: Aphasia Battery in Chinese; ADL: activities of daily living; ANELT: Amsterdam‐Nijmegen Everyday Language Test; AQ: Aphasia Quotient; BDAE: Boston Diagnostic Aphasia Examination; BNT: Boston Naming Test; CAT: Comprehensive Aphasia Test; CCRE: Centre for Clinical Research Excellence; CETI: Communicative Effectiveness Index; CIAT: constraint‐induced aphasia therapy; CIU: correct information unit; CT: computerised tomography; CVA: cerebrovascular accident; DTI: diffusion tensor imaging; FCP: Functional Communication Profile; fMRI: functional magnetic resonance imaging; NHS: National Health Service (UK); MCA: middle cerebral artery; MIT: melodic intonation therapy; MRI: magnetic resonance imaging; PALPA: Psycholinguistic Assessments of Language Processing in Aphasia; PACE: Promoting Aphasics' Communicative Effectiveness therapy; PGI: Patient Global Impression; RCT: randomised controlled trial; SAH: subarachnoid haemorrhage; SAQoL: Stroke and Aphasia Quality of Life Scale; SAT: Semantic Association Test; SDH: subdural haematoma; SLT: speech and language therapy; TIA: transient ischaemic attack; TOMs: Therapy Outcome Measures; UAT: unconstrained aphasia therapy; WAB: Western Aphasia Battery; WBIC: Wolfson Brain Imaging Centre.
Data and analyses
| Outcome or subgroup title | No. of studies | No. of participants | Statistical method | Effect size |
| 1 Functional communication Show forest plot | 10 | 376 | Std. Mean Difference (IV, Fixed, 95% CI) | 0.28 [0.06, 0.49] |
| Analysis 1.1 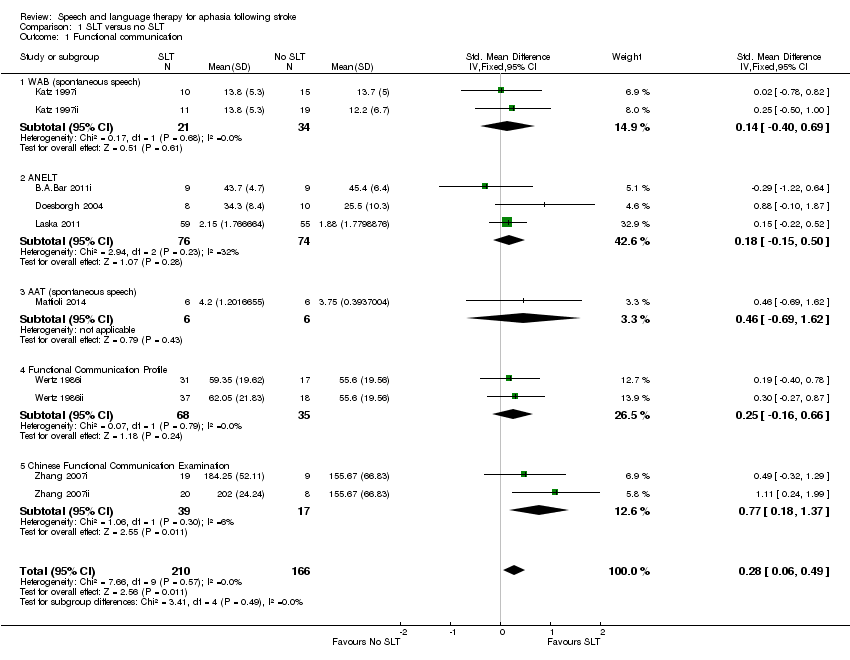 Comparison 1 SLT versus no SLT, Outcome 1 Functional communication. | ||||
| 1.1 WAB (spontaneous speech) | 2 | 55 | Std. Mean Difference (IV, Fixed, 95% CI) | 0.14 [‐0.40, 0.69] |
| 1.2 ANELT | 3 | 150 | Std. Mean Difference (IV, Fixed, 95% CI) | 0.18 [‐0.15, 0.50] |
| 1.3 AAT (spontaneous speech) | 1 | 12 | Std. Mean Difference (IV, Fixed, 95% CI) | 0.46 [‐0.69, 1.62] |
| 1.4 Functional Communication Profile | 2 | 103 | Std. Mean Difference (IV, Fixed, 95% CI) | 0.25 [‐0.16, 0.66] |
| 1.5 Chinese Functional Communication Examination | 2 | 56 | Std. Mean Difference (IV, Fixed, 95% CI) | 0.77 [0.18, 1.37] |
| 2 Receptive language: auditory comprehension Show forest plot | 10 | 399 | Std. Mean Difference (IV, Fixed, 95% CI) | 0.06 [‐0.15, 0.26] |
| Analysis 1.2  Comparison 1 SLT versus no SLT, Outcome 2 Receptive language: auditory comprehension. | ||||
| 2.1 Token Test | 4 | 148 | Std. Mean Difference (IV, Fixed, 95% CI) | 0.15 [‐0.19, 0.48] |
| 2.2 Aphasia Battery of Chinese | 2 | 56 | Std. Mean Difference (IV, Fixed, 95% CI) | 0.08 [‐0.49, 0.65] |
| 2.3 PICA subtest | 2 | 55 | Std. Mean Difference (IV, Fixed, 95% CI) | 0.15 [‐0.40, 0.69] |
| 2.4 Norsk Grunntest for Afasi | 1 | 114 | Std. Mean Difference (IV, Fixed, 95% CI) | ‐0.01 [‐0.38, 0.36] |
| 2.5 CAT (spoken sentence comprehension) | 1 | 26 | Std. Mean Difference (IV, Fixed, 95% CI) | ‐0.36 [‐1.13, 0.42] |
| 3 Receptive language: reading comprehension Show forest plot | 8 | 253 | Std. Mean Difference (IV, Fixed, 95% CI) | 0.29 [0.03, 0.55] |
| Analysis 1.3 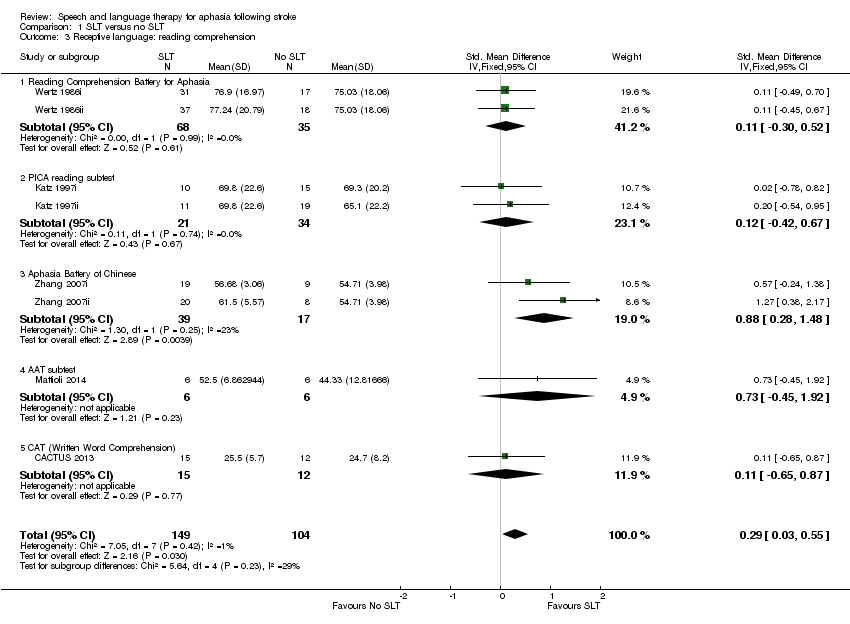 Comparison 1 SLT versus no SLT, Outcome 3 Receptive language: reading comprehension. | ||||
| 3.1 Reading Comprehension Battery for Aphasia | 2 | 103 | Std. Mean Difference (IV, Fixed, 95% CI) | 0.11 [‐0.30, 0.52] |
| 3.2 PICA reading subtest | 2 | 55 | Std. Mean Difference (IV, Fixed, 95% CI) | 0.12 [‐0.42, 0.67] |
| 3.3 Aphasia Battery of Chinese | 2 | 56 | Std. Mean Difference (IV, Fixed, 95% CI) | 0.88 [0.28, 1.48] |
| 3.4 AAT subtest | 1 | 12 | Std. Mean Difference (IV, Fixed, 95% CI) | 0.73 [‐0.45, 1.92] |
| 3.5 CAT (Written Word Comprehension) | 1 | 27 | Std. Mean Difference (IV, Fixed, 95% CI) | 0.11 [‐0.65, 0.87] |
| 4 Receptive language: other Show forest plot | 5 | 192 | Std. Mean Difference (IV, Random, 95% CI) | 1.23 [0.11, 2.36] |
| Analysis 1.4 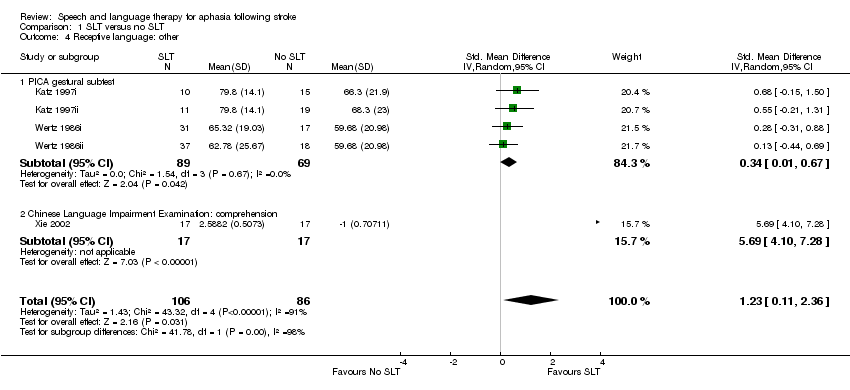 Comparison 1 SLT versus no SLT, Outcome 4 Receptive language: other. | ||||
| 4.1 PICA gestural subtest | 4 | 158 | Std. Mean Difference (IV, Random, 95% CI) | 0.34 [0.01, 0.67] |
| 4.2 Chinese Language Impairment Examination: comprehension | 1 | 34 | Std. Mean Difference (IV, Random, 95% CI) | 5.69 [4.10, 7.28] |
| 5 Expressive language: naming Show forest plot | 7 | 275 | Std. Mean Difference (IV, Fixed, 95% CI) | 0.14 [‐0.10, 0.38] |
| Analysis 1.5  Comparison 1 SLT versus no SLT, Outcome 5 Expressive language: naming. | ||||
| 5.1 Boston Naming Test | 1 | 18 | Std. Mean Difference (IV, Fixed, 95% CI) | ‐0.00 [‐0.93, 0.93] |
| 5.2 WAB Naming subtest | 2 | 55 | Std. Mean Difference (IV, Fixed, 95% CI) | 0.27 [‐0.27, 0.82] |
| 5.3 Norsk Grunntest for Afasi | 1 | 114 | Std. Mean Difference (IV, Fixed, 95% CI) | 0.02 [‐0.35, 0.39] |
| 5.4 AAT subtest | 1 | 12 | Std. Mean Difference (IV, Fixed, 95% CI) | 1.10 [‐0.15, 2.36] |
| 5.5 Object and Action Naming Battery (treated) | 1 | 28 | Std. Mean Difference (IV, Fixed, 95% CI) | ‐0.01 [‐0.75, 0.74] |
| 5.6 Naming accuracy (matched) | 1 | 48 | Std. Mean Difference (IV, Fixed, 95% CI) | 0.21 [‐0.36, 0.78] |
| 6 Expressive language: general Show forest plot | 7 | 248 | Std. Mean Difference (IV, Random, 95% CI) | 1.28 [0.38, 2.19] |
| Analysis 1.6  Comparison 1 SLT versus no SLT, Outcome 6 Expressive language: general. | ||||
| 6.1 PICA Verbal subtest | 4 | 158 | Std. Mean Difference (IV, Random, 95% CI) | 0.26 [‐0.07, 0.59] |
| 6.2 Aphasia Battery of Chinese (verbal presentation) | 2 | 56 | Std. Mean Difference (IV, Random, 95% CI) | 1.99 [1.03, 2.95] |
| 6.3 Chinese Language Impairment Examination | 1 | 34 | Std. Mean Difference (IV, Random, 95% CI) | 4.65 [3.29, 6.00] |
| 7 Expressive language: written Show forest plot | 8 | 253 | Std. Mean Difference (IV, Fixed, 95% CI) | 0.41 [0.14, 0.67] |
| Analysis 1.7 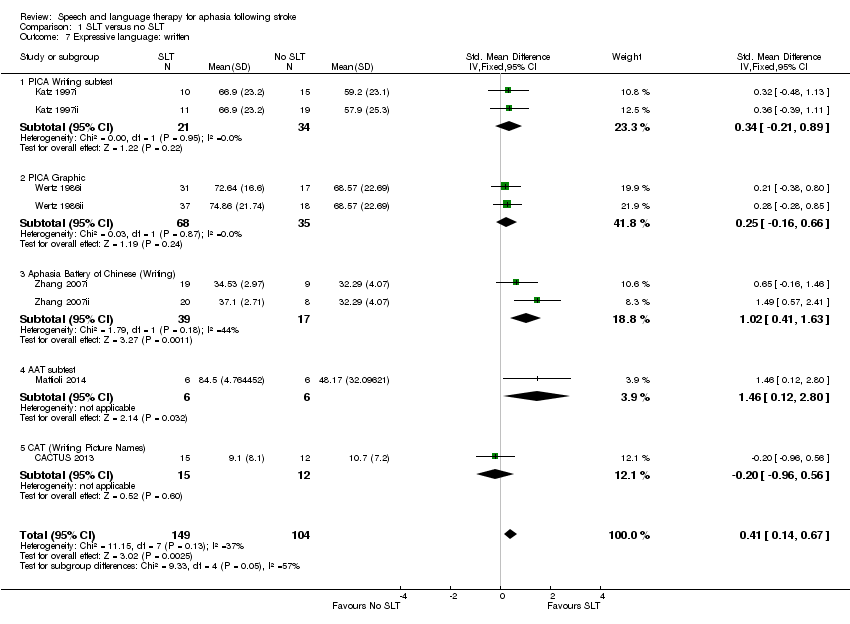 Comparison 1 SLT versus no SLT, Outcome 7 Expressive language: written. | ||||
| 7.1 PICA Writing subtest | 2 | 55 | Std. Mean Difference (IV, Fixed, 95% CI) | 0.34 [‐0.21, 0.89] |
| 7.2 PICA Graphic | 2 | 103 | Std. Mean Difference (IV, Fixed, 95% CI) | 0.25 [‐0.16, 0.66] |
| 7.3 Aphasia Battery of Chinese (Writing) | 2 | 56 | Std. Mean Difference (IV, Fixed, 95% CI) | 1.02 [0.41, 1.63] |
| 7.4 AAT subtest | 1 | 12 | Std. Mean Difference (IV, Fixed, 95% CI) | 1.46 [0.12, 2.80] |
| 7.5 CAT (Writing Picture Names) | 1 | 27 | Std. Mean Difference (IV, Fixed, 95% CI) | ‐0.20 [‐0.96, 0.56] |
| 8 Expressive language: written copying Show forest plot | 2 | Mean Difference (IV, Fixed, 95% CI) | Subtotals only | |
| Analysis 1.8 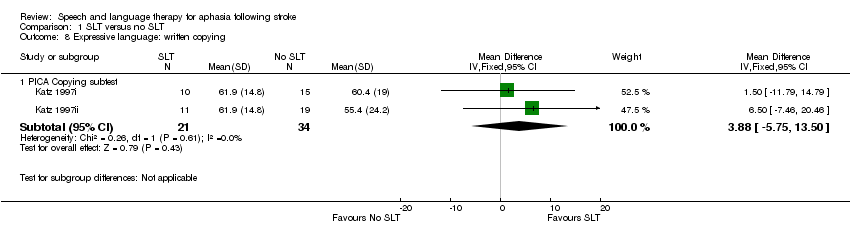 Comparison 1 SLT versus no SLT, Outcome 8 Expressive language: written copying. | ||||
| 8.1 PICA Copying subtest | 2 | 55 | Mean Difference (IV, Fixed, 95% CI) | 3.88 [‐5.75, 13.50] |
| 9 Expressive language: repetition Show forest plot | 5 | 229 | Std. Mean Difference (IV, Fixed, 95% CI) | 0.12 [‐0.14, 0.38] |
| Analysis 1.9 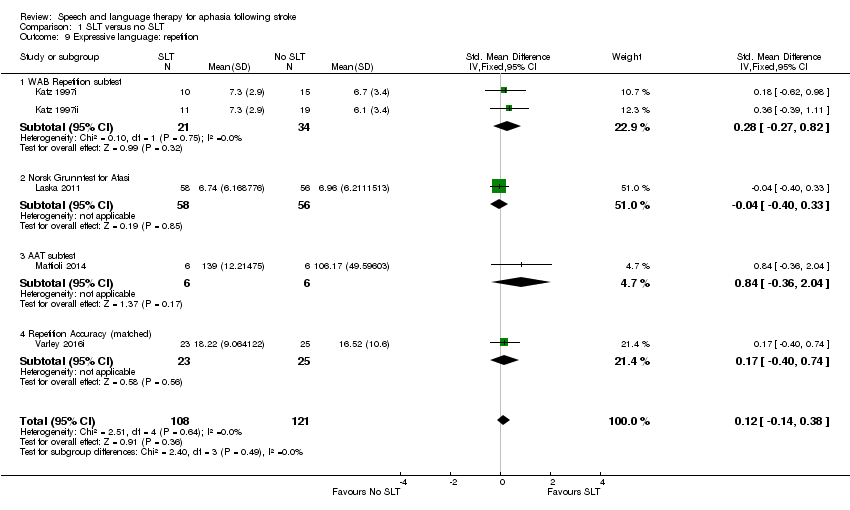 Comparison 1 SLT versus no SLT, Outcome 9 Expressive language: repetition. | ||||
| 9.1 WAB Repetition subtest | 2 | 55 | Std. Mean Difference (IV, Fixed, 95% CI) | 0.28 [‐0.27, 0.82] |
| 9.2 Norsk Grunntest for Afasi | 1 | 114 | Std. Mean Difference (IV, Fixed, 95% CI) | ‐0.04 [‐0.40, 0.33] |
| 9.3 AAT subtest | 1 | 12 | Std. Mean Difference (IV, Fixed, 95% CI) | 0.84 [‐0.36, 2.04] |
| 9.4 Repetition Accuracy (matched) | 1 | 48 | Std. Mean Difference (IV, Fixed, 95% CI) | 0.17 [‐0.40, 0.74] |
| 10 Expressive language: fluency Show forest plot | 1 | Mean Difference (IV, Fixed, 95% CI) | Totals not selected | |
| Analysis 1.10 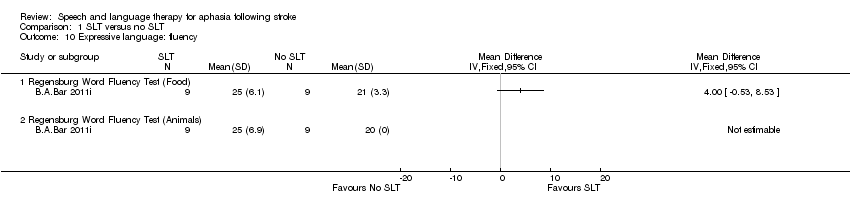 Comparison 1 SLT versus no SLT, Outcome 10 Expressive language: fluency. | ||||
| 10.1 Regensburg Word Fluency Test (Food) | 1 | Mean Difference (IV, Fixed, 95% CI) | 0.0 [0.0, 0.0] | |
| 10.2 Regensburg Word Fluency Test (Animals) | 1 | Mean Difference (IV, Fixed, 95% CI) | 0.0 [0.0, 0.0] | |
| 11 Severity of impairment: Aphasia Battery Score (+ PICA) Show forest plot | 11 | 593 | Std. Mean Difference (IV, Random, 95% CI) | 0.55 [‐0.14, 1.25] |
| Analysis 1.11  Comparison 1 SLT versus no SLT, Outcome 11 Severity of impairment: Aphasia Battery Score (+ PICA). | ||||
| 11.1 Aphasia Quotient (CRRCAE) | 2 | 84 | Std. Mean Difference (IV, Random, 95% CI) | 0.02 [‐0.43, 0.47] |
| 11.2 Porch Index of Communicative Ability | 4 | 165 | Std. Mean Difference (IV, Random, 95% CI) | 0.26 [‐0.07, 0.58] |
| 11.3 BDAE (Chinese) | 1 | 36 | Std. Mean Difference (IV, Random, 95% CI) | 0.52 [‐0.15, 1.18] |
| 11.4 Aphasia Battery of Chinese (ABC) | 2 | 56 | Std. Mean Difference (IV, Random, 95% CI) | 0.23 [‐0.34, 0.80] |
| 11.5 Norsk Grunntest for Afasi (Coefficient) | 1 | 114 | Std. Mean Difference (IV, Random, 95% CI) | 0.03 [‐0.34, 0.40] |
| 11.6 Chinese Aphasia Measurement | 1 | 138 | Std. Mean Difference (IV, Random, 95% CI) | 3.84 [3.25, 4.43] |
| 12 Mood: MAACL Show forest plot | 1 | Mean Difference (IV, Fixed, 95% CI) | Totals not selected | |
| Analysis 1.12 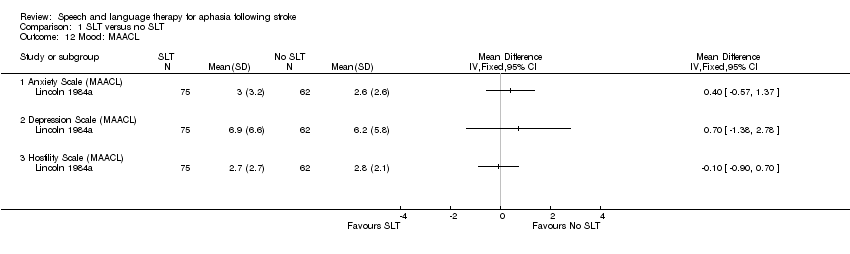 Comparison 1 SLT versus no SLT, Outcome 12 Mood: MAACL. | ||||
| 12.1 Anxiety Scale (MAACL) | 1 | Mean Difference (IV, Fixed, 95% CI) | 0.0 [0.0, 0.0] | |
| 12.2 Depression Scale (MAACL) | 1 | Mean Difference (IV, Fixed, 95% CI) | 0.0 [0.0, 0.0] | |
| 12.3 Hostility Scale (MAACL) | 1 | Mean Difference (IV, Fixed, 95% CI) | 0.0 [0.0, 0.0] | |
| 13 Economic outcomes Show forest plot | 1 | Std. Mean Difference (IV, Random, 95% CI) | Totals not selected | |
| Analysis 1.13  Comparison 1 SLT versus no SLT, Outcome 13 Economic outcomes. | ||||
| 13.1 Costs per month (GBP) | 1 | Std. Mean Difference (IV, Random, 95% CI) | 0.0 [0.0, 0.0] | |
| 13.2 EQ‐5D | 1 | Std. Mean Difference (IV, Random, 95% CI) | 0.0 [0.0, 0.0] | |
| 13.3 EQ‐5D VAS | 1 | Std. Mean Difference (IV, Random, 95% CI) | 0.0 [0.0, 0.0] | |
| 14 Number of dropouts (any reason) Show forest plot | 13 | 921 | Odds Ratio (M‐H, Fixed, 95% CI) | 0.92 [0.66, 1.28] |
| Analysis 1.14 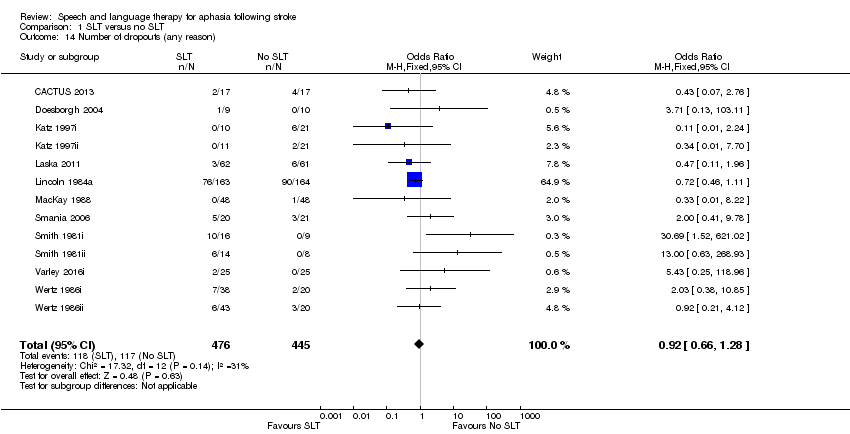 Comparison 1 SLT versus no SLT, Outcome 14 Number of dropouts (any reason). | ||||
| 15 Adherence to allocated intervention Show forest plot | 4 | 248 | Odds Ratio (M‐H, Fixed, 95% CI) | 0.75 [0.30, 1.85] |
| Analysis 1.15 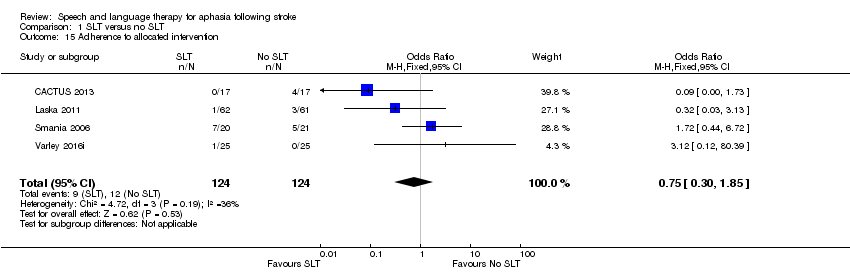 Comparison 1 SLT versus no SLT, Outcome 15 Adherence to allocated intervention. | ||||
| Outcome or subgroup title | No. of studies | No. of participants | Statistical method | Effect size |
| 1 Functional communication Show forest plot | 2 | 111 | Std. Mean Difference (IV, Random, 95% CI) | 0.19 [‐0.80, 1.18] |
| Analysis 2.1  Comparison 2 SLT versus no SLT (follow‐up data), Outcome 1 Functional communication. | ||||
| 1.1 ANELT (6 month follow‐up) | 1 | 99 | Std. Mean Difference (IV, Random, 95% CI) | ‐0.18 [‐0.57, 0.22] |
| 1.2 AAT (spontaneous speech; 6 month follow‐up) | 1 | 12 | Std. Mean Difference (IV, Random, 95% CI) | 0.88 [‐0.33, 2.09] |
| 2 Receptive language: auditory comprehension Show forest plot | 2 | 111 | Mean Difference (IV, Fixed, 95% CI) | 1.38 [‐1.39, 4.15] |
| Analysis 2.2  Comparison 2 SLT versus no SLT (follow‐up data), Outcome 2 Receptive language: auditory comprehension. | ||||
| 2.1 Norsk Grunntest for Afasi (6 month follow‐up) | 1 | 99 | Mean Difference (IV, Fixed, 95% CI) | 0.12 [‐3.25, 3.49] |
| 2.2 AAT subtest (6 months follow‐up) | 1 | 12 | Mean Difference (IV, Fixed, 95% CI) | 4.0 [‐0.85, 8.85] |
| 3 Receptive language: reading comprehension Show forest plot | 1 | Mean Difference (IV, Fixed, 95% CI) | Totals not selected | |
| Analysis 2.3  Comparison 2 SLT versus no SLT (follow‐up data), Outcome 3 Receptive language: reading comprehension. | ||||
| 3.1 AAT subtest (6 month follow‐up) | 1 | Mean Difference (IV, Fixed, 95% CI) | 0.0 [0.0, 0.0] | |
| 4 Expressive language: naming Show forest plot | 3 | 135 | Std. Mean Difference (IV, Random, 95% CI) | 0.07 [‐0.59, 0.73] |
| Analysis 2.4  Comparison 2 SLT versus no SLT (follow‐up data), Outcome 4 Expressive language: naming. | ||||
| 4.1 Norsk Grunntest for Afasi (6 month follow‐up) | 1 | 99 | Std. Mean Difference (IV, Random, 95% CI) | ‐0.06 [‐0.45, 0.33] |
| 4.2 AAT subtest (6 month follow‐up) | 1 | 12 | Std. Mean Difference (IV, Random, 95% CI) | 1.21 [‐0.06, 2.49] |
| 4.3 Object and Action Naming Battery (treated; 3 month follow‐up) | 1 | 24 | Std. Mean Difference (IV, Random, 95% CI) | ‐0.39 [‐1.20, 0.42] |
| 5 Expressive language: written Show forest plot | 1 | Std. Mean Difference (IV, Fixed, 95% CI) | Totals not selected | |
| Analysis 2.5  Comparison 2 SLT versus no SLT (follow‐up data), Outcome 5 Expressive language: written. | ||||
| 5.1 AAT subtest (6 month follow‐up) | 1 | Std. Mean Difference (IV, Fixed, 95% CI) | 0.0 [0.0, 0.0] | |
| 6 Expressive language: repetition Show forest plot | 2 | 110 | Mean Difference (IV, Fixed, 95% CI) | ‐0.29 [‐2.62, 2.03] |
| Analysis 2.6  Comparison 2 SLT versus no SLT (follow‐up data), Outcome 6 Expressive language: repetition. | ||||
| 6.1 Norsk Grunntest for Afasi (6 month follow‐up) | 1 | 98 | Mean Difference (IV, Fixed, 95% CI) | ‐0.40 [‐2.73, 1.93] |
| 6.2 AAT subtest (6 month follow‐up) | 1 | 12 | Mean Difference (IV, Fixed, 95% CI) | 26.00 [‐10.49, 62.49] |
| 7 Severity of impairment: Aphasia Battery Score Show forest plot | 3 | 183 | Std. Mean Difference (IV, Random, 95% CI) | 0.37 [‐0.29, 1.04] |
| Analysis 2.7  Comparison 2 SLT versus no SLT (follow‐up data), Outcome 7 Severity of impairment: Aphasia Battery Score. | ||||
| 7.1 Norsk Grunntest for Afasi (6 month follow‐up) | 1 | 99 | Std. Mean Difference (IV, Random, 95% CI) | ‐0.03 [‐0.42, 0.37] |
| 7.2 Aphasia Quotient (CRRCAE) 3 month follow‐up | 2 | 84 | Std. Mean Difference (IV, Random, 95% CI) | 0.62 [‐0.34, 1.58] |
| 8 Economic outcomes Show forest plot | 1 | Std. Mean Difference (IV, Fixed, 95% CI) | Totals not selected | |
| Analysis 2.8  Comparison 2 SLT versus no SLT (follow‐up data), Outcome 8 Economic outcomes. | ||||
| 8.1 EQ‐5D | 1 | Std. Mean Difference (IV, Fixed, 95% CI) | 0.0 [0.0, 0.0] | |
| 8.2 EQ‐5D VAS | 1 | Std. Mean Difference (IV, Fixed, 95% CI) | 0.0 [0.0, 0.0] | |
| 9 Number of dropouts (any reason) Show forest plot | 6 | 322 | Odds Ratio (M‐H, Fixed, 95% CI) | 0.73 [0.38, 1.39] |
| Analysis 2.9 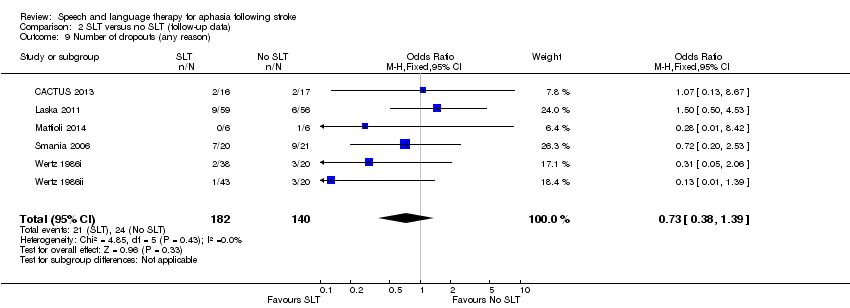 Comparison 2 SLT versus no SLT (follow‐up data), Outcome 9 Number of dropouts (any reason). | ||||
| Outcome or subgroup title | No. of studies | No. of participants | Statistical method | Effect size |
| 1 Functional communication Show forest plot | 4 | Std. Mean Difference (IV, Random, 95% CI) | Subtotals only | |
| Analysis 3.1  Comparison 3 SLT versus social support and stimulation, Outcome 1 Functional communication. | ||||
| 1.1 Functional Communication Profile | 1 | 96 | Std. Mean Difference (IV, Random, 95% CI) | ‐0.10 [‐0.50, 0.30] |
| 1.2 TOMs | 1 | 136 | Std. Mean Difference (IV, Random, 95% CI) | 0.13 [‐0.20, 0.47] |
| 1.3 Discourse conversation: content words per turn | 2 | 15 | Std. Mean Difference (IV, Random, 95% CI) | ‐0.14 [‐1.22, 0.94] |
| 2 Receptive language: auditory comprehension Show forest plot | 2 | Mean Difference (IV, Fixed, 95% CI) | Totals not selected | |
| Analysis 3.2  Comparison 3 SLT versus social support and stimulation, Outcome 2 Receptive language: auditory comprehension. | ||||
| 2.1 PCB (sentence comprehension) | 1 | Mean Difference (IV, Fixed, 95% CI) | 0.0 [0.0, 0.0] | |
| 2.2 PCB (picture comprehension) | 1 | Mean Difference (IV, Fixed, 95% CI) | 0.0 [0.0, 0.0] | |
| 2.3 Token Test | 1 | Mean Difference (IV, Fixed, 95% CI) | 0.0 [0.0, 0.0] | |
| 3 Receptive language: other Show forest plot | 1 | Mean Difference (IV, Fixed, 95% CI) | Totals not selected | |
| Analysis 3.3  Comparison 3 SLT versus social support and stimulation, Outcome 3 Receptive language: other. | ||||
| 3.1 PICA gestural subtest | 1 | Mean Difference (IV, Fixed, 95% CI) | 0.0 [0.0, 0.0] | |
| 4 Expressive language:naming Show forest plot | 3 | 33 | Std. Mean Difference (IV, Random, 95% CI) | 1.24 [‐1.70, 4.18] |
| Analysis 3.4 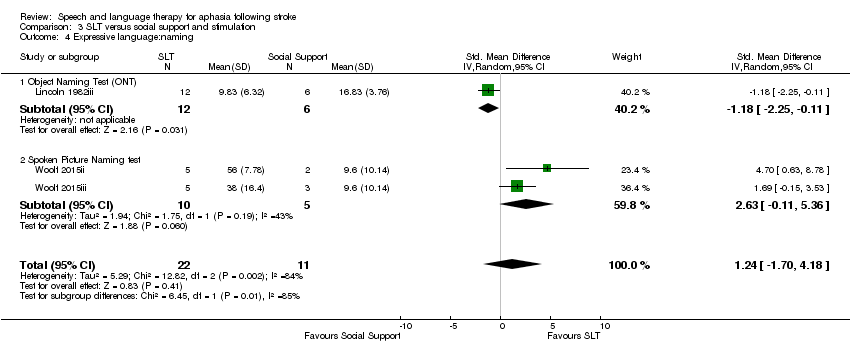 Comparison 3 SLT versus social support and stimulation, Outcome 4 Expressive language:naming. | ||||
| 4.1 Object Naming Test (ONT) | 1 | 18 | Std. Mean Difference (IV, Random, 95% CI) | ‐1.18 [‐2.25, ‐0.11] |
| 4.2 Spoken Picture Naming test | 2 | 15 | Std. Mean Difference (IV, Random, 95% CI) | 2.63 [‐0.11, 5.36] |
| 5 Expressive language: sentences Show forest plot | 1 | Mean Difference (IV, Fixed, 95% CI) | Totals not selected | |
| Analysis 3.5 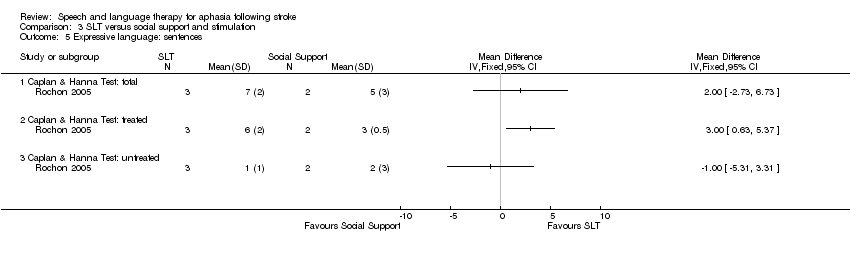 Comparison 3 SLT versus social support and stimulation, Outcome 5 Expressive language: sentences. | ||||
| 5.1 Caplan & Hanna Test: total | 1 | Mean Difference (IV, Fixed, 95% CI) | 0.0 [0.0, 0.0] | |
| 5.2 Caplan & Hanna Test: treated | 1 | Mean Difference (IV, Fixed, 95% CI) | 0.0 [0.0, 0.0] | |
| 5.3 Caplan & Hanna Test: untreated | 1 | Mean Difference (IV, Fixed, 95% CI) | 0.0 [0.0, 0.0] | |
| 6 Expressive language: picture description Show forest plot | 2 | Std. Mean Difference (IV, Fixed, 95% CI) | Subtotals only | |
| Analysis 3.6  Comparison 3 SLT versus social support and stimulation, Outcome 6 Expressive language: picture description. | ||||
| 6.1 Picture description | 2 | 23 | Std. Mean Difference (IV, Fixed, 95% CI) | 0.26 [‐0.62, 1.15] |
| 6.2 Picture description with structure modelling: treated items | 1 | 5 | Std. Mean Difference (IV, Fixed, 95% CI) | 0.45 [‐1.44, 2.33] |
| 6.3 Picture description with structure modelling: untreated items | 1 | 5 | Std. Mean Difference (IV, Fixed, 95% CI) | 0.41 [‐1.46, 2.28] |
| 7 Expressive language: overall spoken Show forest plot | 1 | Mean Difference (IV, Fixed, 95% CI) | Totals not selected | |
| Analysis 3.7 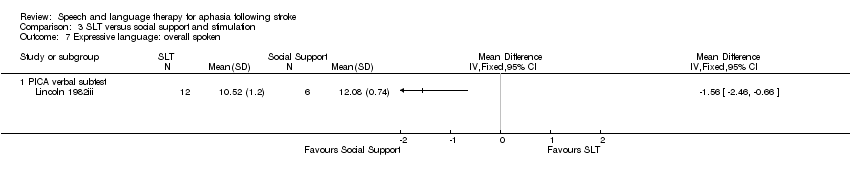 Comparison 3 SLT versus social support and stimulation, Outcome 7 Expressive language: overall spoken. | ||||
| 7.1 PICA verbal subtest | 1 | Mean Difference (IV, Fixed, 95% CI) | 0.0 [0.0, 0.0] | |
| 8 Expressive language: written Show forest plot | 1 | Mean Difference (IV, Fixed, 95% CI) | Totals not selected | |
| Analysis 3.8 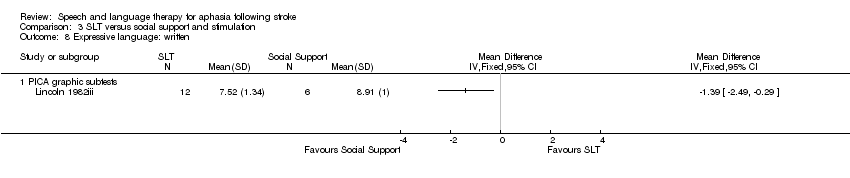 Comparison 3 SLT versus social support and stimulation, Outcome 8 Expressive language: written. | ||||
| 8.1 PICA graphic subtests | 1 | Mean Difference (IV, Fixed, 95% CI) | 0.0 [0.0, 0.0] | |
| 9 Expressive language: fluency Show forest plot | 1 | Std. Mean Difference (IV, Random, 95% CI) | Totals not selected | |
| Analysis 3.9 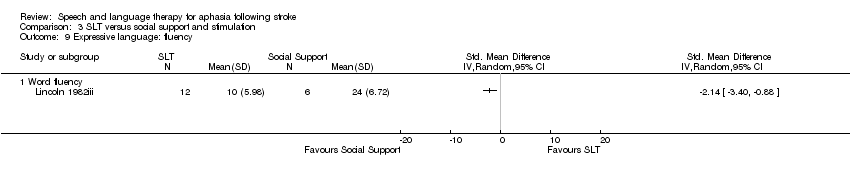 Comparison 3 SLT versus social support and stimulation, Outcome 9 Expressive language: fluency. | ||||
| 9.1 Word fluency | 1 | Std. Mean Difference (IV, Random, 95% CI) | 0.0 [0.0, 0.0] | |
| 10 Severity of impairment: Aphasia Battery Score Show forest plot | 1 | Mean Difference (IV, Fixed, 95% CI) | Totals not selected | |
| Analysis 3.10 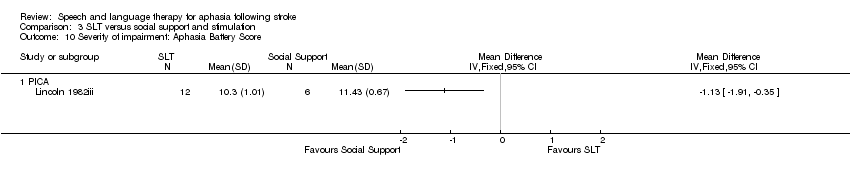 Comparison 3 SLT versus social support and stimulation, Outcome 10 Severity of impairment: Aphasia Battery Score. | ||||
| 10.1 PICA | 1 | Mean Difference (IV, Fixed, 95% CI) | 0.0 [0.0, 0.0] | |
| 11 Psychosocial impact Show forest plot | 1 | Std. Mean Difference (IV, Fixed, 95% CI) | Totals not selected | |
| Analysis 3.11  Comparison 3 SLT versus social support and stimulation, Outcome 11 Psychosocial impact. | ||||
| 11.1 COAST | 1 | Std. Mean Difference (IV, Fixed, 95% CI) | 0.0 [0.0, 0.0] | |
| 11.2 Carer COAST | 1 | Std. Mean Difference (IV, Fixed, 95% CI) | 0.0 [0.0, 0.0] | |
| 12 Number of dropouts for any reason Show forest plot | 5 | 413 | Odds Ratio (M‐H, Fixed, 95% CI) | 0.51 [0.32, 0.81] |
| Analysis 3.12  Comparison 3 SLT versus social support and stimulation, Outcome 12 Number of dropouts for any reason. | ||||
| 13 Adherence to allocated intervention Show forest plot | 5 | 409 | Odds Ratio (M‐H, Fixed, 95% CI) | 0.18 [0.09, 0.37] |
| Analysis 3.13  Comparison 3 SLT versus social support and stimulation, Outcome 13 Adherence to allocated intervention. | ||||
| 14 Economic outcomes Show forest plot | 1 | Mean Difference (IV, Fixed, 95% CI) | Totals not selected | |
| Analysis 3.14  Comparison 3 SLT versus social support and stimulation, Outcome 14 Economic outcomes. | ||||
| 14.1 Cost data | 1 | Mean Difference (IV, Fixed, 95% CI) | 0.0 [0.0, 0.0] | |
| 14.2 Utility data | 1 | Mean Difference (IV, Fixed, 95% CI) | 0.0 [0.0, 0.0] | |
| Outcome or subgroup title | No. of studies | No. of participants | Statistical method | Effect size |
| 1 Functional communication Show forest plot | 2 | 84 | Mean Difference (IV, Random, 95% CI) | 11.75 [4.09, 19.40] |
| Analysis 4.1 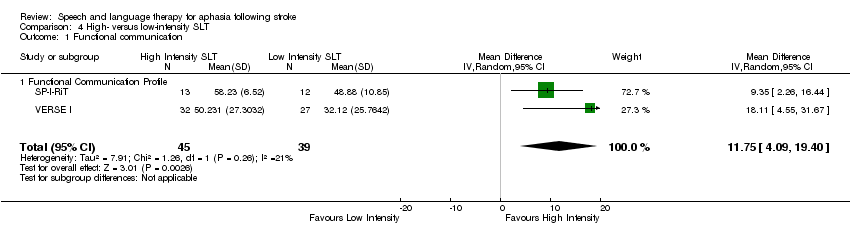 Comparison 4 High‐ versus low‐intensity SLT, Outcome 1 Functional communication. | ||||
| 1.1 Functional Communication Profile | 2 | 84 | Mean Difference (IV, Random, 95% CI) | 11.75 [4.09, 19.40] |
| 2 Receptive language: auditory comprehension Show forest plot | 2 | 42 | Std. Mean Difference (IV, Random, 95% CI) | 0.61 [‐0.81, 2.03] |
| Analysis 4.2 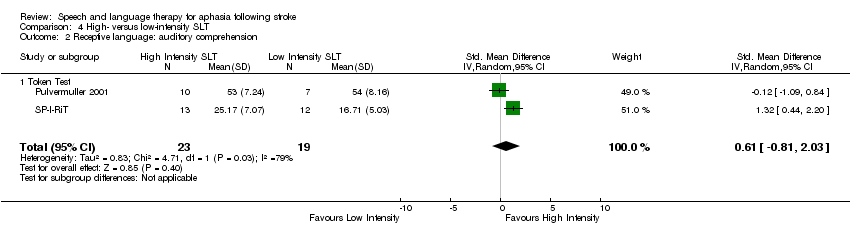 Comparison 4 High‐ versus low‐intensity SLT, Outcome 2 Receptive language: auditory comprehension. | ||||
| 2.1 Token Test | 2 | 42 | Std. Mean Difference (IV, Random, 95% CI) | 0.61 [‐0.81, 2.03] |
| 3 Receptive language: reading comprehension Show forest plot | 1 | Mean Difference (IV, Fixed, 95% CI) | Totals not selected | |
| Analysis 4.3  Comparison 4 High‐ versus low‐intensity SLT, Outcome 3 Receptive language: reading comprehension. | ||||
| 3.1 AAT (Portuguese version) | 1 | Mean Difference (IV, Fixed, 95% CI) | 0.0 [0.0, 0.0] | |
| 4 Expressive language: naming Show forest plot | 2 | 42 | Std. Mean Difference (IV, Random, 95% CI) | 0.23 [‐0.38, 0.84] |
| Analysis 4.4  Comparison 4 High‐ versus low‐intensity SLT, Outcome 4 Expressive language: naming. | ||||
| 4.1 AAT naming subtest | 1 | 17 | Std. Mean Difference (IV, Random, 95% CI) | 0.34 [‐0.64, 1.31] |
| 4.2 Lisbon Aphasia Assessment Battery | 1 | 25 | Std. Mean Difference (IV, Random, 95% CI) | 0.16 [‐0.62, 0.95] |
| 5 Expressive language: written Show forest plot | 1 | Mean Difference (IV, Fixed, 95% CI) | Totals not selected | |
| Analysis 4.5  Comparison 4 High‐ versus low‐intensity SLT, Outcome 5 Expressive language: written. | ||||
| 5.1 AAT (Portuguese version) (writing to dictation) | 1 | Mean Difference (IV, Fixed, 95% CI) | 0.0 [0.0, 0.0] | |
| 6 Expressive language: repetition Show forest plot | 2 | 42 | Std. Mean Difference (IV, Random, 95% CI) | ‐0.05 [‐0.66, 0.56] |
| Analysis 4.6  Comparison 4 High‐ versus low‐intensity SLT, Outcome 6 Expressive language: repetition. | ||||
| 6.1 AAT repetition subtest | 1 | 17 | Std. Mean Difference (IV, Random, 95% CI) | ‐0.10 [‐1.07, 0.87] |
| 6.2 Lisbon Aphasia Assessment Battery | 1 | 25 | Std. Mean Difference (IV, Random, 95% CI) | ‐0.02 [‐0.80, 0.77] |
| 7 Expressive language: fluency Show forest plot | 1 | Mean Difference (IV, Fixed, 95% CI) | Totals not selected | |
| Analysis 4.7  Comparison 4 High‐ versus low‐intensity SLT, Outcome 7 Expressive language: fluency. | ||||
| 7.1 Lisbon Aphasia Assessment Battery | 1 | Mean Difference (IV, Fixed, 95% CI) | 0.0 [0.0, 0.0] | |
| 8 Severity of impairment: Aphasia Battery Score Show forest plot | 5 | 187 | Std. Mean Difference (IV, Random, 95% CI) | 0.38 [0.07, 0.69] |
| Analysis 4.8  Comparison 4 High‐ versus low‐intensity SLT, Outcome 8 Severity of impairment: Aphasia Battery Score. | ||||
| 8.1 Aphasia Quotient (WAB) | 3 | 145 | Std. Mean Difference (IV, Random, 95% CI) | 0.35 [‐0.16, 0.85] |
| 8.2 AAT overall | 1 | 17 | Std. Mean Difference (IV, Random, 95% CI) | 0.23 [‐0.74, 1.20] |
| 8.3 Boston Diagnostic Aphasia Examination (10 weeks) | 1 | 25 | Std. Mean Difference (IV, Random, 95% CI) | 0.59 [‐0.22, 1.39] |
| 9 Mood Show forest plot | 1 | Mean Difference (IV, Fixed, 95% CI) | Totals not selected | |
| Analysis 4.9 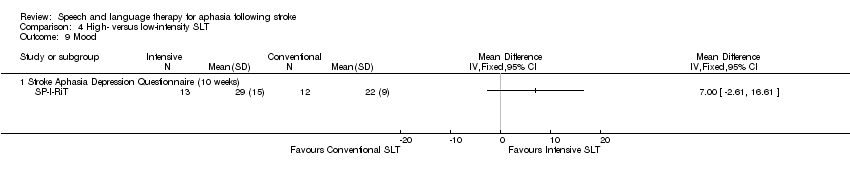 Comparison 4 High‐ versus low‐intensity SLT, Outcome 9 Mood. | ||||
| 9.1 Stroke Aphasia Depression Questionnaire (10 weeks) | 1 | Mean Difference (IV, Fixed, 95% CI) | 0.0 [0.0, 0.0] | |
| 10 Number of dropouts for any reason Show forest plot | 4 | 216 | Odds Ratio (M‐H, Fixed, 95% CI) | 2.35 [1.20, 4.60] |
| Analysis 4.10  Comparison 4 High‐ versus low‐intensity SLT, Outcome 10 Number of dropouts for any reason. | ||||
| 11 Adherence to allocated intervention Show forest plot | 3 | 196 | Odds Ratio (M‐H, Fixed, 95% CI) | 4.63 [0.96, 22.40] |
| Analysis 4.11  Comparison 4 High‐ versus low‐intensity SLT, Outcome 11 Adherence to allocated intervention. | ||||
| Outcome or subgroup title | No. of studies | No. of participants | Statistical method | Effect size |
| 1 Functional communication Show forest plot | 3 | Std. Mean Difference (IV, Random, 95% CI) | Subtotals only | |
| Analysis 5.1 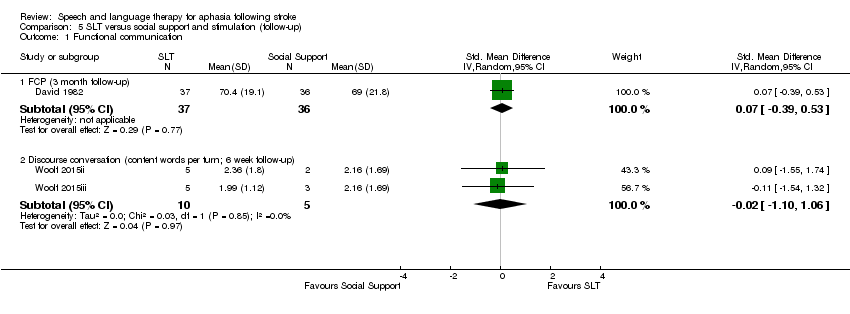 Comparison 5 SLT versus social support and stimulation (follow‐up), Outcome 1 Functional communication. | ||||
| 1.1 FCP (3 month follow‐up) | 1 | 73 | Std. Mean Difference (IV, Random, 95% CI) | 0.07 [‐0.39, 0.53] |
| 1.2 Discourse conversation (content words per turn; 6 week follow‐up) | 2 | 15 | Std. Mean Difference (IV, Random, 95% CI) | ‐0.02 [‐1.10, 1.06] |
| 2 Expressive language: single words (6 week follow‐up) Show forest plot | 2 | 15 | Std. Mean Difference (IV, Random, 95% CI) | 2.25 [0.18, 4.32] |
| Analysis 5.2  Comparison 5 SLT versus social support and stimulation (follow‐up), Outcome 2 Expressive language: single words (6 week follow‐up). | ||||
| 2.1 Spoken Picture Naming test | 2 | 15 | Std. Mean Difference (IV, Random, 95% CI) | 2.25 [0.18, 4.32] |
| Outcome or subgroup title | No. of studies | No. of participants | Statistical method | Effect size |
| 1 Functional communication Show forest plot | 2 | Std. Mean Difference (IV, Random, 95% CI) | Subtotals only | |
| Analysis 6.1  Comparison 6 High‐ versus low‐intensity SLT (follow‐up), Outcome 1 Functional communication. | ||||
| 1.1 Functional Communication Profile (40 weeks) | 2 | 77 | Std. Mean Difference (IV, Random, 95% CI) | 0.53 [0.07, 0.99] |
| 1.2 Discourse Analysis (6 months) | 1 | 59 | Std. Mean Difference (IV, Random, 95% CI) | 0.20 [‐0.31, 0.71] |
| 1.3 Functional Communication Profile (12 months) | 1 | 14 | Std. Mean Difference (IV, Random, 95% CI) | 0.12 [‐0.94, 1.18] |
| 2 Receptive language Show forest plot | 1 | Std. Mean Difference (IV, Random, 95% CI) | Subtotals only | |
| Analysis 6.2 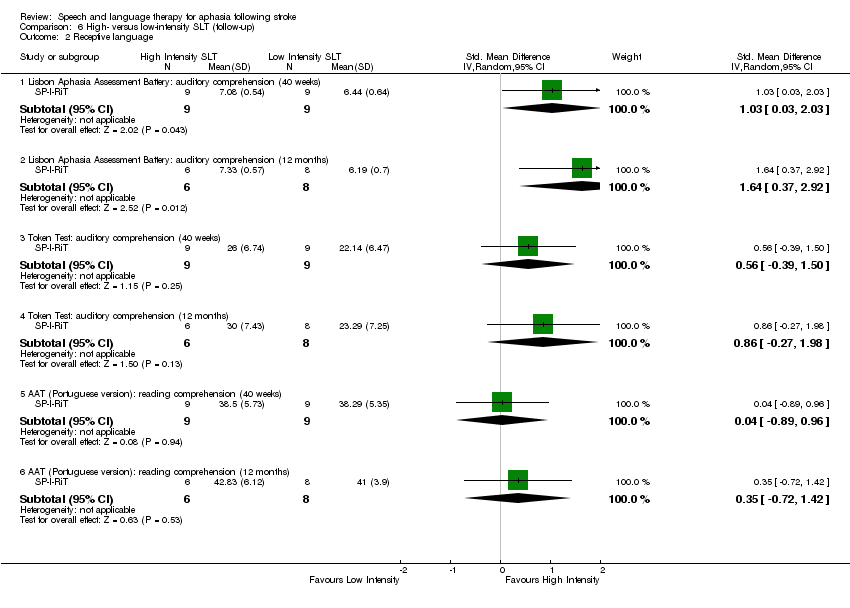 Comparison 6 High‐ versus low‐intensity SLT (follow‐up), Outcome 2 Receptive language. | ||||
| 2.1 Lisbon Aphasia Assessment Battery: auditory comprehension (40 weeks) | 1 | 18 | Std. Mean Difference (IV, Random, 95% CI) | 1.03 [0.03, 2.03] |
| 2.2 Lisbon Aphasia Assessment Battery: auditory comprehension (12 months) | 1 | 14 | Std. Mean Difference (IV, Random, 95% CI) | 1.64 [0.37, 2.92] |
| 2.3 Token Test: auditory comprehension (40 weeks) | 1 | 18 | Std. Mean Difference (IV, Random, 95% CI) | 0.56 [‐0.39, 1.50] |
| 2.4 Token Test: auditory comprehension (12 months) | 1 | 14 | Std. Mean Difference (IV, Random, 95% CI) | 0.86 [‐0.27, 1.98] |
| 2.5 AAT (Portuguese version): reading comprehension (40 weeks) | 1 | 18 | Std. Mean Difference (IV, Random, 95% CI) | 0.04 [‐0.89, 0.96] |
| 2.6 AAT (Portuguese version): reading comprehension (12 months) | 1 | 14 | Std. Mean Difference (IV, Random, 95% CI) | 0.35 [‐0.72, 1.42] |
| 3 Expressive language Show forest plot | 1 | Std. Mean Difference (IV, Random, 95% CI) | Totals not selected | |
| Analysis 6.3  Comparison 6 High‐ versus low‐intensity SLT (follow‐up), Outcome 3 Expressive language. | ||||
| 3.1 Naming (50 weeks) | 1 | Std. Mean Difference (IV, Random, 95% CI) | 0.0 [0.0, 0.0] | |
| 3.2 Naming (62 weeks) | 1 | Std. Mean Difference (IV, Random, 95% CI) | 0.0 [0.0, 0.0] | |
| 3.3 Writing to dictation (50 weeks) | 1 | Std. Mean Difference (IV, Random, 95% CI) | 0.0 [0.0, 0.0] | |
| 3.4 Writing to dictation (62 weeks) | 1 | Std. Mean Difference (IV, Random, 95% CI) | 0.0 [0.0, 0.0] | |
| 3.5 Repetition (50 weeks) | 1 | Std. Mean Difference (IV, Random, 95% CI) | 0.0 [0.0, 0.0] | |
| 3.6 Repetition (62 weeks) | 1 | Std. Mean Difference (IV, Random, 95% CI) | 0.0 [0.0, 0.0] | |
| 3.7 Fluency (50 weeks) | 1 | Std. Mean Difference (IV, Random, 95% CI) | 0.0 [0.0, 0.0] | |
| 3.8 Fluency (62 weeks) | 1 | Std. Mean Difference (IV, Random, 95% CI) | 0.0 [0.0, 0.0] | |
| 4 Severity of impairment: Aphasia Battery Score Show forest plot | 3 | 143 | Std. Mean Difference (IV, Random, 95% CI) | 0.37 [‐0.03, 0.77] |
| Analysis 6.4  Comparison 6 High‐ versus low‐intensity SLT (follow‐up), Outcome 4 Severity of impairment: Aphasia Battery Score. | ||||
| 4.1 Aphasia Quotient (WAB) | 2 | 125 | Std. Mean Difference (IV, Random, 95% CI) | 0.29 [‐0.16, 0.74] |
| 4.2 Boston Diagnostic Aphasia Examination (50 weeks) | 1 | 18 | Std. Mean Difference (IV, Random, 95% CI) | 0.83 [‐0.14, 1.81] |
| 5 Mood Show forest plot | 1 | Mean Difference (IV, Fixed, 95% CI) | Totals not selected | |
| Analysis 6.5 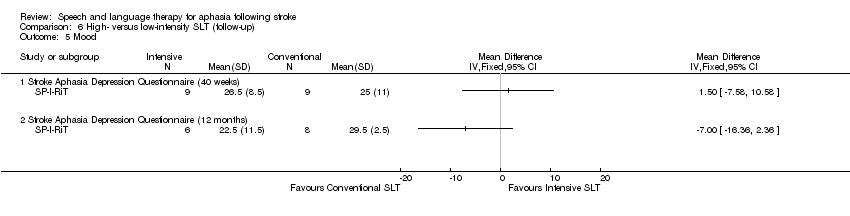 Comparison 6 High‐ versus low‐intensity SLT (follow‐up), Outcome 5 Mood. | ||||
| 5.1 Stroke Aphasia Depression Questionnaire (40 weeks) | 1 | Mean Difference (IV, Fixed, 95% CI) | 0.0 [0.0, 0.0] | |
| 5.2 Stroke Aphasia Depression Questionnaire (12 months) | 1 | Mean Difference (IV, Fixed, 95% CI) | 0.0 [0.0, 0.0] | |
| 6 Number of dropouts for any reason Show forest plot | 4 | 216 | Odds Ratio (M‐H, Fixed, 95% CI) | 1.41 [0.59, 3.34] |
| Analysis 6.6 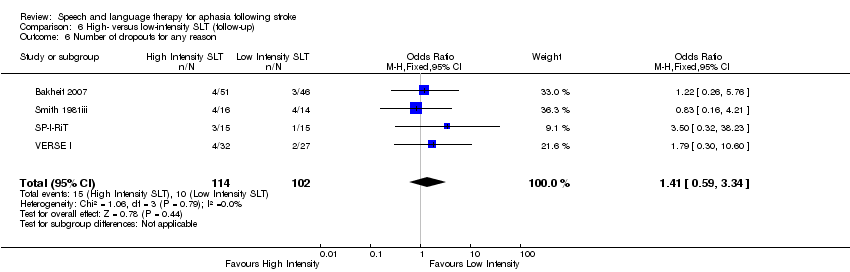 Comparison 6 High‐ versus low‐intensity SLT (follow‐up), Outcome 6 Number of dropouts for any reason. | ||||
| Outcome or subgroup title | No. of studies | No. of participants | Statistical method | Effect size |
| 1 Functional communication Show forest plot | 1 | Std. Mean Difference (IV, Random, 95% CI) | Totals not selected | |
| Analysis 7.1  Comparison 7 High versus low dose SLT, Outcome 1 Functional communication. | ||||
| 1.1 Functional Communication Profile | 1 | Std. Mean Difference (IV, Random, 95% CI) | 0.0 [0.0, 0.0] | |
| 1.2 Discourse Analysis | 1 | Std. Mean Difference (IV, Random, 95% CI) | 0.0 [0.0, 0.0] | |
| 2 Receptive language: auditory comprehension (change from baseline) Show forest plot | 1 | Std. Mean Difference (IV, Random, 95% CI) | Totals not selected | |
| Analysis 7.2  Comparison 7 High versus low dose SLT, Outcome 2 Receptive language: auditory comprehension (change from baseline). | ||||
| 2.1 AAT comprehension subtest | 1 | Std. Mean Difference (IV, Random, 95% CI) | 0.0 [0.0, 0.0] | |
| 2.2 Token Test | 1 | Std. Mean Difference (IV, Random, 95% CI) | 0.0 [0.0, 0.0] | |
| 3 Expressive language: spoken (change from baseline) Show forest plot | 1 | Std. Mean Difference (IV, Random, 95% CI) | Totals not selected | |
| Analysis 7.3  Comparison 7 High versus low dose SLT, Outcome 3 Expressive language: spoken (change from baseline). | ||||
| 3.1 AAT naming subtest | 1 | Std. Mean Difference (IV, Random, 95% CI) | 0.0 [0.0, 0.0] | |
| 3.2 AAT repetition subtest | 1 | Std. Mean Difference (IV, Random, 95% CI) | 0.0 [0.0, 0.0] | |
| 4 Expressive language: written (change from baseline) Show forest plot | 1 | Mean Difference (IV, Fixed, 95% CI) | Totals not selected | |
| Analysis 7.4  Comparison 7 High versus low dose SLT, Outcome 4 Expressive language: written (change from baseline). | ||||
| 4.1 AAT written subtest | 1 | Mean Difference (IV, Fixed, 95% CI) | 0.0 [0.0, 0.0] | |
| 5 Severity of impairment: Aphasia Battery Score Show forest plot | 3 | 145 | Std. Mean Difference (IV, Random, 95% CI) | 0.35 [‐0.16, 0.85] |
| Analysis 7.5  Comparison 7 High versus low dose SLT, Outcome 5 Severity of impairment: Aphasia Battery Score. | ||||
| 5.1 Aphasia Quotient (WAB) | 3 | 145 | Std. Mean Difference (IV, Random, 95% CI) | 0.35 [‐0.16, 0.85] |
| 6 Number of dropouts for any reason Show forest plot | 3 | 186 | Odds Ratio (M‐H, Fixed, 95% CI) | 2.01 [1.07, 3.79] |
| Analysis 7.6  Comparison 7 High versus low dose SLT, Outcome 6 Number of dropouts for any reason. | ||||
| 7 Adherence to allocated intervention Show forest plot | 2 | 166 | Odds Ratio (M‐H, Fixed, 95% CI) | 5.13 [0.84, 31.18] |
| Analysis 7.7  Comparison 7 High versus low dose SLT, Outcome 7 Adherence to allocated intervention. | ||||
| Outcome or subgroup title | No. of studies | No. of participants | Statistical method | Effect size |
| 1 Functional communication Show forest plot | 1 | Std. Mean Difference (IV, Random, 95% CI) | Totals not selected | |
| Analysis 8.1  Comparison 8 High versus low dose SLT (follow‐up), Outcome 1 Functional communication. | ||||
| 1.1 Functional Communication Profile (40 weeks) | 1 | Std. Mean Difference (IV, Random, 95% CI) | 0.0 [0.0, 0.0] | |
| 1.2 Discourse Analysis (6 months) | 1 | Std. Mean Difference (IV, Random, 95% CI) | 0.0 [0.0, 0.0] | |
| 2 Severity of impairment: Aphasia Battery Score Show forest plot | 2 | 125 | Std. Mean Difference (IV, Random, 95% CI) | 0.29 [‐0.16, 0.74] |
| Analysis 8.2 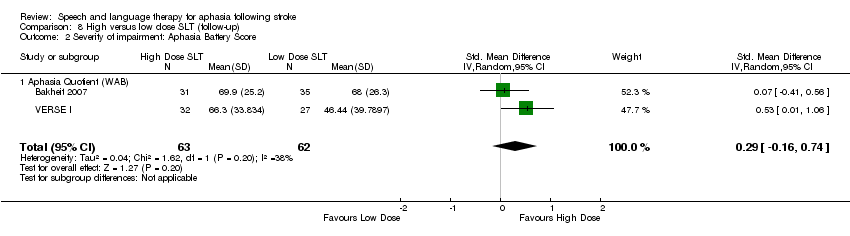 Comparison 8 High versus low dose SLT (follow‐up), Outcome 2 Severity of impairment: Aphasia Battery Score. | ||||
| 2.1 Aphasia Quotient (WAB) | 2 | 125 | Std. Mean Difference (IV, Random, 95% CI) | 0.29 [‐0.16, 0.74] |
| 3 Number of dropouts for any reason Show forest plot | 3 | 186 | Odds Ratio (M‐H, Fixed, 95% CI) | 2.96 [1.36, 6.43] |
| Analysis 8.3 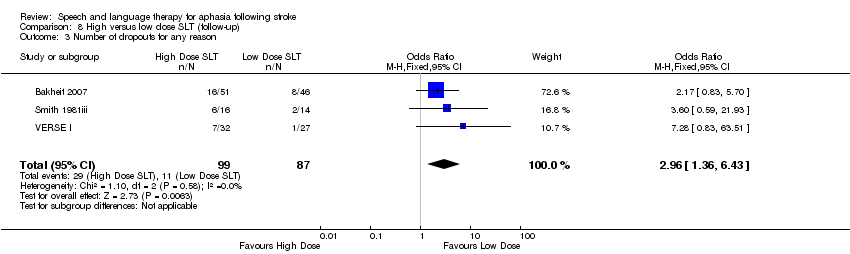 Comparison 8 High versus low dose SLT (follow‐up), Outcome 3 Number of dropouts for any reason. | ||||
| Outcome or subgroup title | No. of studies | No. of participants | Statistical method | Effect size |
| 1 Functional communication Show forest plot | 1 | Std. Mean Difference (IV, Fixed, 95% CI) | Totals not selected | |
| Analysis 9.1  Comparison 9 Early versus delayed SLT, Outcome 1 Functional communication. | ||||
| 1.1 ANELT | 1 | Std. Mean Difference (IV, Fixed, 95% CI) | 0.0 [0.0, 0.0] | |
| 1.2 ANELT (4 weeks) | 1 | Std. Mean Difference (IV, Fixed, 95% CI) | 0.0 [0.0, 0.0] | |
| 1.3 CETI | 1 | Std. Mean Difference (IV, Fixed, 95% CI) | 0.0 [0.0, 0.0] | |
| 2 Receptive language: auditory comprehension Show forest plot | 1 | Mean Difference (IV, Fixed, 95% CI) | Totals not selected | |
| Analysis 9.2 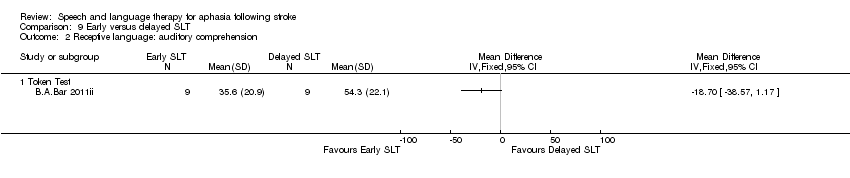 Comparison 9 Early versus delayed SLT, Outcome 2 Receptive language: auditory comprehension. | ||||
| 2.1 Token Test | 1 | Mean Difference (IV, Fixed, 95% CI) | 0.0 [0.0, 0.0] | |
| 3 Expressive language: naming Show forest plot | 2 | 65 | Std. Mean Difference (IV, Random, 95% CI) | ‐0.19 [‐0.96, 0.58] |
| Analysis 9.3  Comparison 9 Early versus delayed SLT, Outcome 3 Expressive language: naming. | ||||
| 3.1 AAT subtest | 1 | 18 | Std. Mean Difference (IV, Random, 95% CI) | ‐0.69 [‐1.65, 0.27] |
| 3.2 Naming accuracy (matched) | 1 | 47 | Std. Mean Difference (IV, Random, 95% CI) | 0.12 [‐0.45, 0.70] |
| 4 Expressive language: written Show forest plot | 1 | Mean Difference (IV, Fixed, 95% CI) | Totals not selected | |
| Analysis 9.4 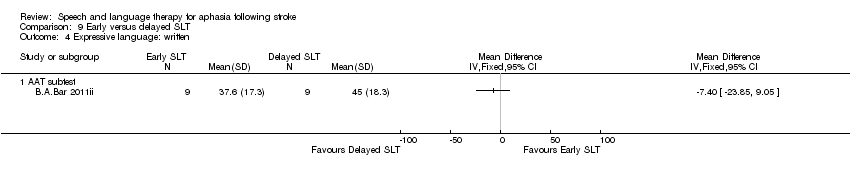 Comparison 9 Early versus delayed SLT, Outcome 4 Expressive language: written. | ||||
| 4.1 AAT subtest | 1 | Mean Difference (IV, Fixed, 95% CI) | 0.0 [0.0, 0.0] | |
| 5 Expressive language: repetition Show forest plot | 2 | 65 | Std. Mean Difference (IV, Fixed, 95% CI) | ‐0.17 [‐0.65, 0.32] |
| Analysis 9.5 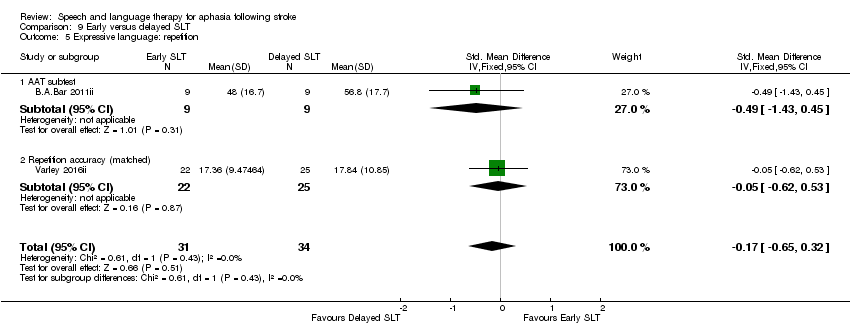 Comparison 9 Early versus delayed SLT, Outcome 5 Expressive language: repetition. | ||||
| 5.1 AAT subtest | 1 | 18 | Std. Mean Difference (IV, Fixed, 95% CI) | ‐0.49 [‐1.43, 0.45] |
| 5.2 Repetition accuracy (matched) | 1 | 47 | Std. Mean Difference (IV, Fixed, 95% CI) | ‐0.05 [‐0.62, 0.53] |
| 6 Expressive language: fluency Show forest plot | 1 | Mean Difference (IV, Fixed, 95% CI) | Totals not selected | |
| Analysis 9.6  Comparison 9 Early versus delayed SLT, Outcome 6 Expressive language: fluency. | ||||
| 6.1 Word fluency (food) | 1 | Mean Difference (IV, Fixed, 95% CI) | 0.0 [0.0, 0.0] | |
| 6.2 Word fluency (animals) | 1 | Mean Difference (IV, Fixed, 95% CI) | 0.0 [0.0, 0.0] | |
| 6.3 Word fluency (food; 1 month) | 1 | Mean Difference (IV, Fixed, 95% CI) | 0.0 [0.0, 0.0] | |
| 6.4 Word fluency (animals; 1 month) | 1 | Mean Difference (IV, Fixed, 95% CI) | 0.0 [0.0, 0.0] | |
| 7 Severity of impairment Show forest plot | 1 | Mean Difference (IV, Fixed, 95% CI) | Totals not selected | |
| Analysis 9.7  Comparison 9 Early versus delayed SLT, Outcome 7 Severity of impairment. | ||||
| 7.1 AAT overall | 1 | Mean Difference (IV, Fixed, 95% CI) | 0.0 [0.0, 0.0] | |
| 8 Number of dropouts for any reason Show forest plot | 2 | 77 | Odds Ratio (M‐H, Random, 95% CI) | 2.09 [0.30, 14.35] |
| Analysis 9.8  Comparison 9 Early versus delayed SLT, Outcome 8 Number of dropouts for any reason. | ||||
| Outcome or subgroup title | No. of studies | No. of participants | Statistical method | Effect size |
| 1 Expressive language: naming Show forest plot | 1 | Mean Difference (IV, Fixed, 95% CI) | Totals not selected | |
| Analysis 10.1  Comparison 10 Early versus delayed SLT (follow‐up), Outcome 1 Expressive language: naming. | ||||
| 1.1 Naming accuracy (treated) | 1 | Mean Difference (IV, Fixed, 95% CI) | 0.0 [0.0, 0.0] | |
| 1.2 Naming accuracy (matched) | 1 | Mean Difference (IV, Fixed, 95% CI) | 0.0 [0.0, 0.0] | |
| 1.3 Naming accuracy (control) | 1 | Mean Difference (IV, Fixed, 95% CI) | 0.0 [0.0, 0.0] | |
| 2 Expressive language: repetition Show forest plot | 1 | Mean Difference (IV, Fixed, 95% CI) | Totals not selected | |
| Analysis 10.2  Comparison 10 Early versus delayed SLT (follow‐up), Outcome 2 Expressive language: repetition. | ||||
| 2.1 Repetition accuracy (treated) | 1 | Mean Difference (IV, Fixed, 95% CI) | 0.0 [0.0, 0.0] | |
| 2.2 Repetition accuracy (matched) | 1 | Mean Difference (IV, Fixed, 95% CI) | 0.0 [0.0, 0.0] | |
| 2.3 Repetition accuracy (control) | 1 | Mean Difference (IV, Fixed, 95% CI) | 0.0 [0.0, 0.0] | |
| 3 Number of dropouts for any reason Show forest plot | 1 | Odds Ratio (M‐H, Fixed, 95% CI) | Totals not selected | |
| Analysis 10.3 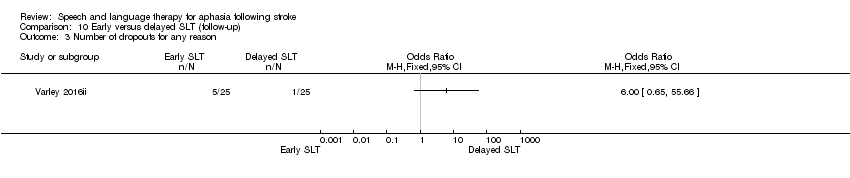 Comparison 10 Early versus delayed SLT (follow‐up), Outcome 3 Number of dropouts for any reason. | ||||
| Outcome or subgroup title | No. of studies | No. of participants | Statistical method | Effect size |
| 1 Functional communication Show forest plot | 2 | 50 | Std. Mean Difference (IV, Random, 95% CI) | 0.81 [0.23, 1.40] |
| Analysis 11.1  Comparison 11 SLT of short versus long duration, Outcome 1 Functional communication. | ||||
| 1.1 Discourse (content information units per minute) | 1 | 25 | Std. Mean Difference (IV, Random, 95% CI) | 0.62 [‐0.19, 1.44] |
| 1.2 Functional Communication Profile | 1 | 25 | Std. Mean Difference (IV, Random, 95% CI) | 1.02 [0.18, 1.86] |
| 2 Functional communication (follow‐up) Show forest plot | 1 | Std. Mean Difference (IV, Random, 95% CI) | Totals not selected | |
| Analysis 11.2 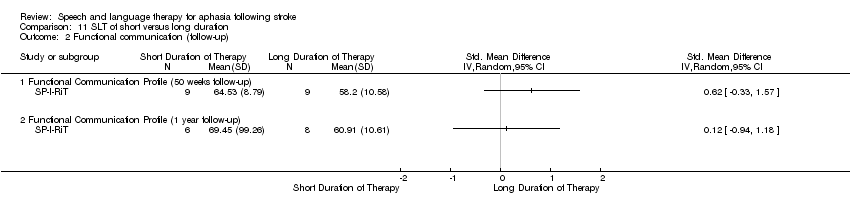 Comparison 11 SLT of short versus long duration, Outcome 2 Functional communication (follow‐up). | ||||
| 2.1 Functional Communication Profile (50 weeks follow‐up) | 1 | Std. Mean Difference (IV, Random, 95% CI) | 0.0 [0.0, 0.0] | |
| 2.2 Functional Communication Profile (1 year follow‐up) | 1 | Std. Mean Difference (IV, Random, 95% CI) | 0.0 [0.0, 0.0] | |
| 3 Receptive language: auditory comprehension Show forest plot | 2 | 42 | Std. Mean Difference (IV, Random, 95% CI) | 0.81 [0.17, 1.45] |
| Analysis 11.3 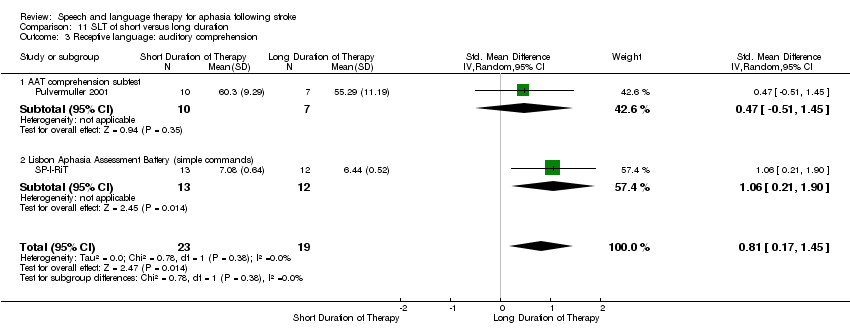 Comparison 11 SLT of short versus long duration, Outcome 3 Receptive language: auditory comprehension. | ||||
| 3.1 AAT comprehension subtest | 1 | 17 | Std. Mean Difference (IV, Random, 95% CI) | 0.47 [‐0.51, 1.45] |
| 3.2 Lisbon Aphasia Assessment Battery (simple commands) | 1 | 25 | Std. Mean Difference (IV, Random, 95% CI) | 1.06 [0.21, 1.90] |
| 4 Receptive language: comprehension (50 week follow‐up) Show forest plot | 1 | Mean Difference (IV, Fixed, 95% CI) | Totals not selected | |
| Analysis 11.4  Comparison 11 SLT of short versus long duration, Outcome 4 Receptive language: comprehension (50 week follow‐up). | ||||
| 4.1 Lisbon Aphasia Assessment Battery (simple commands) | 1 | Mean Difference (IV, Fixed, 95% CI) | 0.0 [0.0, 0.0] | |
| 4.2 Token Test | 1 | Mean Difference (IV, Fixed, 95% CI) | 0.0 [0.0, 0.0] | |
| 4.3 AAT (Portuguese version) Reading comprehension | 1 | Mean Difference (IV, Fixed, 95% CI) | 0.0 [0.0, 0.0] | |
| 5 Receptive language: comprehension (62 week follow‐up) Show forest plot | 1 | Mean Difference (IV, Fixed, 95% CI) | Totals not selected | |
| Analysis 11.5  Comparison 11 SLT of short versus long duration, Outcome 5 Receptive language: comprehension (62 week follow‐up). | ||||
| 5.1 Lisbon Aphasia Assessment Battery (simple commands) | 1 | Mean Difference (IV, Fixed, 95% CI) | 0.0 [0.0, 0.0] | |
| 5.2 Token Test | 1 | Mean Difference (IV, Fixed, 95% CI) | 0.0 [0.0, 0.0] | |
| 5.3 AAT (Portuguese version): reading comprehension | 1 | Mean Difference (IV, Fixed, 95% CI) | 0.0 [0.0, 0.0] | |
| 6 Receptive language: reading comprehension Show forest plot | 3 | 64 | Std. Mean Difference (IV, Random, 95% CI) | 0.18 [‐0.32, 0.67] |
| Analysis 11.6  Comparison 11 SLT of short versus long duration, Outcome 6 Receptive language: reading comprehension. | ||||
| 6.1 WAB (reading comprehension) | 1 | 25 | Std. Mean Difference (IV, Random, 95% CI) | 0.15 [‐0.64, 0.94] |
| 6.2 AAT (Portuguese version) | 1 | 25 | Std. Mean Difference (IV, Random, 95% CI) | 0.28 [‐0.51, 1.06] |
| 6.3 Unknown | 1 | 14 | Std. Mean Difference (IV, Random, 95% CI) | 0.06 [‐0.99, 1.10] |
| 7 Expressive language: naming Show forest plot | 3 | 56 | Std. Mean Difference (IV, Fixed, 95% CI) | 0.23 [‐0.30, 0.76] |
| Analysis 11.7  Comparison 11 SLT of short versus long duration, Outcome 7 Expressive language: naming. | ||||
| 7.1 AAT naming subtest | 1 | 17 | Std. Mean Difference (IV, Fixed, 95% CI) | 0.34 [‐0.64, 1.31] |
| 7.2 Lisbon Aphasia Assessment Battery | 1 | 25 | Std. Mean Difference (IV, Fixed, 95% CI) | 0.16 [‐0.62, 0.95] |
| 7.3 Thorndike‐Lorge Word List | 1 | 14 | Std. Mean Difference (IV, Fixed, 95% CI) | 0.23 [‐0.83, 1.28] |
| 8 Expressive language: written Show forest plot | 2 | 50 | Std. Mean Difference (IV, Random, 95% CI) | ‐0.01 [‐0.56, 0.55] |
| Analysis 11.8  Comparison 11 SLT of short versus long duration, Outcome 8 Expressive language: written. | ||||
| 8.1 WAB (writing) | 1 | 25 | Std. Mean Difference (IV, Random, 95% CI) | 0.16 [‐0.64, 0.95] |
| 8.2 AAT (Portuguese version) (writing to dictation) | 1 | 25 | Std. Mean Difference (IV, Random, 95% CI) | ‐0.16 [‐0.95, 0.62] |
| 9 Expressive language: repetition Show forest plot | 2 | 42 | Std. Mean Difference (IV, Random, 95% CI) | ‐0.05 [‐0.66, 0.56] |
| Analysis 11.9  Comparison 11 SLT of short versus long duration, Outcome 9 Expressive language: repetition. | ||||
| 9.1 AAT repetition subtest | 1 | 17 | Std. Mean Difference (IV, Random, 95% CI) | ‐0.10 [‐1.07, 0.87] |
| 9.2 Lisbon Aphasia Assessment Battery | 1 | 25 | Std. Mean Difference (IV, Random, 95% CI) | ‐0.02 [‐0.80, 0.77] |
| 10 Expressive language: fluency Show forest plot | 1 | Mean Difference (IV, Fixed, 95% CI) | Totals not selected | |
| Analysis 11.10 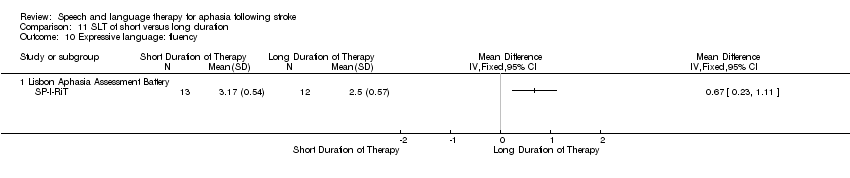 Comparison 11 SLT of short versus long duration, Outcome 10 Expressive language: fluency. | ||||
| 10.1 Lisbon Aphasia Assessment Battery | 1 | Mean Difference (IV, Fixed, 95% CI) | 0.0 [0.0, 0.0] | |
| 11 Expressive language: 50 and 62 weeks follow‐up Show forest plot | 1 | Mean Difference (IV, Fixed, 95% CI) | Totals not selected | |
| Analysis 11.11 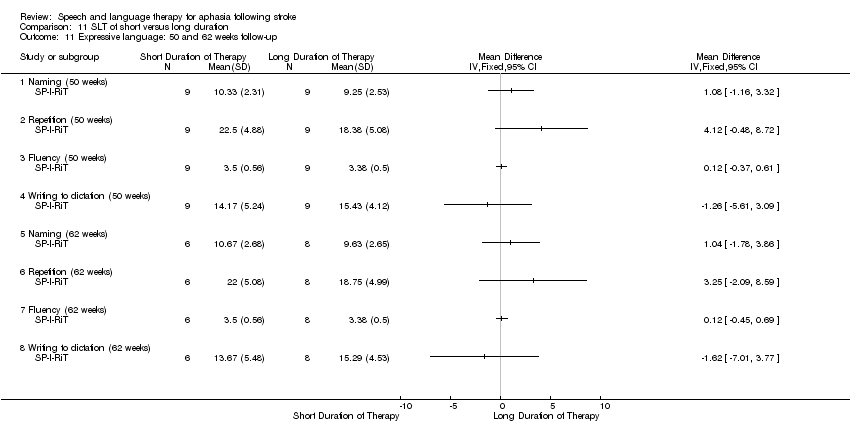 Comparison 11 SLT of short versus long duration, Outcome 11 Expressive language: 50 and 62 weeks follow‐up. | ||||
| 11.1 Naming (50 weeks) | 1 | Mean Difference (IV, Fixed, 95% CI) | 0.0 [0.0, 0.0] | |
| 11.2 Repetition (50 weeks) | 1 | Mean Difference (IV, Fixed, 95% CI) | 0.0 [0.0, 0.0] | |
| 11.3 Fluency (50 weeks) | 1 | Mean Difference (IV, Fixed, 95% CI) | 0.0 [0.0, 0.0] | |
| 11.4 Writing to dictation (50 weeks) | 1 | Mean Difference (IV, Fixed, 95% CI) | 0.0 [0.0, 0.0] | |
| 11.5 Naming (62 weeks) | 1 | Mean Difference (IV, Fixed, 95% CI) | 0.0 [0.0, 0.0] | |
| 11.6 Repetition (62 weeks) | 1 | Mean Difference (IV, Fixed, 95% CI) | 0.0 [0.0, 0.0] | |
| 11.7 Fluency (62 weeks) | 1 | Mean Difference (IV, Fixed, 95% CI) | 0.0 [0.0, 0.0] | |
| 11.8 Writing to dictation (62 weeks) | 1 | Mean Difference (IV, Fixed, 95% CI) | 0.0 [0.0, 0.0] | |
| 12 Depression Show forest plot | 1 | Mean Difference (IV, Fixed, 95% CI) | Totals not selected | |
| Analysis 11.12  Comparison 11 SLT of short versus long duration, Outcome 12 Depression. | ||||
| 12.1 Stroke Aphasia Depression Questionnaire (10 weeks) | 1 | Mean Difference (IV, Fixed, 95% CI) | 0.0 [0.0, 0.0] | |
| 12.2 Stroke Aphasia Depression Questionnaire (50 weeks) | 1 | Mean Difference (IV, Fixed, 95% CI) | 0.0 [0.0, 0.0] | |
| 12.3 Stroke Aphasia Depression Questionnaire (62 weeks) | 1 | Mean Difference (IV, Fixed, 95% CI) | 0.0 [0.0, 0.0] | |
| 13 Severity of impairment: Aphasia Battery Score Show forest plot | 4 | 98 | Std. Mean Difference (IV, Random, 95% CI) | 0.22 [‐0.26, 0.71] |
| Analysis 11.13  Comparison 11 SLT of short versus long duration, Outcome 13 Severity of impairment: Aphasia Battery Score. | ||||
| 13.1 WABAQ | 1 | 25 | Std. Mean Difference (IV, Random, 95% CI) | 0.57 [‐0.24, 1.38] |
| 13.2 PICA | 1 | 31 | Std. Mean Difference (IV, Random, 95% CI) | ‐0.38 [‐1.09, 0.33] |
| 13.3 AAT overall | 1 | 17 | Std. Mean Difference (IV, Random, 95% CI) | 0.23 [‐0.74, 1.20] |
| 13.4 Boston Diagnostic Aphasia Examination (10 weeks) | 1 | 25 | Std. Mean Difference (IV, Random, 95% CI) | 0.59 [‐0.22, 1.39] |
| 14 Severity of impairment: Aphasia Battery Score (follow‐up) Show forest plot | 1 | Std. Mean Difference (IV, Random, 95% CI) | Totals not selected | |
| Analysis 11.14  Comparison 11 SLT of short versus long duration, Outcome 14 Severity of impairment: Aphasia Battery Score (follow‐up). | ||||
| 14.1 Boston Diagnostic Aphasia Examination (50 weeks) | 1 | Std. Mean Difference (IV, Random, 95% CI) | 0.0 [0.0, 0.0] | |
| 14.2 Boston Diagnostic Aphasia Examination (62 weeks) | 1 | Std. Mean Difference (IV, Random, 95% CI) | 0.0 [0.0, 0.0] | |
| 14.3 Aphasia Quotient (Lisbon Aphasia Assessment Battery) (50 weeks) | 1 | Std. Mean Difference (IV, Random, 95% CI) | 0.0 [0.0, 0.0] | |
| 14.4 Aphasia Quotient (Lisbon Aphasia Assessment Battery) (62 weeks) | 1 | Std. Mean Difference (IV, Random, 95% CI) | 0.0 [0.0, 0.0] | |
| 15 Number of dropouts for any reason Show forest plot | 1 | 31 | Odds Ratio (M‐H, Random, 95% CI) | 6.11 [0.27, 138.45] |
| Analysis 11.15 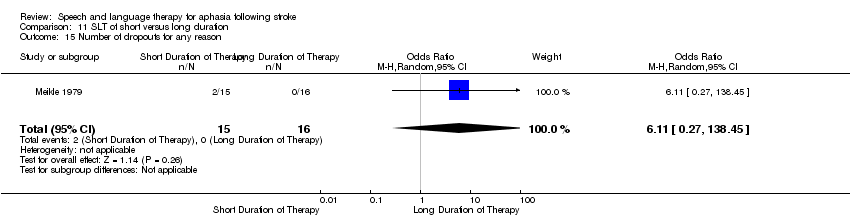 Comparison 11 SLT of short versus long duration, Outcome 15 Number of dropouts for any reason. | ||||
| 16 Adherence to allocated intervention Show forest plot | 1 | 31 | Odds Ratio (M‐H, Random, 95% CI) | 3.41 [0.13, 90.49] |
| Analysis 11.16 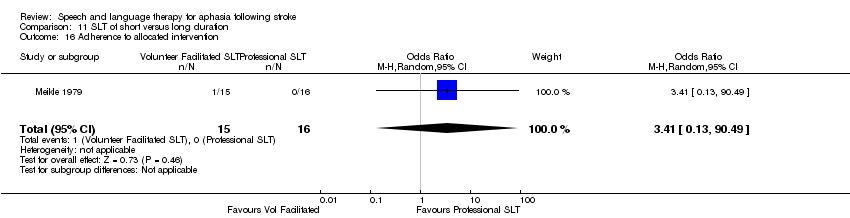 Comparison 11 SLT of short versus long duration, Outcome 16 Adherence to allocated intervention. | ||||
| Outcome or subgroup title | No. of studies | No. of participants | Statistical method | Effect size |
| 1 Functional communication Show forest plot | 3 | 46 | Std. Mean Difference (IV, Random, 95% CI) | 0.41 [‐0.19, 1.00] |
| Analysis 12.1 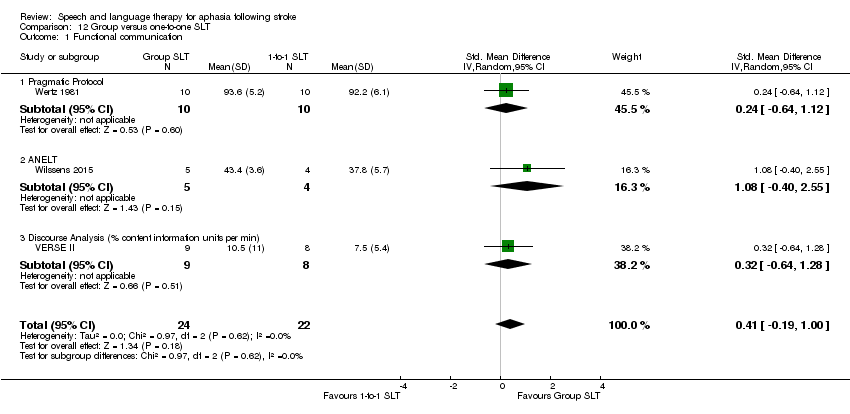 Comparison 12 Group versus one‐to‐one SLT, Outcome 1 Functional communication. | ||||
| 1.1 Pragmatic Protocol | 1 | 20 | Std. Mean Difference (IV, Random, 95% CI) | 0.24 [‐0.64, 1.12] |
| 1.2 ANELT | 1 | 9 | Std. Mean Difference (IV, Random, 95% CI) | 1.08 [‐0.40, 2.55] |
| 1.3 Discourse Analysis (% content information units per min) | 1 | 17 | Std. Mean Difference (IV, Random, 95% CI) | 0.32 [‐0.64, 1.28] |
| 2 Receptive language: auditory comprehension Show forest plot | 3 | Std. Mean Difference (IV, Fixed, 95% CI) | Subtotals only | |
| Analysis 12.2  Comparison 12 Group versus one‐to‐one SLT, Outcome 2 Receptive language: auditory comprehension. | ||||
| 2.1 Token Test | 3 | 60 | Std. Mean Difference (IV, Fixed, 95% CI) | 0.18 [‐0.34, 0.69] |
| 2.2 AAT comprehension subtest | 2 | 26 | Std. Mean Difference (IV, Fixed, 95% CI) | ‐0.00 [‐0.82, 0.81] |
| 3 Receptive language: other Show forest plot | 1 | Mean Difference (IV, Fixed, 95% CI) | Totals not selected | |
| Analysis 12.3 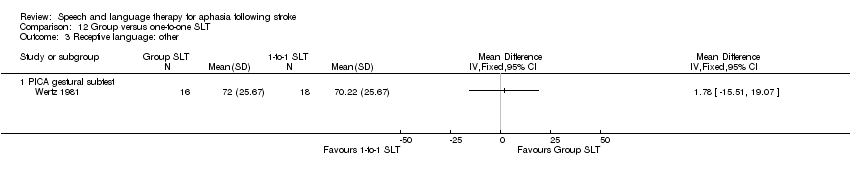 Comparison 12 Group versus one‐to‐one SLT, Outcome 3 Receptive language: other. | ||||
| 3.1 PICA gestural subtest | 1 | Mean Difference (IV, Fixed, 95% CI) | 0.0 [0.0, 0.0] | |
| 4 Expressive language: naming Show forest plot | 2 | Std. Mean Difference (IV, Random, 95% CI) | Subtotals only | |
| Analysis 12.4  Comparison 12 Group versus one‐to‐one SLT, Outcome 4 Expressive language: naming. | ||||
| 4.1 AAT naming subtest | 2 | 26 | Std. Mean Difference (IV, Random, 95% CI) | 0.36 [‐0.42, 1.15] |
| 5 Expressive language: general Show forest plot | 1 | Std. Mean Difference (IV, Fixed, 95% CI) | Totals not selected | |
| Analysis 12.5  Comparison 12 Group versus one‐to‐one SLT, Outcome 5 Expressive language: general. | ||||
| 5.1 PICA verbal subtest | 1 | Std. Mean Difference (IV, Fixed, 95% CI) | 0.0 [0.0, 0.0] | |
| 6 Expressive language: repetition Show forest plot | 2 | Std. Mean Difference (IV, Fixed, 95% CI) | Subtotals only | |
| Analysis 12.6 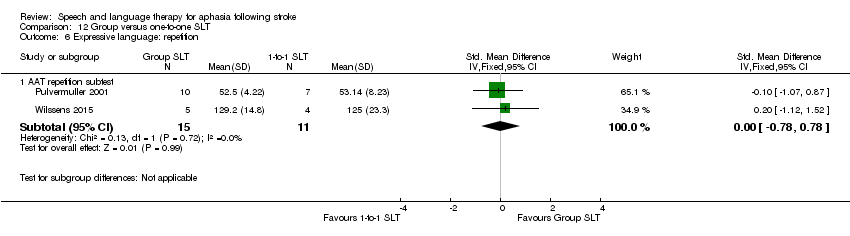 Comparison 12 Group versus one‐to‐one SLT, Outcome 6 Expressive language: repetition. | ||||
| 6.1 AAT repetition subtest | 2 | 26 | Std. Mean Difference (IV, Fixed, 95% CI) | 0.00 [‐0.78, 0.78] |
| 7 Expressive language: written Show forest plot | 2 | 43 | Std. Mean Difference (IV, Fixed, 95% CI) | ‐0.22 [‐0.82, 0.38] |
| Analysis 12.7  Comparison 12 Group versus one‐to‐one SLT, Outcome 7 Expressive language: written. | ||||
| 7.1 PICA graphic | 1 | 34 | Std. Mean Difference (IV, Fixed, 95% CI) | ‐0.27 [‐0.95, 0.41] |
| 7.2 AAT written language subtest | 1 | 9 | Std. Mean Difference (IV, Fixed, 95% CI) | ‐0.04 [‐1.35, 1.28] |
| 8 Quality of life Show forest plot | 1 | Mean Difference (IV, Fixed, 95% CI) | Totals not selected | |
| Analysis 12.8  Comparison 12 Group versus one‐to‐one SLT, Outcome 8 Quality of life. | ||||
| 8.1 SAQoL | 1 | Mean Difference (IV, Fixed, 95% CI) | 0.0 [0.0, 0.0] | |
| 9 Severity of impairment: Aphasia Battery Score Show forest plot | 4 | 122 | Std. Mean Difference (IV, Random, 95% CI) | 0.15 [‐0.21, 0.50] |
| Analysis 12.9  Comparison 12 Group versus one‐to‐one SLT, Outcome 9 Severity of impairment: Aphasia Battery Score. | ||||
| 9.1 Aphasia Quotient CRRCAE | 1 | 54 | Std. Mean Difference (IV, Random, 95% CI) | 0.30 [‐0.24, 0.84] |
| 9.2 PICA overall | 1 | 34 | Std. Mean Difference (IV, Random, 95% CI) | ‐0.06 [‐0.73, 0.61] |
| 9.3 AAT overall | 1 | 17 | Std. Mean Difference (IV, Random, 95% CI) | 0.23 [‐0.74, 1.20] |
| 9.4 Aphasia Quotient (WAB) | 1 | 17 | Std. Mean Difference (IV, Random, 95% CI) | ‐0.00 [‐0.96, 0.95] |
| 10 Number of dropouts for any reason Show forest plot | 2 | 87 | Odds Ratio (M‐H, Random, 95% CI) | 1.35 [0.31, 5.84] |
| Analysis 12.10 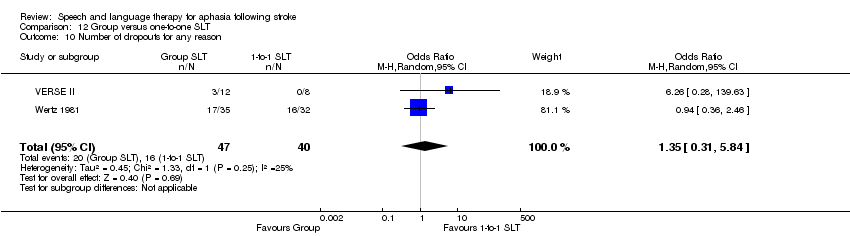 Comparison 12 Group versus one‐to‐one SLT, Outcome 10 Number of dropouts for any reason. | ||||
| Outcome or subgroup title | No. of studies | No. of participants | Statistical method | Effect size |
| 1 Functional communication Show forest plot | 1 | Mean Difference (IV, Random, 95% CI) | Totals not selected | |
| Analysis 13.1  Comparison 13 Group versus one‐to‐one SLT (follow‐up), Outcome 1 Functional communication. | ||||
| 1.1 Discourse Analysis (% content information units per min; 12 weeks) | 1 | Mean Difference (IV, Random, 95% CI) | 0.0 [0.0, 0.0] | |
| 1.2 Discourse Analysis (% content information units per min; 26 weeks) | 1 | Mean Difference (IV, Random, 95% CI) | 0.0 [0.0, 0.0] | |
| 2 Severity of impairment: Aphasia Battery Score Show forest plot | 2 | 70 | Std. Mean Difference (IV, Fixed, 95% CI) | 0.69 [0.19, 1.19] |
| Analysis 13.2  Comparison 13 Group versus one‐to‐one SLT (follow‐up), Outcome 2 Severity of impairment: Aphasia Battery Score. | ||||
| 2.1 Aphasia Quotient CRRCAE (3‐month follow‐up) | 1 | 54 | Std. Mean Difference (IV, Fixed, 95% CI) | 1.04 [0.47, 1.62] |
| 2.2 Aphasia Quotient (WAB) (12 week follow‐up) | 1 | 16 | Std. Mean Difference (IV, Fixed, 95% CI) | ‐0.38 [‐1.37, 0.62] |
| 3 Quality of life Show forest plot | 1 | Mean Difference (IV, Fixed, 95% CI) | Totals not selected | |
| Analysis 13.3  Comparison 13 Group versus one‐to‐one SLT (follow‐up), Outcome 3 Quality of life. | ||||
| 3.1 SAQoL (12 weeks) | 1 | Mean Difference (IV, Fixed, 95% CI) | 0.0 [0.0, 0.0] | |
| 3.2 SAQoL (26 weeks) | 1 | Mean Difference (IV, Fixed, 95% CI) | 0.0 [0.0, 0.0] | |
| 4 Number of dropouts for any reason Show forest plot | 1 | 20 | Odds Ratio (M‐H, Random, 95% CI) | 2.0 [0.32, 12.51] |
| Analysis 13.4  Comparison 13 Group versus one‐to‐one SLT (follow‐up), Outcome 4 Number of dropouts for any reason. | ||||
| Outcome or subgroup title | No. of studies | No. of participants | Statistical method | Effect size |
| 1 Functional communication Show forest plot | 1 | Std. Mean Difference (IV, Random, 95% CI) | Totals not selected | |
| Analysis 14.1 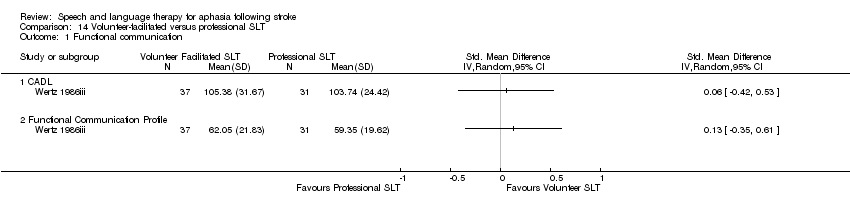 Comparison 14 Volunteer‐facilitated versus professional SLT, Outcome 1 Functional communication. | ||||
| 1.1 CADL | 1 | Std. Mean Difference (IV, Random, 95% CI) | 0.0 [0.0, 0.0] | |
| 1.2 Functional Communication Profile | 1 | Std. Mean Difference (IV, Random, 95% CI) | 0.0 [0.0, 0.0] | |
| 2 Receptive language: auditory comprehension Show forest plot | 2 | Std. Mean Difference (IV, Fixed, 95% CI) | Subtotals only | |
| Analysis 14.2  Comparison 14 Volunteer‐facilitated versus professional SLT, Outcome 2 Receptive language: auditory comprehension. | ||||
| 2.1 Token Test | 2 | 88 | Std. Mean Difference (IV, Fixed, 95% CI) | 0.06 [‐0.36, 0.47] |
| 2.2 AAT subtest | 1 | 20 | Std. Mean Difference (IV, Fixed, 95% CI) | ‐0.37 [‐1.25, 0.52] |
| 3 Receptive language: reading comprehension Show forest plot | 2 | 88 | Std. Mean Difference (IV, Random, 95% CI) | ‐0.07 [‐0.49, 0.35] |
| Analysis 14.3 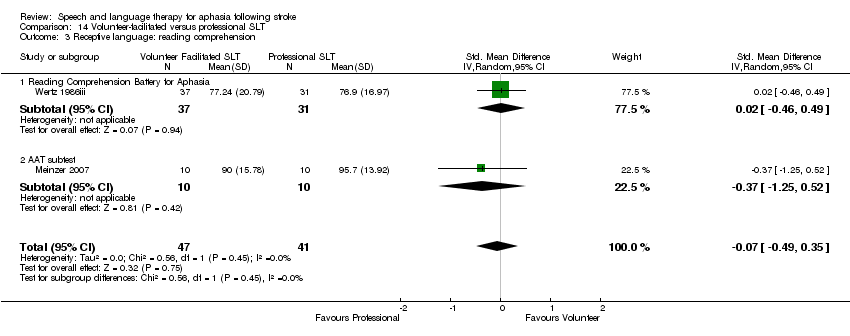 Comparison 14 Volunteer‐facilitated versus professional SLT, Outcome 3 Receptive language: reading comprehension. | ||||
| 3.1 Reading Comprehension Battery for Aphasia | 1 | 68 | Std. Mean Difference (IV, Random, 95% CI) | 0.02 [‐0.46, 0.49] |
| 3.2 AAT subtest | 1 | 20 | Std. Mean Difference (IV, Random, 95% CI) | ‐0.37 [‐1.25, 0.52] |
| 4 Receptive language: other Show forest plot | 1 | Mean Difference (IV, Fixed, 95% CI) | Totals not selected | |
| Analysis 14.4  Comparison 14 Volunteer‐facilitated versus professional SLT, Outcome 4 Receptive language: other. | ||||
| 4.1 PICA gestural subtest | 1 | Mean Difference (IV, Fixed, 95% CI) | 0.0 [0.0, 0.0] | |
| 5 Expressive language: spoken Show forest plot | 2 | Std. Mean Difference (IV, Random, 95% CI) | Totals not selected | |
| Analysis 14.5  Comparison 14 Volunteer‐facilitated versus professional SLT, Outcome 5 Expressive language: spoken. | ||||
| 5.1 AAT naming subtest | 1 | Std. Mean Difference (IV, Random, 95% CI) | 0.0 [0.0, 0.0] | |
| 5.2 PICA verbal subtest | 1 | Std. Mean Difference (IV, Random, 95% CI) | 0.0 [0.0, 0.0] | |
| 6 Expressive language: repetition Show forest plot | 1 | Mean Difference (IV, Fixed, 95% CI) | Totals not selected | |
| Analysis 14.6  Comparison 14 Volunteer‐facilitated versus professional SLT, Outcome 6 Expressive language: repetition. | ||||
| 6.1 AAT repetition subtest | 1 | Mean Difference (IV, Fixed, 95% CI) | 0.0 [0.0, 0.0] | |
| 7 Expressive language: written Show forest plot | 2 | Std. Mean Difference (IV, Fixed, 95% CI) | Totals not selected | |
| Analysis 14.7 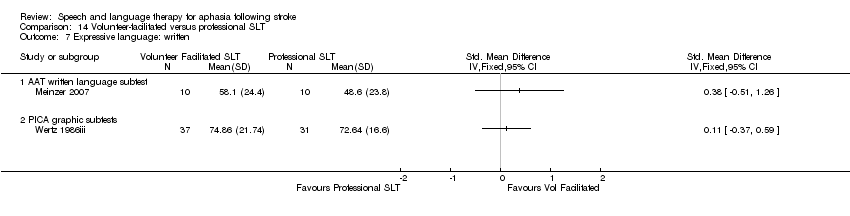 Comparison 14 Volunteer‐facilitated versus professional SLT, Outcome 7 Expressive language: written. | ||||
| 7.1 AAT written language subtest | 1 | Std. Mean Difference (IV, Fixed, 95% CI) | 0.0 [0.0, 0.0] | |
| 7.2 PICA graphic subtests | 1 | Std. Mean Difference (IV, Fixed, 95% CI) | 0.0 [0.0, 0.0] | |
| 8 Severity of impairment: Aphasia Battery Score Show forest plot | 3 | 126 | Std. Mean Difference (IV, Fixed, 95% CI) | ‐0.12 [‐0.47, 0.23] |
| Analysis 14.8 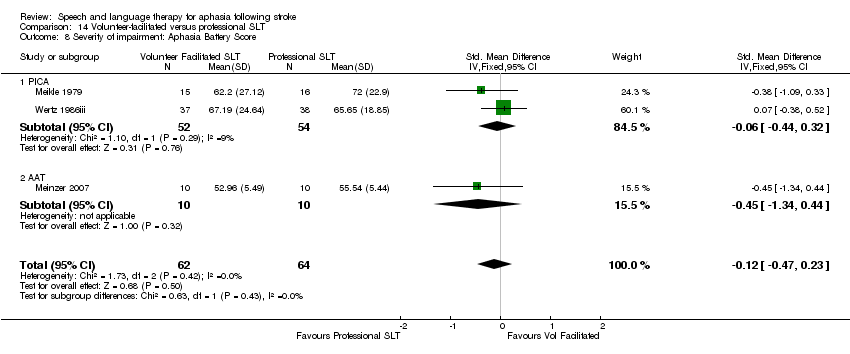 Comparison 14 Volunteer‐facilitated versus professional SLT, Outcome 8 Severity of impairment: Aphasia Battery Score. | ||||
| 8.1 PICA | 2 | 106 | Std. Mean Difference (IV, Fixed, 95% CI) | ‐0.06 [‐0.44, 0.32] |
| 8.2 AAT | 1 | 20 | Std. Mean Difference (IV, Fixed, 95% CI) | ‐0.45 [‐1.34, 0.44] |
| 9 Number of dropouts for any reason Show forest plot | 3 | 206 | Odds Ratio (M‐H, Random, 95% CI) | 0.95 [0.49, 1.85] |
| Analysis 14.9 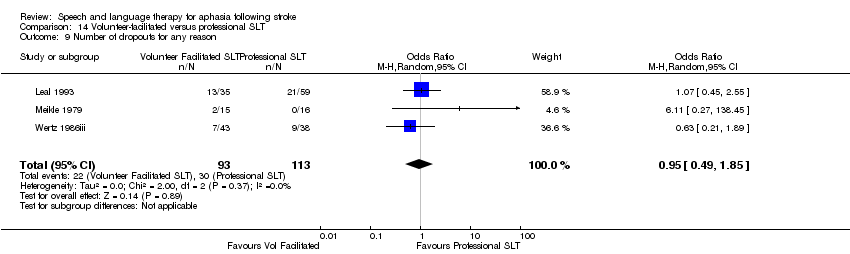 Comparison 14 Volunteer‐facilitated versus professional SLT, Outcome 9 Number of dropouts for any reason. | ||||
| 10 Adherence to allocated intervention Show forest plot | 2 | 125 | Odds Ratio (M‐H, Random, 95% CI) | 1.98 [0.52, 7.46] |
| Analysis 14.10  Comparison 14 Volunteer‐facilitated versus professional SLT, Outcome 10 Adherence to allocated intervention. | ||||
| Outcome or subgroup title | No. of studies | No. of participants | Statistical method | Effect size |
| 1 Functional communication Show forest plot | 3 | 55 | Std. Mean Difference (IV, Fixed, 95% CI) | 0.44 [‐0.10, 0.98] |
| Analysis 15.1  Comparison 15 Computer‐mediated versus professional SLT, Outcome 1 Functional communication. | ||||
| 1.1 Pragmatic Protocol | 1 | 20 | Std. Mean Difference (IV, Fixed, 95% CI) | 0.24 [‐0.64, 1.12] |
| 1.2 Discourse (content information units per minute) | 1 | 25 | Std. Mean Difference (IV, Fixed, 95% CI) | 0.62 [‐0.19, 1.44] |
| 1.3 Discourse conversation: content words per turn | 1 | 10 | Std. Mean Difference (IV, Fixed, 95% CI) | 0.40 [‐0.86, 1.66] |
| 2 Receptive language Show forest plot | 2 | Std. Mean Difference (IV, Fixed, 95% CI) | Totals not selected | |
| Analysis 15.2  Comparison 15 Computer‐mediated versus professional SLT, Outcome 2 Receptive language. | ||||
| 2.1 WAB (reading comprehension) | 1 | Std. Mean Difference (IV, Fixed, 95% CI) | 0.0 [0.0, 0.0] | |
| 2.2 PICA gestural subtest | 1 | Std. Mean Difference (IV, Fixed, 95% CI) | 0.0 [0.0, 0.0] | |
| 2.3 Token Test (auditory comprehension) | 1 | Std. Mean Difference (IV, Fixed, 95% CI) | 0.0 [0.0, 0.0] | |
| 3 Expressive language Show forest plot | 2 | Std. Mean Difference (IV, Random, 95% CI) | Totals not selected | |
| Analysis 15.3 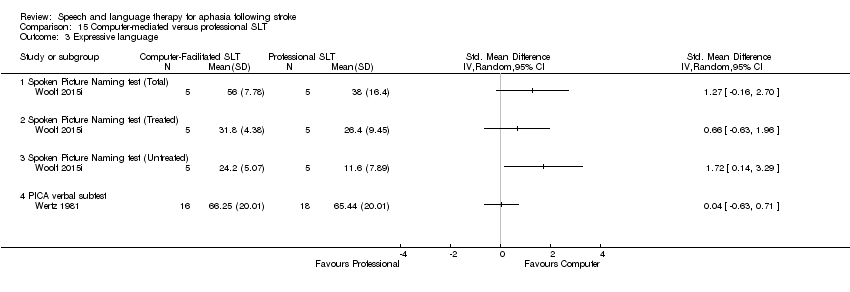 Comparison 15 Computer‐mediated versus professional SLT, Outcome 3 Expressive language. | ||||
| 3.1 Spoken Picture Naming test (Total) | 1 | Std. Mean Difference (IV, Random, 95% CI) | 0.0 [0.0, 0.0] | |
| 3.2 Spoken Picture Naming test (Treated) | 1 | Std. Mean Difference (IV, Random, 95% CI) | 0.0 [0.0, 0.0] | |
| 3.3 Spoken Picture Naming test (Untreated) | 1 | Std. Mean Difference (IV, Random, 95% CI) | 0.0 [0.0, 0.0] | |
| 3.4 PICA verbal subtest | 1 | Std. Mean Difference (IV, Random, 95% CI) | 0.0 [0.0, 0.0] | |
| 4 Expressive language: written Show forest plot | 2 | 59 | Std. Mean Difference (IV, Random, 95% CI) | ‐0.09 [‐0.61, 0.42] |
| Analysis 15.4  Comparison 15 Computer‐mediated versus professional SLT, Outcome 4 Expressive language: written. | ||||
| 4.1 WAB (writing) | 1 | 25 | Std. Mean Difference (IV, Random, 95% CI) | 0.16 [‐0.64, 0.95] |
| 4.2 PICA graphic | 1 | 34 | Std. Mean Difference (IV, Random, 95% CI) | ‐0.27 [‐0.95, 0.41] |
| 5 Severity of impairment Show forest plot | 2 | 59 | Std. Mean Difference (IV, Random, 95% CI) | 0.21 [‐0.40, 0.82] |
| Analysis 15.5  Comparison 15 Computer‐mediated versus professional SLT, Outcome 5 Severity of impairment. | ||||
| 5.1 WABAQ | 1 | 25 | Std. Mean Difference (IV, Random, 95% CI) | 0.57 [‐0.24, 1.38] |
| 5.2 PICA overall | 1 | 34 | Std. Mean Difference (IV, Random, 95% CI) | ‐0.06 [‐0.73, 0.61] |
| 6 Number of dropouts for any reason Show forest plot | 1 | 67 | Odds Ratio (M‐H, Random, 95% CI) | 0.94 [0.36, 2.46] |
| Analysis 15.6 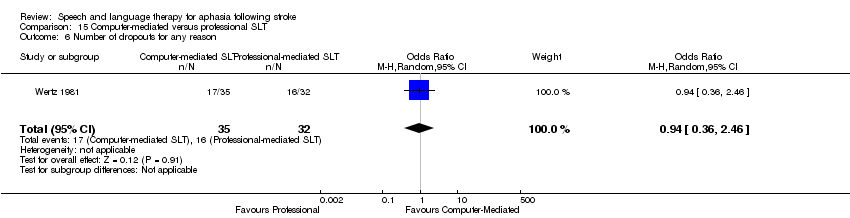 Comparison 15 Computer‐mediated versus professional SLT, Outcome 6 Number of dropouts for any reason. | ||||
| Outcome or subgroup title | No. of studies | No. of participants | Statistical method | Effect size |
| 1 Functional communication (6 weeks) Show forest plot | 1 | Std. Mean Difference (IV, Fixed, 95% CI) | Totals not selected | |
| Analysis 16.1  Comparison 16 Computer‐mediated versus professional SLT (follow‐up), Outcome 1 Functional communication (6 weeks). | ||||
| 1.1 Discourse conversation: substantive turns | 1 | Std. Mean Difference (IV, Fixed, 95% CI) | 0.0 [0.0, 0.0] | |
| 1.2 Discourse conversation: content words per turn | 1 | Std. Mean Difference (IV, Fixed, 95% CI) | 0.0 [0.0, 0.0] | |
| 1.3 Discourse conversation: nouns per turn | 1 | Std. Mean Difference (IV, Fixed, 95% CI) | 0.0 [0.0, 0.0] | |
| 2 Expressive language: naming (6 weeks) Show forest plot | 1 | Mean Difference (IV, Fixed, 95% CI) | Totals not selected | |
| Analysis 16.2  Comparison 16 Computer‐mediated versus professional SLT (follow‐up), Outcome 2 Expressive language: naming (6 weeks). | ||||
| 2.1 Spoken Picture Naming test (total) | 1 | Mean Difference (IV, Fixed, 95% CI) | 0.0 [0.0, 0.0] | |
| 2.2 Spoken Picture Naming test (treated) | 1 | Mean Difference (IV, Fixed, 95% CI) | 0.0 [0.0, 0.0] | |
| 2.3 Spoken Picture Naming test (untreated) | 1 | Mean Difference (IV, Fixed, 95% CI) | 0.0 [0.0, 0.0] | |
| Outcome or subgroup title | No. of studies | No. of participants | Statistical method | Effect size |
| 1 Functional communication Show forest plot | 3 | 142 | Std. Mean Difference (IV, Random, 95% CI) | 0.02 [‐0.37, 0.40] |
| Analysis 17.1 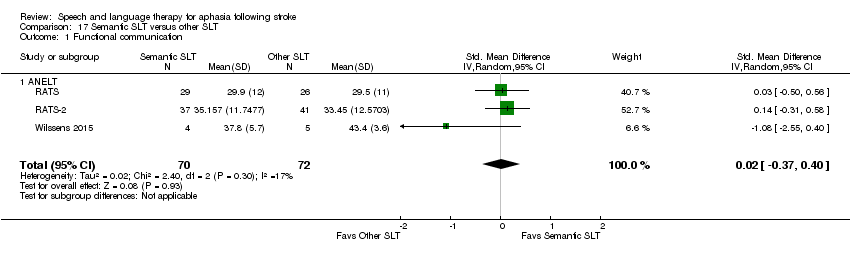 Comparison 17 Semantic SLT versus other SLT, Outcome 1 Functional communication. | ||||
| 1.1 ANELT | 3 | 142 | Std. Mean Difference (IV, Random, 95% CI) | 0.02 [‐0.37, 0.40] |
| 2 Receptive language: auditory comprehension Show forest plot | 2 | Std. Mean Difference (IV, Random, 95% CI) | Subtotals only | |
| Analysis 17.2 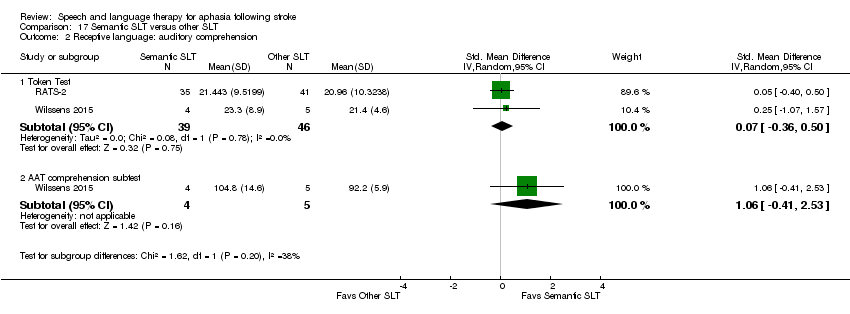 Comparison 17 Semantic SLT versus other SLT, Outcome 2 Receptive language: auditory comprehension. | ||||
| 2.1 Token Test | 2 | 85 | Std. Mean Difference (IV, Random, 95% CI) | 0.07 [‐0.36, 0.50] |
| 2.2 AAT comprehension subtest | 1 | 9 | Std. Mean Difference (IV, Random, 95% CI) | 1.06 [‐0.41, 2.53] |
| 3 Receptive language: other Show forest plot | 3 | Std. Mean Difference (IV, Random, 95% CI) | Subtotals only | |
| Analysis 17.3  Comparison 17 Semantic SLT versus other SLT, Outcome 3 Receptive language: other. | ||||
| 3.1 Semantic Association Test (verbal) | 3 | 120 | Std. Mean Difference (IV, Random, 95% CI) | 0.31 [‐0.05, 0.67] |
| 3.2 Semantic Association (PALPA) | 2 | 85 | Std. Mean Difference (IV, Random, 95% CI) | ‐0.09 [‐0.51, 0.34] |
| 3.3 Auditory Lexical Decision (PALPA) | 3 | 132 | Std. Mean Difference (IV, Random, 95% CI) | ‐0.37 [‐1.09, 0.34] |
| 3.4 Auditory Synonym Judgement | 1 | 9 | Std. Mean Difference (IV, Random, 95% CI) | 0.42 [‐0.92, 1.76] |
| 4 Expressive language: naming Show forest plot | 1 | Std. Mean Difference (IV, Random, 95% CI) | Totals not selected | |
| Analysis 17.4 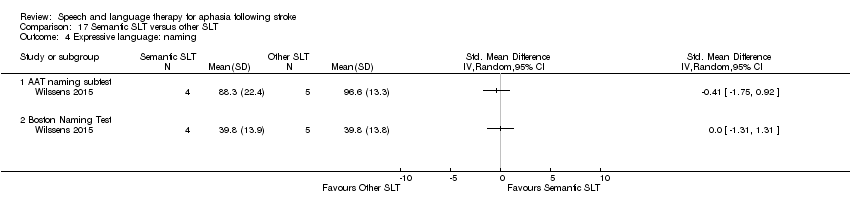 Comparison 17 Semantic SLT versus other SLT, Outcome 4 Expressive language: naming. | ||||
| 4.1 AAT naming subtest | 1 | Std. Mean Difference (IV, Random, 95% CI) | 0.0 [0.0, 0.0] | |
| 4.2 Boston Naming Test | 1 | Std. Mean Difference (IV, Random, 95% CI) | 0.0 [0.0, 0.0] | |
| 5 Expressive language: written Show forest plot | 1 | Mean Difference (IV, Fixed, 95% CI) | Totals not selected | |
| Analysis 17.5 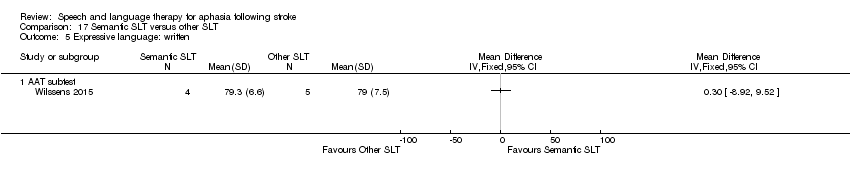 Comparison 17 Semantic SLT versus other SLT, Outcome 5 Expressive language: written. | ||||
| 5.1 AAT subtest | 1 | Mean Difference (IV, Fixed, 95% CI) | 0.0 [0.0, 0.0] | |
| 6 Expressive language: repetition Show forest plot | 2 | Std. Mean Difference (IV, Random, 95% CI) | Subtotals only | |
| Analysis 17.6  Comparison 17 Semantic SLT versus other SLT, Outcome 6 Expressive language: repetition. | ||||
| 6.1 Non‐word repetition (PALPA) | 2 | 85 | Std. Mean Difference (IV, Random, 95% CI) | 0.31 [‐0.12, 0.73] |
| 6.2 AAT repetition subtest | 1 | 9 | Std. Mean Difference (IV, Random, 95% CI) | 0.20 [‐1.12, 1.52] |
| 7 Expressive language: fluency Show forest plot | 1 | Std. Mean Difference (IV, Fixed, 95% CI) | Totals not selected | |
| Analysis 17.7  Comparison 17 Semantic SLT versus other SLT, Outcome 7 Expressive language: fluency. | ||||
| 7.1 Word fluency (letters) | 1 | Std. Mean Difference (IV, Fixed, 95% CI) | 0.0 [0.0, 0.0] | |
| 7.2 Word fluency (semantic) | 1 | Std. Mean Difference (IV, Fixed, 95% CI) | 0.0 [0.0, 0.0] | |
| 8 Number of dropouts for any reason Show forest plot | 2 | 143 | Odds Ratio (M‐H, Fixed, 95% CI) | 0.83 [0.33, 2.09] |
| Analysis 17.8  Comparison 17 Semantic SLT versus other SLT, Outcome 8 Number of dropouts for any reason. | ||||
| 9 Adherence to allocated intervention Show forest plot | 2 | 143 | Odds Ratio (M‐H, Fixed, 95% CI) | 1.05 [0.37, 2.97] |
| Analysis 17.9  Comparison 17 Semantic SLT versus other SLT, Outcome 9 Adherence to allocated intervention. | ||||
| Outcome or subgroup title | No. of studies | No. of participants | Statistical method | Effect size |
| 1 Functional communication Show forest plot | 3 | 126 | Std. Mean Difference (IV, Random, 95% CI) | 0.15 [‐0.21, 0.50] |
| Analysis 18.1 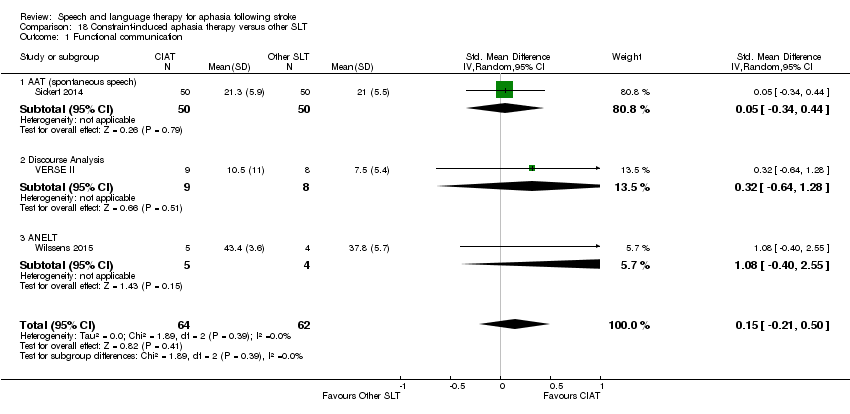 Comparison 18 Constraint‐induced aphasia therapy versus other SLT, Outcome 1 Functional communication. | ||||
| 1.1 AAT (spontaneous speech) | 1 | 100 | Std. Mean Difference (IV, Random, 95% CI) | 0.05 [‐0.34, 0.44] |
| 1.2 Discourse Analysis | 1 | 17 | Std. Mean Difference (IV, Random, 95% CI) | 0.32 [‐0.64, 1.28] |
| 1.3 ANELT | 1 | 9 | Std. Mean Difference (IV, Random, 95% CI) | 1.08 [‐0.40, 2.55] |
| 2 Receptive language: auditory comprehension Show forest plot | 3 | Std. Mean Difference (IV, Random, 95% CI) | Subtotals only | |
| Analysis 18.2  Comparison 18 Constraint‐induced aphasia therapy versus other SLT, Outcome 2 Receptive language: auditory comprehension. | ||||
| 2.1 Token Test | 3 | 126 | Std. Mean Difference (IV, Random, 95% CI) | ‐0.04 [‐0.39, 0.31] |
| 2.2 AAT comprehension subtest | 3 | 126 | Std. Mean Difference (IV, Random, 95% CI) | ‐0.04 [‐0.61, 0.52] |
| 3 Receptive language: other Show forest plot | 1 | Std. Mean Difference (IV, Random, 95% CI) | Totals not selected | |
| Analysis 18.3 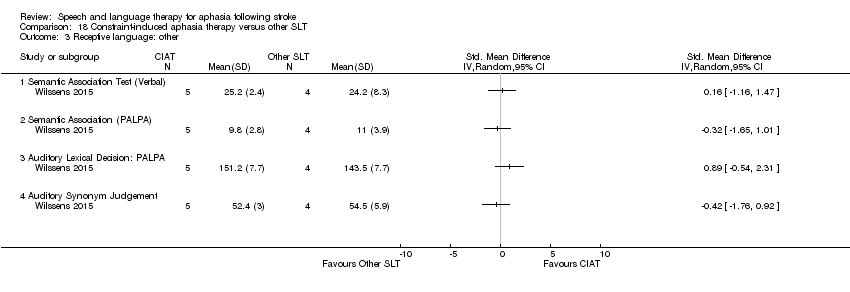 Comparison 18 Constraint‐induced aphasia therapy versus other SLT, Outcome 3 Receptive language: other. | ||||
| 3.1 Semantic Association Test (Verbal) | 1 | Std. Mean Difference (IV, Random, 95% CI) | 0.0 [0.0, 0.0] | |
| 3.2 Semantic Association (PALPA) | 1 | Std. Mean Difference (IV, Random, 95% CI) | 0.0 [0.0, 0.0] | |
| 3.3 Auditory Lexical Decision: PALPA | 1 | Std. Mean Difference (IV, Random, 95% CI) | 0.0 [0.0, 0.0] | |
| 3.4 Auditory Synonym Judgement | 1 | Std. Mean Difference (IV, Random, 95% CI) | 0.0 [0.0, 0.0] | |
| 4 Expressive language: naming Show forest plot | 3 | Std. Mean Difference (IV, Random, 95% CI) | Subtotals only | |
| Analysis 18.4 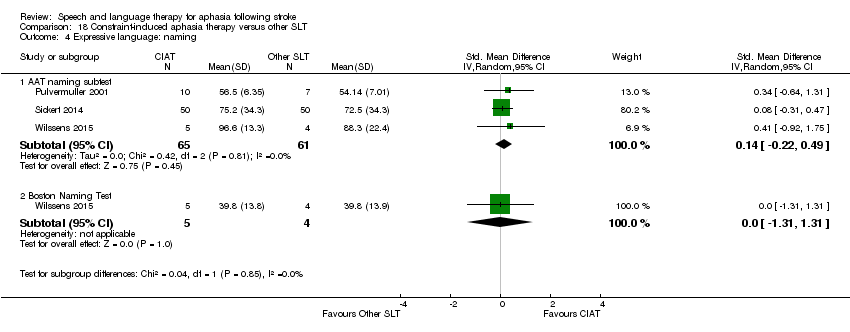 Comparison 18 Constraint‐induced aphasia therapy versus other SLT, Outcome 4 Expressive language: naming. | ||||
| 4.1 AAT naming subtest | 3 | 126 | Std. Mean Difference (IV, Random, 95% CI) | 0.14 [‐0.22, 0.49] |
| 4.2 Boston Naming Test | 1 | 9 | Std. Mean Difference (IV, Random, 95% CI) | 0.0 [‐1.31, 1.31] |
| 5 Expressive language: repetition Show forest plot | 3 | Std. Mean Difference (IV, Random, 95% CI) | Subtotals only | |
| Analysis 18.5  Comparison 18 Constraint‐induced aphasia therapy versus other SLT, Outcome 5 Expressive language: repetition. | ||||
| 5.1 AAT repetition subtest | 3 | 126 | Std. Mean Difference (IV, Random, 95% CI) | ‐0.02 [‐0.37, 0.33] |
| 5.2 Non‐words: PALPA | 1 | 9 | Std. Mean Difference (IV, Random, 95% CI) | 0.27 [‐1.06, 1.59] |
| 6 Expressive language: written Show forest plot | 2 | Mean Difference (IV, Random, 95% CI) | Subtotals only | |
| Analysis 18.6  Comparison 18 Constraint‐induced aphasia therapy versus other SLT, Outcome 6 Expressive language: written. | ||||
| 6.1 AAT written language subtest | 2 | 109 | Mean Difference (IV, Random, 95% CI) | ‐1.96 [‐9.08, 5.16] |
| 7 Quality of life Show forest plot | 1 | Mean Difference (IV, Fixed, 95% CI) | Totals not selected | |
| Analysis 18.7 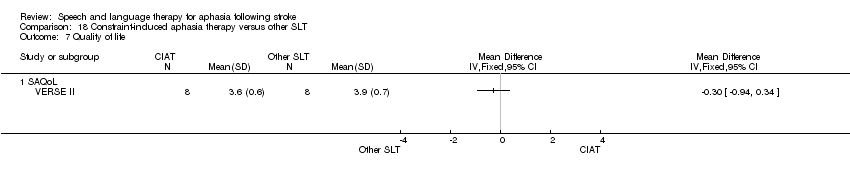 Comparison 18 Constraint‐induced aphasia therapy versus other SLT, Outcome 7 Quality of life. | ||||
| 7.1 SAQoL | 1 | Mean Difference (IV, Fixed, 95% CI) | 0.0 [0.0, 0.0] | |
| 8 Severity of impairment Show forest plot | 2 | 34 | Std. Mean Difference (IV, Random, 95% CI) | 0.11 [‐0.57, 0.79] |
| Analysis 18.8 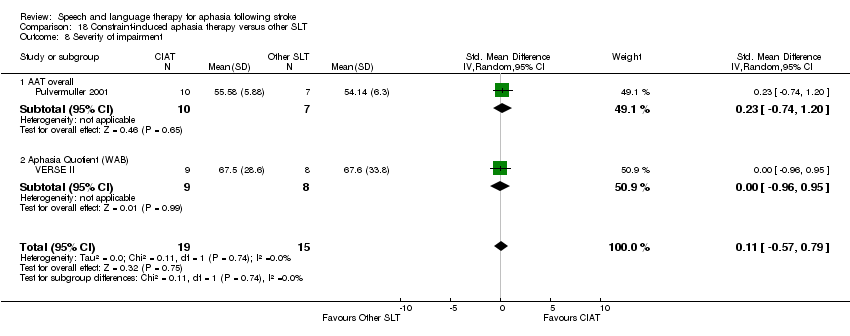 Comparison 18 Constraint‐induced aphasia therapy versus other SLT, Outcome 8 Severity of impairment. | ||||
| 8.1 AAT overall | 1 | 17 | Std. Mean Difference (IV, Random, 95% CI) | 0.23 [‐0.74, 1.20] |
| 8.2 Aphasia Quotient (WAB) | 1 | 17 | Std. Mean Difference (IV, Random, 95% CI) | ‐0.00 [‐0.96, 0.95] |
| Outcome or subgroup title | No. of studies | No. of participants | Statistical method | Effect size |
| 1 Functional communication Show forest plot | 1 | Std. Mean Difference (IV, Random, 95% CI) | Totals not selected | |
| Analysis 19.1  Comparison 19 Constraint‐induced aphasia therapy versus other SLT (follow‐up), Outcome 1 Functional communication. | ||||
| 1.1 Discourse Analysis score (12 weeks) | 1 | Std. Mean Difference (IV, Random, 95% CI) | 0.0 [0.0, 0.0] | |
| 1.2 Discourse Analysis score (26 weeks) | 1 | Std. Mean Difference (IV, Random, 95% CI) | 0.0 [0.0, 0.0] | |
| 2 Quality of life Show forest plot | 1 | Mean Difference (IV, Fixed, 95% CI) | Totals not selected | |
| Analysis 19.2  Comparison 19 Constraint‐induced aphasia therapy versus other SLT (follow‐up), Outcome 2 Quality of life. | ||||
| 2.1 SAQoL (12 weeks) | 1 | Mean Difference (IV, Fixed, 95% CI) | 0.0 [0.0, 0.0] | |
| 2.2 SAQoL (26 weeks) | 1 | Mean Difference (IV, Fixed, 95% CI) | 0.0 [0.0, 0.0] | |
| 3 Severity of impairment Show forest plot | 1 | Mean Difference (IV, Random, 95% CI) | Totals not selected | |
| Analysis 19.3  Comparison 19 Constraint‐induced aphasia therapy versus other SLT (follow‐up), Outcome 3 Severity of impairment. | ||||
| 3.1 Aphasia Quotient (WAB) (12 weeks) | 1 | Mean Difference (IV, Random, 95% CI) | 0.0 [0.0, 0.0] | |
| 3.2 Aphasia Quotient (WAB) (26 weeks) | 1 | Mean Difference (IV, Random, 95% CI) | 0.0 [0.0, 0.0] | |
| Outcome or subgroup title | No. of studies | No. of participants | Statistical method | Effect size |
| 1 Functional communication Show forest plot | 1 | Std. Mean Difference (IV, Random, 95% CI) | Totals not selected | |
| Analysis 20.1 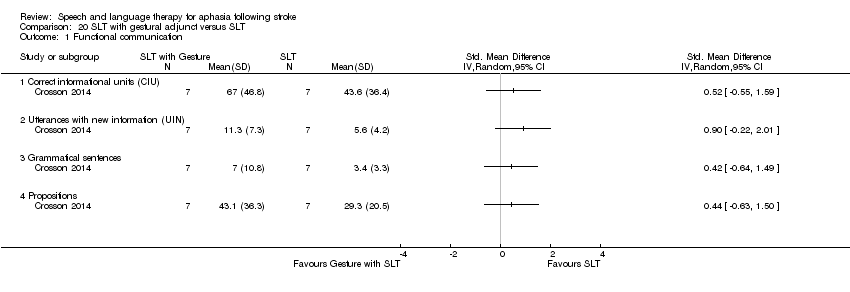 Comparison 20 SLT with gestural adjunct versus SLT, Outcome 1 Functional communication. | ||||
| 1.1 Correct informational units (CIU) | 1 | Std. Mean Difference (IV, Random, 95% CI) | 0.0 [0.0, 0.0] | |
| 1.2 Utterances with new information (UIN) | 1 | Std. Mean Difference (IV, Random, 95% CI) | 0.0 [0.0, 0.0] | |
| 1.3 Grammatical sentences | 1 | Std. Mean Difference (IV, Random, 95% CI) | 0.0 [0.0, 0.0] | |
| 1.4 Propositions | 1 | Std. Mean Difference (IV, Random, 95% CI) | 0.0 [0.0, 0.0] | |
| 2 Expressive language Show forest plot | 1 | Std. Mean Difference (IV, Random, 95% CI) | Totals not selected | |
| Analysis 20.2  Comparison 20 SLT with gestural adjunct versus SLT, Outcome 2 Expressive language. | ||||
| 2.1 Picture‐naming probes | 1 | Std. Mean Difference (IV, Random, 95% CI) | 0.0 [0.0, 0.0] | |
| 2.2 Boston Naming Test | 1 | Std. Mean Difference (IV, Random, 95% CI) | 0.0 [0.0, 0.0] | |
| 2.3 Category Generation Probes | 1 | Std. Mean Difference (IV, Random, 95% CI) | 0.0 [0.0, 0.0] | |
| 3 Severity of impairment: Aphasia Battery Score Show forest plot | 1 | Mean Difference (IV, Fixed, 95% CI) | Totals not selected | |
| Analysis 20.3  Comparison 20 SLT with gestural adjunct versus SLT, Outcome 3 Severity of impairment: Aphasia Battery Score. | ||||
| 3.1 WAB Aphasia Quotient | 1 | Mean Difference (IV, Fixed, 95% CI) | 0.0 [0.0, 0.0] | |
| 4 Functional communication (follow‐up) Show forest plot | 1 | Std. Mean Difference (IV, Fixed, 95% CI) | Totals not selected | |
| Analysis 20.4  Comparison 20 SLT with gestural adjunct versus SLT, Outcome 4 Functional communication (follow‐up). | ||||
| 4.1 Correct informational units (CIU) | 1 | Std. Mean Difference (IV, Fixed, 95% CI) | 0.0 [0.0, 0.0] | |
| 4.2 Utterances with new information (UIN) | 1 | Std. Mean Difference (IV, Fixed, 95% CI) | 0.0 [0.0, 0.0] | |
| 4.3 Grammatical sentences | 1 | Std. Mean Difference (IV, Fixed, 95% CI) | 0.0 [0.0, 0.0] | |
| 4.4 Propositions | 1 | Std. Mean Difference (IV, Fixed, 95% CI) | 0.0 [0.0, 0.0] | |
| 5 Expressive language: (follow‐up) Show forest plot | 1 | Std. Mean Difference (IV, Fixed, 95% CI) | Totals not selected | |
| Analysis 20.5  Comparison 20 SLT with gestural adjunct versus SLT, Outcome 5 Expressive language: (follow‐up). | ||||
| 5.1 Picture‐naming probes (3 month follow‐up) | 1 | Std. Mean Difference (IV, Fixed, 95% CI) | 0.0 [0.0, 0.0] | |
| 5.2 Boston Naming Test (3 month follow‐up) | 1 | Std. Mean Difference (IV, Fixed, 95% CI) | 0.0 [0.0, 0.0] | |
| 5.3 Category Generation Probes (3 month follow‐up) | 1 | Std. Mean Difference (IV, Fixed, 95% CI) | 0.0 [0.0, 0.0] | |
| 6 Severity of impairment: Aphasia Battery Score (follow‐up) Show forest plot | 1 | Mean Difference (IV, Fixed, 95% CI) | Totals not selected | |
| Analysis 20.6  Comparison 20 SLT with gestural adjunct versus SLT, Outcome 6 Severity of impairment: Aphasia Battery Score (follow‐up). | ||||
| 6.1 WAB Aphasia Quotient (3 month follow‐up) | 1 | Mean Difference (IV, Fixed, 95% CI) | 0.0 [0.0, 0.0] | |
| Outcome or subgroup title | No. of studies | No. of participants | Statistical method | Effect size |
| 1 Functional communication Show forest plot | 1 | Std. Mean Difference (IV, Fixed, 95% CI) | Totals not selected | |
| Analysis 21.1 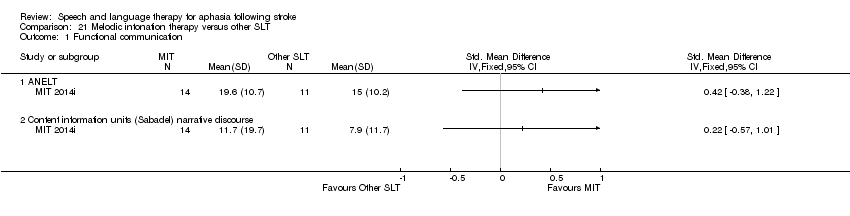 Comparison 21 Melodic intonation therapy versus other SLT, Outcome 1 Functional communication. | ||||
| 1.1 ANELT | 1 | Std. Mean Difference (IV, Fixed, 95% CI) | 0.0 [0.0, 0.0] | |
| 1.2 Content information units (Sabadel) narrative discourse | 1 | Std. Mean Difference (IV, Fixed, 95% CI) | 0.0 [0.0, 0.0] | |
| 2 Expressive language: naming Show forest plot | 1 | Mean Difference (IV, Fixed, 95% CI) | Totals not selected | |
| Analysis 21.2  Comparison 21 Melodic intonation therapy versus other SLT, Outcome 2 Expressive language: naming. | ||||
| 2.1 AAT naming subtest | 1 | Mean Difference (IV, Fixed, 95% CI) | 0.0 [0.0, 0.0] | |
| 3 Expressive language: repetition Show forest plot | 1 | Std. Mean Difference (IV, Random, 95% CI) | Totals not selected | |
| Analysis 21.3  Comparison 21 Melodic intonation therapy versus other SLT, Outcome 3 Expressive language: repetition. | ||||
| 3.1 AAT repetition subtest | 1 | Std. Mean Difference (IV, Random, 95% CI) | 0.0 [0.0, 0.0] | |
| 3.2 MIT repetition (trained Items) | 1 | Std. Mean Difference (IV, Random, 95% CI) | 0.0 [0.0, 0.0] | |
| 3.3 MIT repetition (untrained items) | 1 | Std. Mean Difference (IV, Random, 95% CI) | 0.0 [0.0, 0.0] | |
| 4 Number of dropouts for any reason Show forest plot | 1 | Odds Ratio (M‐H, Random, 95% CI) | Totals not selected | |
| Analysis 21.4  Comparison 21 Melodic intonation therapy versus other SLT, Outcome 4 Number of dropouts for any reason. | ||||
| Outcome or subgroup title | No. of studies | No. of participants | Statistical method | Effect size |
| 1 Functional communication Show forest plot | 1 | Mean Difference (IV, Fixed, 95% CI) | Totals not selected | |
| Analysis 22.1 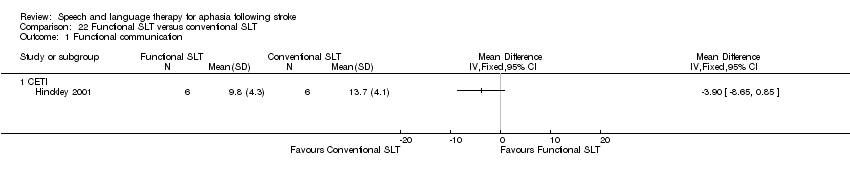 Comparison 22 Functional SLT versus conventional SLT, Outcome 1 Functional communication. | ||||
| 1.1 CETI | 1 | Mean Difference (IV, Fixed, 95% CI) | 0.0 [0.0, 0.0] | |
| Outcome or subgroup title | No. of studies | No. of participants | Statistical method | Effect size |
| 1 Receptive language: auditory comprehension Show forest plot | 3 | Std. Mean Difference (IV, Fixed, 95% CI) | Subtotals only | |
| Analysis 23.1 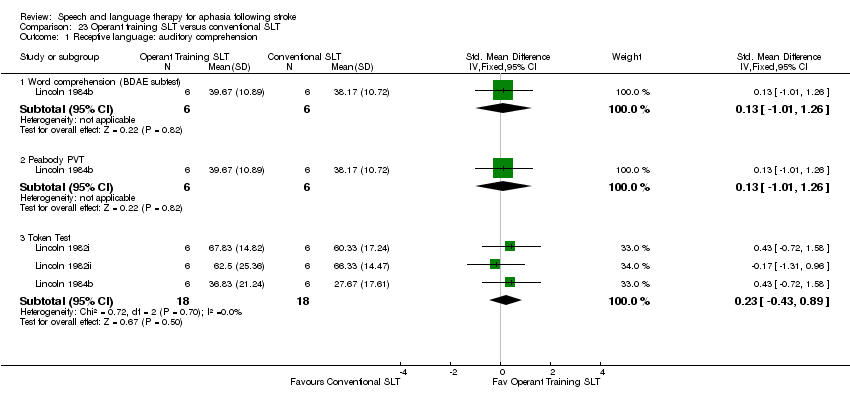 Comparison 23 Operant training SLT versus conventional SLT, Outcome 1 Receptive language: auditory comprehension. | ||||
| 1.1 Word comprehension (BDAE subtest) | 1 | 12 | Std. Mean Difference (IV, Fixed, 95% CI) | 0.13 [‐1.01, 1.26] |
| 1.2 Peabody PVT | 1 | 12 | Std. Mean Difference (IV, Fixed, 95% CI) | 0.13 [‐1.01, 1.26] |
| 1.3 Token Test | 3 | 36 | Std. Mean Difference (IV, Fixed, 95% CI) | 0.23 [‐0.43, 0.89] |
| 2 Receptive language: other Show forest plot | 3 | Mean Difference (IV, Fixed, 95% CI) | Subtotals only | |
| Analysis 23.2  Comparison 23 Operant training SLT versus conventional SLT, Outcome 2 Receptive language: other. | ||||
| 2.1 PICA gestural subtest | 3 | 36 | Mean Difference (IV, Fixed, 95% CI) | ‐0.29 [‐0.97, 0.39] |
| 3 Expressive language: spoken Show forest plot | 3 | Std. Mean Difference (IV, Fixed, 95% CI) | Subtotals only | |
| Analysis 23.3 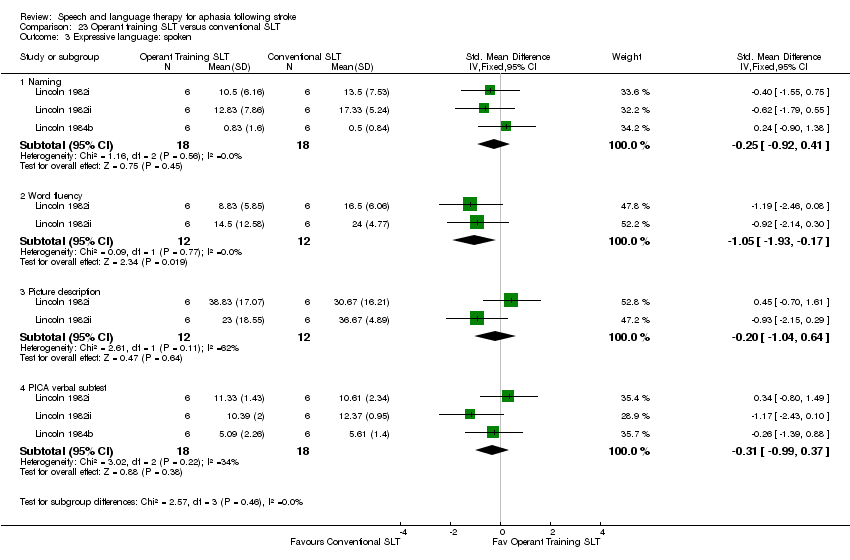 Comparison 23 Operant training SLT versus conventional SLT, Outcome 3 Expressive language: spoken. | ||||
| 3.1 Naming | 3 | 36 | Std. Mean Difference (IV, Fixed, 95% CI) | ‐0.25 [‐0.92, 0.41] |
| 3.2 Word fluency | 2 | 24 | Std. Mean Difference (IV, Fixed, 95% CI) | ‐1.05 [‐1.93, ‐0.17] |
| 3.3 Picture description | 2 | 24 | Std. Mean Difference (IV, Fixed, 95% CI) | ‐0.20 [‐1.04, 0.64] |
| 3.4 PICA verbal subtest | 3 | 36 | Std. Mean Difference (IV, Fixed, 95% CI) | ‐0.31 [‐0.99, 0.37] |
| 4 Expressive language: written Show forest plot | 3 | Mean Difference (IV, Fixed, 95% CI) | Subtotals only | |
| Analysis 23.4  Comparison 23 Operant training SLT versus conventional SLT, Outcome 4 Expressive language: written. | ||||
| 4.1 PICA graphic subtest | 3 | 36 | Mean Difference (IV, Fixed, 95% CI) | ‐0.85 [‐1.69, ‐0.01] |
| 5 Severity of impairment Show forest plot | 3 | Mean Difference (IV, Fixed, 95% CI) | Subtotals only | |
| Analysis 23.5  Comparison 23 Operant training SLT versus conventional SLT, Outcome 5 Severity of impairment. | ||||
| 5.1 PICA overall | 3 | 36 | Mean Difference (IV, Fixed, 95% CI) | ‐0.74 [‐1.50, 0.01] |
| Outcome or subgroup title | No. of studies | No. of participants | Statistical method | Effect size |
| 1 Receptive language: auditory comprehension Show forest plot | 1 | Mean Difference (IV, Fixed, 95% CI) | Totals not selected | |
| Analysis 24.1  Comparison 24 Verb comprehension SLT versus preposition comprehension SLT, Outcome 1 Receptive language: auditory comprehension. | ||||
| 1.1 WAB auditory comprehension | 1 | Mean Difference (IV, Fixed, 95% CI) | 0.0 [0.0, 0.0] | |
| 2 Receptive language: reading Show forest plot | 1 | Std. Mean Difference (IV, Fixed, 95% CI) | Totals not selected | |
| Analysis 24.2  Comparison 24 Verb comprehension SLT versus preposition comprehension SLT, Outcome 2 Receptive language: reading. | ||||
| 2.1 Computer‐based verb Test (treated items) | 1 | Std. Mean Difference (IV, Fixed, 95% CI) | 0.0 [0.0, 0.0] | |
| 2.2 Computer‐based verb test (untreated items) | 1 | Std. Mean Difference (IV, Fixed, 95% CI) | 0.0 [0.0, 0.0] | |
| 2.3 Real World Verb Test (treated items) | 1 | Std. Mean Difference (IV, Fixed, 95% CI) | 0.0 [0.0, 0.0] | |
| 2.4 Real World Verb Test (untreated items) | 1 | Std. Mean Difference (IV, Fixed, 95% CI) | 0.0 [0.0, 0.0] | |
| 2.5 Computer‐based preposition test (treated items) | 1 | Std. Mean Difference (IV, Fixed, 95% CI) | 0.0 [0.0, 0.0] | |
| 2.6 Computer‐based preposition test (untreated items) | 1 | Std. Mean Difference (IV, Fixed, 95% CI) | 0.0 [0.0, 0.0] | |
| 2.7 Real World Preposition Test (treated items) | 1 | Std. Mean Difference (IV, Fixed, 95% CI) | 0.0 [0.0, 0.0] | |
| 2.8 Real World Preposition Test (untreated items) | 1 | Std. Mean Difference (IV, Fixed, 95% CI) | 0.0 [0.0, 0.0] | |
| 2.9 Morphology | 1 | Std. Mean Difference (IV, Fixed, 95% CI) | 0.0 [0.0, 0.0] | |
| 3 Expressive language Show forest plot | 1 | Std. Mean Difference (IV, Fixed, 95% CI) | Totals not selected | |
| Analysis 24.3  Comparison 24 Verb comprehension SLT versus preposition comprehension SLT, Outcome 3 Expressive language. | ||||
| 3.1 WAB naming subtest | 1 | Std. Mean Difference (IV, Fixed, 95% CI) | 0.0 [0.0, 0.0] | |
| 3.2 WAB fluency subtest | 1 | Std. Mean Difference (IV, Fixed, 95% CI) | 0.0 [0.0, 0.0] | |
| 3.3 WAB repetition subtest | 1 | Std. Mean Difference (IV, Fixed, 95% CI) | 0.0 [0.0, 0.0] | |
| 4 Severity of impairment: Aphasia Battery Score Show forest plot | 1 | Mean Difference (IV, Fixed, 95% CI) | Totals not selected | |
| Analysis 24.4 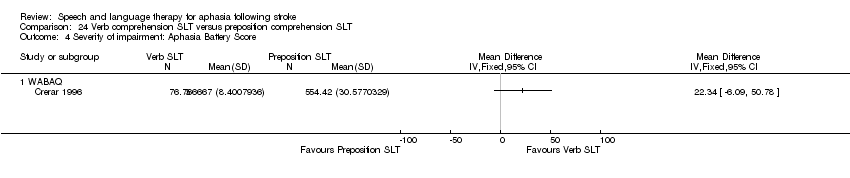 Comparison 24 Verb comprehension SLT versus preposition comprehension SLT, Outcome 4 Severity of impairment: Aphasia Battery Score. | ||||
| 4.1 WABAQ | 1 | Mean Difference (IV, Fixed, 95% CI) | 0.0 [0.0, 0.0] | |
| Outcome or subgroup title | No. of studies | No. of participants | Statistical method | Effect size |
| 1 Functional communication Show forest plot | 1 | Mean Difference (IV, Fixed, 95% CI) | Totals not selected | |
| Analysis 25.1  Comparison 25 Discourse therapy versus conventional therapy, Outcome 1 Functional communication. | ||||
| 1.1 Discourse (recount, procedural, exposition) number of utterances | 1 | Mean Difference (IV, Fixed, 95% CI) | 0.0 [0.0, 0.0] | |
| 2 Receptive language: word comprehension Show forest plot | 1 | Mean Difference (IV, Fixed, 95% CI) | Totals not selected | |
| Analysis 25.2  Comparison 25 Discourse therapy versus conventional therapy, Outcome 2 Receptive language: word comprehension. | ||||
| 2.1 Northwestern Assessment of Verbs and Sentences | 1 | Mean Difference (IV, Fixed, 95% CI) | 0.0 [0.0, 0.0] | |
| 3 Expressive language: naming Show forest plot | 1 | Mean Difference (IV, Fixed, 95% CI) | Totals not selected | |
| Analysis 25.3 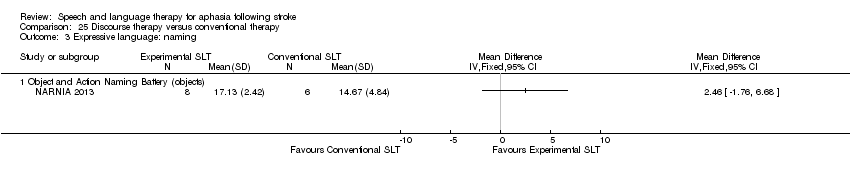 Comparison 25 Discourse therapy versus conventional therapy, Outcome 3 Expressive language: naming. | ||||
| 3.1 Object and Action Naming Battery (objects) | 1 | Mean Difference (IV, Fixed, 95% CI) | 0.0 [0.0, 0.0] | |
| Outcome or subgroup title | No. of studies | No. of participants | Statistical method | Effect size |
| 1 Functional communication Show forest plot | 1 | Mean Difference (IV, Fixed, 95% CI) | Totals not selected | |
| Analysis 26.1 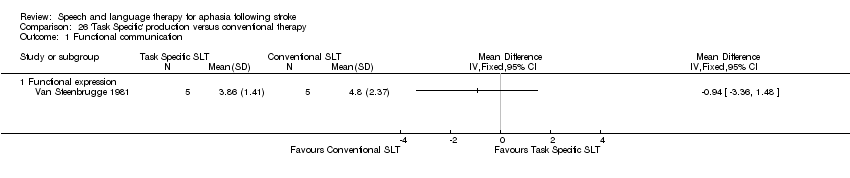 Comparison 26 'Task Specific' production versus conventional therapy, Outcome 1 Functional communication. | ||||
| 1.1 Functional expression | 1 | Mean Difference (IV, Fixed, 95% CI) | 0.0 [0.0, 0.0] | |
| 2 Expressive language: spoken sentence Show forest plot | 1 | Mean Difference (IV, Fixed, 95% CI) | Totals not selected | |
| Analysis 26.2  Comparison 26 'Task Specific' production versus conventional therapy, Outcome 2 Expressive language: spoken sentence. | ||||
| 2.1 Sentence construction (AmAT) | 1 | Mean Difference (IV, Fixed, 95% CI) | 0.0 [0.0, 0.0] | |
| 2.2 Sentence construction (AmAT) 3‐week follow‐up | 1 | Mean Difference (IV, Fixed, 95% CI) | 0.0 [0.0, 0.0] | |
| 3 Expressive language: naming Show forest plot | 1 | Mean Difference (IV, Fixed, 95% CI) | Totals not selected | |
| Analysis 26.3  Comparison 26 'Task Specific' production versus conventional therapy, Outcome 3 Expressive language: naming. | ||||
| 3.1 AmAT naming test | 1 | Mean Difference (IV, Fixed, 95% CI) | 0.0 [0.0, 0.0] | |
| 4 Expressive language: naming (follow‐up) Show forest plot | 1 | Mean Difference (IV, Fixed, 95% CI) | Totals not selected | |
| Analysis 26.4 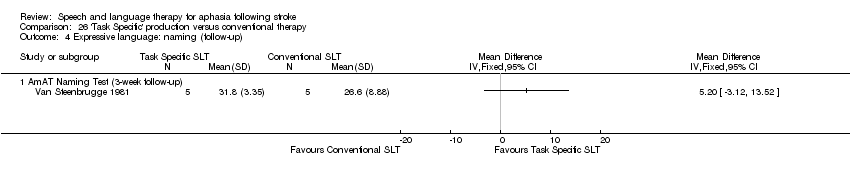 Comparison 26 'Task Specific' production versus conventional therapy, Outcome 4 Expressive language: naming (follow‐up). | ||||
| 4.1 AmAT Naming Test (3‐week follow‐up) | 1 | Mean Difference (IV, Fixed, 95% CI) | 0.0 [0.0, 0.0] | |
| 5 Expressive language: spoken sentence Show forest plot | 1 | Mean Difference (IV, Fixed, 95% CI) | Totals not selected | |
| Analysis 26.5  Comparison 26 'Task Specific' production versus conventional therapy, Outcome 5 Expressive language: spoken sentence. | ||||
| 5.1 Sentence construction (AmAT) | 1 | Mean Difference (IV, Fixed, 95% CI) | 0.0 [0.0, 0.0] | |
| 5.2 Sentence construction (AmAT) 3‐week follow‐up | 1 | Mean Difference (IV, Fixed, 95% CI) | 0.0 [0.0, 0.0] | |
| 6 Expressive language: treated items Show forest plot | 1 | Std. Mean Difference (IV, Fixed, 95% CI) | Totals not selected | |
| Analysis 26.6  Comparison 26 'Task Specific' production versus conventional therapy, Outcome 6 Expressive language: treated items. | ||||
| 6.1 Naming (treated) | 1 | Std. Mean Difference (IV, Fixed, 95% CI) | 0.0 [0.0, 0.0] | |
| 6.2 Sentence construction (treated) | 1 | Std. Mean Difference (IV, Fixed, 95% CI) | 0.0 [0.0, 0.0] | |
| 6.3 Naming (treated: 3‐week follow‐up) | 1 | Std. Mean Difference (IV, Fixed, 95% CI) | 0.0 [0.0, 0.0] | |
| 6.4 Sentence construction (treated: 3‐week follow‐up) | 1 | Std. Mean Difference (IV, Fixed, 95% CI) | 0.0 [0.0, 0.0] | |
| Outcome or subgroup title | No. of studies | No. of participants | Statistical method | Effect size |
| 1 Number of dropouts for any reason Show forest plot | 1 | Odds Ratio (M‐H, Random, 95% CI) | Totals not selected | |
| Analysis 27.1 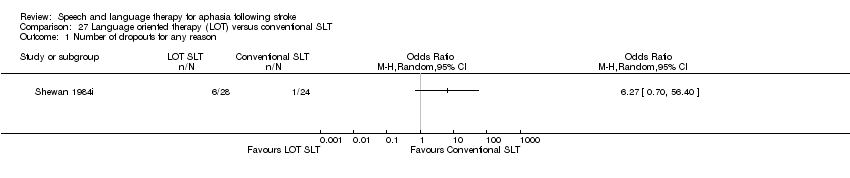 Comparison 27 Language oriented therapy (LOT) versus conventional SLT, Outcome 1 Number of dropouts for any reason. | ||||
| 2 Adherence to allocated intervention Show forest plot | 1 | Odds Ratio (M‐H, Fixed, 95% CI) | Totals not selected | |
| Analysis 27.2  Comparison 27 Language oriented therapy (LOT) versus conventional SLT, Outcome 2 Adherence to allocated intervention. | ||||
| Outcome or subgroup title | No. of studies | No. of participants | Statistical method | Effect size |
| 1 Functional communication Show forest plot | 1 | Mean Difference (IV, Fixed, 95% CI) | Totals not selected | |
| Analysis 28.1  Comparison 28 Auditory comprehension SLT versus conventional SLT, Outcome 1 Functional communication. | ||||
| 1.1 Functional expression | 1 | Mean Difference (IV, Fixed, 95% CI) | 0.0 [0.0, 0.0] | |
| 2 Receptive language: word comprehension Show forest plot | 1 | Std. Mean Difference (IV, Fixed, 95% CI) | Totals not selected | |
| Analysis 28.2  Comparison 28 Auditory comprehension SLT versus conventional SLT, Outcome 2 Receptive language: word comprehension. | ||||
| 2.1 Word comprehension (BDAE subtest) | 1 | Std. Mean Difference (IV, Fixed, 95% CI) | 0.0 [0.0, 0.0] | |
| 2.2 Identify body part (BDAE subtest) | 1 | Std. Mean Difference (IV, Fixed, 95% CI) | 0.0 [0.0, 0.0] | |
| 3 Receptive language: other auditory comprehension Show forest plot | 1 | Std. Mean Difference (IV, Fixed, 95% CI) | Totals not selected | |
| Analysis 28.3  Comparison 28 Auditory comprehension SLT versus conventional SLT, Outcome 3 Receptive language: other auditory comprehension. | ||||
| 3.1 Sentence comprehension | 1 | Std. Mean Difference (IV, Fixed, 95% CI) | 0.0 [0.0, 0.0] | |
| 3.2 Token Test | 1 | Std. Mean Difference (IV, Fixed, 95% CI) | 0.0 [0.0, 0.0] | |
| 4 Receptive language: auditory comprehension (treated items) Show forest plot | 1 | Std. Mean Difference (IV, Fixed, 95% CI) | Totals not selected | |
| Analysis 28.4  Comparison 28 Auditory comprehension SLT versus conventional SLT, Outcome 4 Receptive language: auditory comprehension (treated items). | ||||
| 4.1 Word comprehension (phonology) | 1 | Std. Mean Difference (IV, Fixed, 95% CI) | 0.0 [0.0, 0.0] | |
| 4.2 Word comprehension (lexicon) | 1 | Std. Mean Difference (IV, Fixed, 95% CI) | 0.0 [0.0, 0.0] | |
| 4.3 Sentence comprehension (morphosyntax) | 1 | Std. Mean Difference (IV, Fixed, 95% CI) | 0.0 [0.0, 0.0] | |
| 5 Receptive language: reading comprehension Show forest plot | 1 | Mean Difference (IV, Random, 95% CI) | Totals not selected | |
| Analysis 28.5  Comparison 28 Auditory comprehension SLT versus conventional SLT, Outcome 5 Receptive language: reading comprehension. | ||||
| 5.1 Reading comprehension | 1 | Mean Difference (IV, Random, 95% CI) | 0.0 [0.0, 0.0] | |
| 6 Expressive language: naming Show forest plot | 1 | Mean Difference (IV, Fixed, 95% CI) | Totals not selected | |
| Analysis 28.6 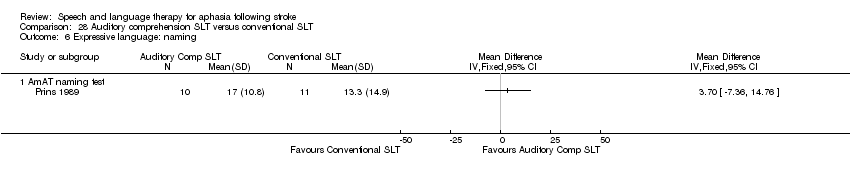 Comparison 28 Auditory comprehension SLT versus conventional SLT, Outcome 6 Expressive language: naming. | ||||
| 6.1 AmAT naming test | 1 | Mean Difference (IV, Fixed, 95% CI) | 0.0 [0.0, 0.0] | |
| 7 Expressive language: spoken sentence Show forest plot | 1 | Mean Difference (IV, Fixed, 95% CI) | Totals not selected | |
| Analysis 28.7  Comparison 28 Auditory comprehension SLT versus conventional SLT, Outcome 7 Expressive language: spoken sentence. | ||||
| 7.1 Sentence construction (AmAT) | 1 | Mean Difference (IV, Fixed, 95% CI) | 0.0 [0.0, 0.0] | |
| Outcome or subgroup title | No. of studies | No. of participants | Statistical method | Effect size |
| 1 Expressive language: naming Show forest plot | 1 | Mean Difference (IV, Fixed, 95% CI) | Totals not selected | |
| Analysis 29.1 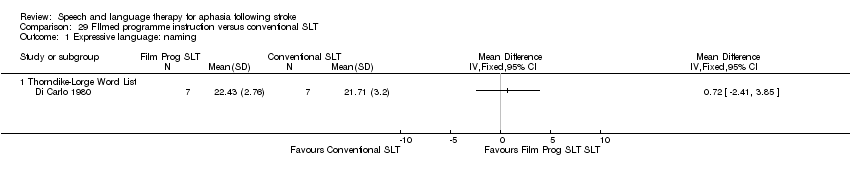 Comparison 29 FIlmed programme instruction versus conventional SLT, Outcome 1 Expressive language: naming. | ||||
| 1.1 Thorndike‐Lorge Word List | 1 | Mean Difference (IV, Fixed, 95% CI) | 0.0 [0.0, 0.0] | |
| 2 Receptive language: reading comprehension Show forest plot | 1 | Mean Difference (IV, Fixed, 95% CI) | Totals not selected | |
| Analysis 29.2 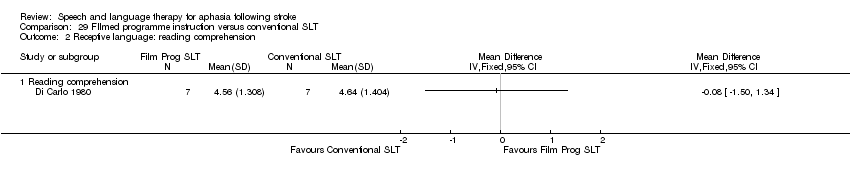 Comparison 29 FIlmed programme instruction versus conventional SLT, Outcome 2 Receptive language: reading comprehension. | ||||
| 2.1 Reading comprehension | 1 | Mean Difference (IV, Fixed, 95% CI) | 0.0 [0.0, 0.0] | |


'Risk of bias' graph: review authors' judgements about each 'Risk of bias' item presented as percentages across all included studies.

'Risk of bias' summary: review authors' judgements about each 'Risk of bias' item for each included study.
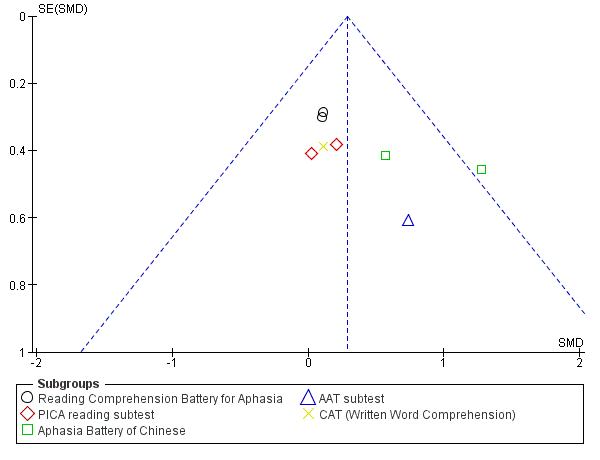
Funnel plot of comparison: 1 SLT versus no SLT, outcome: 1.3 Receptive language: reading comprehension.

Funnel plot of comparison: 1 SLT versus no SLT, outcome: 1.7 Expressive language: written.
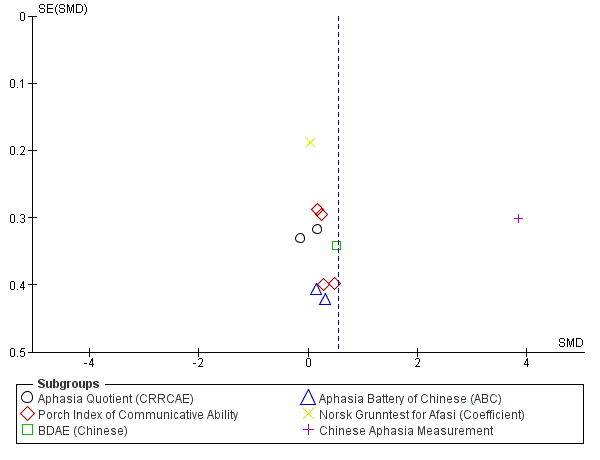
Funnel plot of comparison: 1 SLT versus no SLT, outcome: 1.11 Severity of impairment: Aphasia Battery Score (+ PICA).
Comparison 1 SLT versus no SLT, Outcome 1 Functional communication.
Comparison 1 SLT versus no SLT, Outcome 2 Receptive language: auditory comprehension.
Comparison 1 SLT versus no SLT, Outcome 3 Receptive language: reading comprehension.
Comparison 1 SLT versus no SLT, Outcome 4 Receptive language: other.
Comparison 1 SLT versus no SLT, Outcome 5 Expressive language: naming.
Comparison 1 SLT versus no SLT, Outcome 6 Expressive language: general.
Comparison 1 SLT versus no SLT, Outcome 7 Expressive language: written.
Comparison 1 SLT versus no SLT, Outcome 8 Expressive language: written copying.
Comparison 1 SLT versus no SLT, Outcome 9 Expressive language: repetition.
Comparison 1 SLT versus no SLT, Outcome 10 Expressive language: fluency.
Comparison 1 SLT versus no SLT, Outcome 11 Severity of impairment: Aphasia Battery Score (+ PICA).
Comparison 1 SLT versus no SLT, Outcome 12 Mood: MAACL.
Comparison 1 SLT versus no SLT, Outcome 13 Economic outcomes.
Comparison 1 SLT versus no SLT, Outcome 14 Number of dropouts (any reason).
Comparison 1 SLT versus no SLT, Outcome 15 Adherence to allocated intervention.
Comparison 2 SLT versus no SLT (follow‐up data), Outcome 1 Functional communication.
Comparison 2 SLT versus no SLT (follow‐up data), Outcome 2 Receptive language: auditory comprehension.
Comparison 2 SLT versus no SLT (follow‐up data), Outcome 3 Receptive language: reading comprehension.
Comparison 2 SLT versus no SLT (follow‐up data), Outcome 4 Expressive language: naming.
Comparison 2 SLT versus no SLT (follow‐up data), Outcome 5 Expressive language: written.
Comparison 2 SLT versus no SLT (follow‐up data), Outcome 6 Expressive language: repetition.
Comparison 2 SLT versus no SLT (follow‐up data), Outcome 7 Severity of impairment: Aphasia Battery Score.
Comparison 2 SLT versus no SLT (follow‐up data), Outcome 8 Economic outcomes.
Comparison 2 SLT versus no SLT (follow‐up data), Outcome 9 Number of dropouts (any reason).
Comparison 3 SLT versus social support and stimulation, Outcome 1 Functional communication.
Comparison 3 SLT versus social support and stimulation, Outcome 2 Receptive language: auditory comprehension.
Comparison 3 SLT versus social support and stimulation, Outcome 3 Receptive language: other.
Comparison 3 SLT versus social support and stimulation, Outcome 4 Expressive language:naming.
Comparison 3 SLT versus social support and stimulation, Outcome 5 Expressive language: sentences.
Comparison 3 SLT versus social support and stimulation, Outcome 6 Expressive language: picture description.
Comparison 3 SLT versus social support and stimulation, Outcome 7 Expressive language: overall spoken.
Comparison 3 SLT versus social support and stimulation, Outcome 8 Expressive language: written.
Comparison 3 SLT versus social support and stimulation, Outcome 9 Expressive language: fluency.
Comparison 3 SLT versus social support and stimulation, Outcome 10 Severity of impairment: Aphasia Battery Score.
Comparison 3 SLT versus social support and stimulation, Outcome 11 Psychosocial impact.
Comparison 3 SLT versus social support and stimulation, Outcome 12 Number of dropouts for any reason.
Comparison 3 SLT versus social support and stimulation, Outcome 13 Adherence to allocated intervention.
Comparison 3 SLT versus social support and stimulation, Outcome 14 Economic outcomes.
Comparison 4 High‐ versus low‐intensity SLT, Outcome 1 Functional communication.
Comparison 4 High‐ versus low‐intensity SLT, Outcome 2 Receptive language: auditory comprehension.
Comparison 4 High‐ versus low‐intensity SLT, Outcome 3 Receptive language: reading comprehension.
Comparison 4 High‐ versus low‐intensity SLT, Outcome 4 Expressive language: naming.
Comparison 4 High‐ versus low‐intensity SLT, Outcome 5 Expressive language: written.
Comparison 4 High‐ versus low‐intensity SLT, Outcome 6 Expressive language: repetition.
Comparison 4 High‐ versus low‐intensity SLT, Outcome 7 Expressive language: fluency.
Comparison 4 High‐ versus low‐intensity SLT, Outcome 8 Severity of impairment: Aphasia Battery Score.
Comparison 4 High‐ versus low‐intensity SLT, Outcome 9 Mood.
Comparison 4 High‐ versus low‐intensity SLT, Outcome 10 Number of dropouts for any reason.
Comparison 4 High‐ versus low‐intensity SLT, Outcome 11 Adherence to allocated intervention.
Comparison 5 SLT versus social support and stimulation (follow‐up), Outcome 1 Functional communication.
Comparison 5 SLT versus social support and stimulation (follow‐up), Outcome 2 Expressive language: single words (6 week follow‐up).
Comparison 6 High‐ versus low‐intensity SLT (follow‐up), Outcome 1 Functional communication.
Comparison 6 High‐ versus low‐intensity SLT (follow‐up), Outcome 2 Receptive language.
Comparison 6 High‐ versus low‐intensity SLT (follow‐up), Outcome 3 Expressive language.
Comparison 6 High‐ versus low‐intensity SLT (follow‐up), Outcome 4 Severity of impairment: Aphasia Battery Score.
Comparison 6 High‐ versus low‐intensity SLT (follow‐up), Outcome 5 Mood.
Comparison 6 High‐ versus low‐intensity SLT (follow‐up), Outcome 6 Number of dropouts for any reason.
Comparison 7 High versus low dose SLT, Outcome 1 Functional communication.
Comparison 7 High versus low dose SLT, Outcome 2 Receptive language: auditory comprehension (change from baseline).
Comparison 7 High versus low dose SLT, Outcome 3 Expressive language: spoken (change from baseline).
Comparison 7 High versus low dose SLT, Outcome 4 Expressive language: written (change from baseline).
Comparison 7 High versus low dose SLT, Outcome 5 Severity of impairment: Aphasia Battery Score.
Comparison 7 High versus low dose SLT, Outcome 6 Number of dropouts for any reason.
Comparison 7 High versus low dose SLT, Outcome 7 Adherence to allocated intervention.
Comparison 8 High versus low dose SLT (follow‐up), Outcome 1 Functional communication.
Comparison 8 High versus low dose SLT (follow‐up), Outcome 2 Severity of impairment: Aphasia Battery Score.
Comparison 8 High versus low dose SLT (follow‐up), Outcome 3 Number of dropouts for any reason.
Comparison 9 Early versus delayed SLT, Outcome 1 Functional communication.
Comparison 9 Early versus delayed SLT, Outcome 2 Receptive language: auditory comprehension.
Comparison 9 Early versus delayed SLT, Outcome 3 Expressive language: naming.
Comparison 9 Early versus delayed SLT, Outcome 4 Expressive language: written.
Comparison 9 Early versus delayed SLT, Outcome 5 Expressive language: repetition.
Comparison 9 Early versus delayed SLT, Outcome 6 Expressive language: fluency.
Comparison 9 Early versus delayed SLT, Outcome 7 Severity of impairment.
Comparison 9 Early versus delayed SLT, Outcome 8 Number of dropouts for any reason.
Comparison 10 Early versus delayed SLT (follow‐up), Outcome 1 Expressive language: naming.
Comparison 10 Early versus delayed SLT (follow‐up), Outcome 2 Expressive language: repetition.
Comparison 10 Early versus delayed SLT (follow‐up), Outcome 3 Number of dropouts for any reason.
Comparison 11 SLT of short versus long duration, Outcome 1 Functional communication.
Comparison 11 SLT of short versus long duration, Outcome 2 Functional communication (follow‐up).
Comparison 11 SLT of short versus long duration, Outcome 3 Receptive language: auditory comprehension.
Comparison 11 SLT of short versus long duration, Outcome 4 Receptive language: comprehension (50 week follow‐up).
Comparison 11 SLT of short versus long duration, Outcome 5 Receptive language: comprehension (62 week follow‐up).
Comparison 11 SLT of short versus long duration, Outcome 6 Receptive language: reading comprehension.
Comparison 11 SLT of short versus long duration, Outcome 7 Expressive language: naming.
Comparison 11 SLT of short versus long duration, Outcome 8 Expressive language: written.
Comparison 11 SLT of short versus long duration, Outcome 9 Expressive language: repetition.
Comparison 11 SLT of short versus long duration, Outcome 10 Expressive language: fluency.
Comparison 11 SLT of short versus long duration, Outcome 11 Expressive language: 50 and 62 weeks follow‐up.
Comparison 11 SLT of short versus long duration, Outcome 12 Depression.
Comparison 11 SLT of short versus long duration, Outcome 13 Severity of impairment: Aphasia Battery Score.
Comparison 11 SLT of short versus long duration, Outcome 14 Severity of impairment: Aphasia Battery Score (follow‐up).
Comparison 11 SLT of short versus long duration, Outcome 15 Number of dropouts for any reason.
Comparison 11 SLT of short versus long duration, Outcome 16 Adherence to allocated intervention.
Comparison 12 Group versus one‐to‐one SLT, Outcome 1 Functional communication.
Comparison 12 Group versus one‐to‐one SLT, Outcome 2 Receptive language: auditory comprehension.
Comparison 12 Group versus one‐to‐one SLT, Outcome 3 Receptive language: other.
Comparison 12 Group versus one‐to‐one SLT, Outcome 4 Expressive language: naming.
Comparison 12 Group versus one‐to‐one SLT, Outcome 5 Expressive language: general.
Comparison 12 Group versus one‐to‐one SLT, Outcome 6 Expressive language: repetition.
Comparison 12 Group versus one‐to‐one SLT, Outcome 7 Expressive language: written.
Comparison 12 Group versus one‐to‐one SLT, Outcome 8 Quality of life.
Comparison 12 Group versus one‐to‐one SLT, Outcome 9 Severity of impairment: Aphasia Battery Score.
Comparison 12 Group versus one‐to‐one SLT, Outcome 10 Number of dropouts for any reason.
Comparison 13 Group versus one‐to‐one SLT (follow‐up), Outcome 1 Functional communication.
Comparison 13 Group versus one‐to‐one SLT (follow‐up), Outcome 2 Severity of impairment: Aphasia Battery Score.
Comparison 13 Group versus one‐to‐one SLT (follow‐up), Outcome 3 Quality of life.
Comparison 13 Group versus one‐to‐one SLT (follow‐up), Outcome 4 Number of dropouts for any reason.
Comparison 14 Volunteer‐facilitated versus professional SLT, Outcome 1 Functional communication.
Comparison 14 Volunteer‐facilitated versus professional SLT, Outcome 2 Receptive language: auditory comprehension.
Comparison 14 Volunteer‐facilitated versus professional SLT, Outcome 3 Receptive language: reading comprehension.
Comparison 14 Volunteer‐facilitated versus professional SLT, Outcome 4 Receptive language: other.
Comparison 14 Volunteer‐facilitated versus professional SLT, Outcome 5 Expressive language: spoken.
Comparison 14 Volunteer‐facilitated versus professional SLT, Outcome 6 Expressive language: repetition.
Comparison 14 Volunteer‐facilitated versus professional SLT, Outcome 7 Expressive language: written.
Comparison 14 Volunteer‐facilitated versus professional SLT, Outcome 8 Severity of impairment: Aphasia Battery Score.
Comparison 14 Volunteer‐facilitated versus professional SLT, Outcome 9 Number of dropouts for any reason.
Comparison 14 Volunteer‐facilitated versus professional SLT, Outcome 10 Adherence to allocated intervention.
Comparison 15 Computer‐mediated versus professional SLT, Outcome 1 Functional communication.
Comparison 15 Computer‐mediated versus professional SLT, Outcome 2 Receptive language.
Comparison 15 Computer‐mediated versus professional SLT, Outcome 3 Expressive language.
Comparison 15 Computer‐mediated versus professional SLT, Outcome 4 Expressive language: written.
Comparison 15 Computer‐mediated versus professional SLT, Outcome 5 Severity of impairment.
Comparison 15 Computer‐mediated versus professional SLT, Outcome 6 Number of dropouts for any reason.
Comparison 16 Computer‐mediated versus professional SLT (follow‐up), Outcome 1 Functional communication (6 weeks).
Comparison 16 Computer‐mediated versus professional SLT (follow‐up), Outcome 2 Expressive language: naming (6 weeks).
Comparison 17 Semantic SLT versus other SLT, Outcome 1 Functional communication.
Comparison 17 Semantic SLT versus other SLT, Outcome 2 Receptive language: auditory comprehension.
Comparison 17 Semantic SLT versus other SLT, Outcome 3 Receptive language: other.
Comparison 17 Semantic SLT versus other SLT, Outcome 4 Expressive language: naming.
Comparison 17 Semantic SLT versus other SLT, Outcome 5 Expressive language: written.
Comparison 17 Semantic SLT versus other SLT, Outcome 6 Expressive language: repetition.
Comparison 17 Semantic SLT versus other SLT, Outcome 7 Expressive language: fluency.
Comparison 17 Semantic SLT versus other SLT, Outcome 8 Number of dropouts for any reason.
Comparison 17 Semantic SLT versus other SLT, Outcome 9 Adherence to allocated intervention.
Comparison 18 Constraint‐induced aphasia therapy versus other SLT, Outcome 1 Functional communication.
Comparison 18 Constraint‐induced aphasia therapy versus other SLT, Outcome 2 Receptive language: auditory comprehension.
Comparison 18 Constraint‐induced aphasia therapy versus other SLT, Outcome 3 Receptive language: other.
Comparison 18 Constraint‐induced aphasia therapy versus other SLT, Outcome 4 Expressive language: naming.
Comparison 18 Constraint‐induced aphasia therapy versus other SLT, Outcome 5 Expressive language: repetition.
Comparison 18 Constraint‐induced aphasia therapy versus other SLT, Outcome 6 Expressive language: written.
Comparison 18 Constraint‐induced aphasia therapy versus other SLT, Outcome 7 Quality of life.
Comparison 18 Constraint‐induced aphasia therapy versus other SLT, Outcome 8 Severity of impairment.
Comparison 19 Constraint‐induced aphasia therapy versus other SLT (follow‐up), Outcome 1 Functional communication.
Comparison 19 Constraint‐induced aphasia therapy versus other SLT (follow‐up), Outcome 2 Quality of life.
Comparison 19 Constraint‐induced aphasia therapy versus other SLT (follow‐up), Outcome 3 Severity of impairment.
Comparison 20 SLT with gestural adjunct versus SLT, Outcome 1 Functional communication.
Comparison 20 SLT with gestural adjunct versus SLT, Outcome 2 Expressive language.
Comparison 20 SLT with gestural adjunct versus SLT, Outcome 3 Severity of impairment: Aphasia Battery Score.
Comparison 20 SLT with gestural adjunct versus SLT, Outcome 4 Functional communication (follow‐up).
Comparison 20 SLT with gestural adjunct versus SLT, Outcome 5 Expressive language: (follow‐up).
Comparison 20 SLT with gestural adjunct versus SLT, Outcome 6 Severity of impairment: Aphasia Battery Score (follow‐up).
Comparison 21 Melodic intonation therapy versus other SLT, Outcome 1 Functional communication.
Comparison 21 Melodic intonation therapy versus other SLT, Outcome 2 Expressive language: naming.
Comparison 21 Melodic intonation therapy versus other SLT, Outcome 3 Expressive language: repetition.
Comparison 21 Melodic intonation therapy versus other SLT, Outcome 4 Number of dropouts for any reason.
Comparison 22 Functional SLT versus conventional SLT, Outcome 1 Functional communication.
Comparison 23 Operant training SLT versus conventional SLT, Outcome 1 Receptive language: auditory comprehension.
Comparison 23 Operant training SLT versus conventional SLT, Outcome 2 Receptive language: other.
Comparison 23 Operant training SLT versus conventional SLT, Outcome 3 Expressive language: spoken.
Comparison 23 Operant training SLT versus conventional SLT, Outcome 4 Expressive language: written.
Comparison 23 Operant training SLT versus conventional SLT, Outcome 5 Severity of impairment.
Comparison 24 Verb comprehension SLT versus preposition comprehension SLT, Outcome 1 Receptive language: auditory comprehension.
Comparison 24 Verb comprehension SLT versus preposition comprehension SLT, Outcome 2 Receptive language: reading.
Comparison 24 Verb comprehension SLT versus preposition comprehension SLT, Outcome 3 Expressive language.
Comparison 24 Verb comprehension SLT versus preposition comprehension SLT, Outcome 4 Severity of impairment: Aphasia Battery Score.
Comparison 25 Discourse therapy versus conventional therapy, Outcome 1 Functional communication.
Comparison 25 Discourse therapy versus conventional therapy, Outcome 2 Receptive language: word comprehension.
Comparison 25 Discourse therapy versus conventional therapy, Outcome 3 Expressive language: naming.
Comparison 26 'Task Specific' production versus conventional therapy, Outcome 1 Functional communication.
Comparison 26 'Task Specific' production versus conventional therapy, Outcome 2 Expressive language: spoken sentence.
Comparison 26 'Task Specific' production versus conventional therapy, Outcome 3 Expressive language: naming.
Comparison 26 'Task Specific' production versus conventional therapy, Outcome 4 Expressive language: naming (follow‐up).
Comparison 26 'Task Specific' production versus conventional therapy, Outcome 5 Expressive language: spoken sentence.
Comparison 26 'Task Specific' production versus conventional therapy, Outcome 6 Expressive language: treated items.
Comparison 27 Language oriented therapy (LOT) versus conventional SLT, Outcome 1 Number of dropouts for any reason.
Comparison 27 Language oriented therapy (LOT) versus conventional SLT, Outcome 2 Adherence to allocated intervention.
Comparison 28 Auditory comprehension SLT versus conventional SLT, Outcome 1 Functional communication.
Comparison 28 Auditory comprehension SLT versus conventional SLT, Outcome 2 Receptive language: word comprehension.
Comparison 28 Auditory comprehension SLT versus conventional SLT, Outcome 3 Receptive language: other auditory comprehension.
Comparison 28 Auditory comprehension SLT versus conventional SLT, Outcome 4 Receptive language: auditory comprehension (treated items).
Comparison 28 Auditory comprehension SLT versus conventional SLT, Outcome 5 Receptive language: reading comprehension.
Comparison 28 Auditory comprehension SLT versus conventional SLT, Outcome 6 Expressive language: naming.
Comparison 28 Auditory comprehension SLT versus conventional SLT, Outcome 7 Expressive language: spoken sentence.
Comparison 29 FIlmed programme instruction versus conventional SLT, Outcome 1 Expressive language: naming.
Comparison 29 FIlmed programme instruction versus conventional SLT, Outcome 2 Receptive language: reading comprehension.
| SLT versus no SLT for aphasia following stroke (immediate outcomes) | ||||
| Patient or population: adults with aphasia following stroke Intervention: SLT Comparison: no SLT | ||||
| Outcomes | No of participants | Relative effect | Direction of effect | Quality of the evidence |
| Functional communication | 376 participants | SMD: 0.28 (0.06 to 0.49) | Favours SLT | ⊕⊕⊕⊝ |
| Receptive language: auditory comprehension | 399 participants (9 trials) | SMD: 0.06 (−0.15 to 0.26) | No evidence of benefit or harm | ⊕⊕⊝⊝ |
| Receptive language: reading comprehension | 253 participants (8 trials) | SMD: 0.29 (0.03 to 0.55) | Favours SLT | ⊕⊕⊕⊝ |
| Expressive language: naming | 275 participants (7 trials) | SMD: 0.14 (−0.10 to 0.38) | No evidence of benefit or harm | ⊕⊕⊝⊝ |
| Expressive language: general | 248 participants (7 trials) | SMD: 1.28 (0.38 to 2.19) | Favours SLT | ⊕⊕⊕⊝ |
| Expressive language: written | 253 participants (8 trials) | SMD: 0.41 (0.14 to 0.67) | Favours SLT | ⊕⊕⊕⊝ |
| Number of dropouts (for any reason) | 921 (13 trials) | OR: 0.89 (0.64 to 1.25) | No evidence of benefit or harm | ⊕⊕⊕⊝ |
| CI: confidence interval; OR: odds ratio; SMD: standardised mean difference. | ||||
| GRADE Working Group grades of evidence | ||||
| aDowngraded 1 level from high to moderate as there were serious limitations identified in the risk of bias (either unclear randomisation sequence, unclear or high risk of bias for allocation concealment, or both in 1 or more of the trials). | ||||
| SLT compared versus no SLT for aphasia following stroke at 6 months follow‐up | ||||
| Patient or population: adults with aphasia following stroke Intervention: SLT Comparison: no SLT | ||||
| Outcomes | No of participants | Relative effect | Direction of effect | Quality of the evidence |
| Functional communication (6 months follow‐up) | 111 participants (2 trials) | SMD: 0.19 (−0.80 to 1.18) | No evidence of benefit or harm | ⊕⊝⊝⊝ |
| Receptive language: auditory comprehension (6 months follow‐up) | 111 participants (2 trials) | MD: 1.38 (−1.39 to 4.15) | No evidence of benefit or harm | ⊕⊝⊝⊝ |
| Expressive language: naming (6 months follow‐up) | 111 participants (3 trials) | SMD: 0.07 (−0.59 to 0.73) | No evidence of benefit or harm | ⊕⊝⊝⊝ |
| Number of dropouts (for any reason) | 322 (6 trials) | OR: 0.73 (0.38 to 1.39) | No evidence of benefit or harm | ⊕⊕⊕⊝ |
| CI: confidence interval; MD: mean difference; SMD: standardised mean difference. | ||||
| GRADE Working Group grades of evidence | ||||
| aSerious limitations identified in the risk of bias. | ||||
| SLT versus social support and stimulation for aphasia following stroke | ||||
| Patient or population: adults with aphasia following stroke Intervention: SLT Comparison: social support and stimulation | ||||
| Outcomes | No of participants | Relative effect | Direction of effect | Quality of the evidence |
| Functional communication | — | Not estimable | — | Not appropriate to pool the evidence as the data is reported using different outcome measures |
| Expressive language: naming | 33 participants (3 studies) | SMD: 1.24 (−1.70 to 4.18) | No evidence of benefit or harm | ⊕⊝⊝⊝ |
| Number of dropouts for any reason | 413 participants (5 studies) | OR: 0.51 (0.32 to 0.82) | Favours SLT | ⊕⊕⊝⊝ |
| CI: confidence interval; OR: odds ratio; SMD: standardised mean difference. | ||||
| GRADE Working Group grades of evidence | ||||
| aSerious limitations identified in the risk of bias. | ||||
| SLT A versus SLT B for aphasia following stroke for functional communication | |||||
| Patient or population: adults with aphasia following stroke Intervention: SLT A Comparison: SLT B | |||||
| Outcome | SLT comparison | No of participants | Relative effect (95% CI) | Direction of effect | Quality of the evidence |
| Functional communication | High‐intensity SLT versus low‐intensity SLT | 84 participants (2 trials) | MD: 11.75 (4.09 to 19.40) | Favours high‐intensity SLT | ⊕⊕⊝⊝ |
| Short duration SLT versus long duration SLT | 50 participants (2 trials) | SMD: 0.81 (0.23, 1.40) | Favours long duration of therapy | ⊕⊝⊝⊝ | |
| Group SLT compared to one‐to‐one SLT | 46 participants (3 trials) | SMD: 0.41 (−0.19 to 1.00) | No evidence of benefit or harm | ⊕⊝⊝⊝ | |
| Computer‐mediated versus professional SLT | 55 participants (3 trials) | SMD: 0.44 (−0.10 to 0.98) | No evidence of benefit or harm | ⊕⊝⊝⊝ | |
| Constraint‐induced aphasia therapy versus other SLT | 126 participants (3 trials) | SMD: 0.15 (−0.21 to 0.50) | No evidence of benefit or harm | ⊕⊕⊝⊝ | |
| CI: confidence interval; MD: mean difference; SMD: standardised mean difference. | |||||
| GRADE Working Group grades of evidence | |||||
| aSee notes about dropouts. | |||||
| SLT A versus SLT B for aphasia following stroke for severity of impairment | |||||
| Patient or population: adults with aphasia following stroke Intervention:SLT A Comparison:SLT B | |||||
| Outcome | SLT comparison | No. of Participants | Relative effect (95% CI) | Direction of Effect | Quality of the evidence |
| Severity of impairment | High‐intensity SLT versus low‐intensity SLT | 187 participants (5 trials) | SMD: 0.38 (0.07 to 0.69) | Favours high‐intensity SLT | ⊕⊕⊕⊝ |
| High dose SLT versus low dose SLT | 145 participants (3 trials) | SMD: 0.35 (−0.16 to 0.85) | No evidence of benefit or harm | ⊕⊕⊝⊝ | |
| Short duration SLT versus long duration SLT | 98 participants (4 trials) | SMD: 0.22 (−0.26 to 0.71) | No evidence of benefit or harm | ⊕⊕⊝⊝ | |
| Group SLT compared to one‐to‐one SLT | 122 participants (4 trials) | SMD: 0.15 (−0.21 to 0.50) | No evidence of benefit or harm | ⊕⊕⊝⊝ | |
| Constraint‐induced aphasia therapy versus other SLT | 34 participants (2 trials) | SMD: 0.11 (−0.57 to 0.79) | No evidence of benefit or harm | ⊕⊝⊝⊝ | |
| CI: Confidence interval; MD: Mean difference; OR: Odds ratio; SMD: Standardised mean difference. | |||||
| GRADE Working Group grades of evidence | |||||
| aSee notes about dropouts. | |||||
| Study ID | No of participants | Male/female | Age in years Mean (standard deviation) (range) | Time post onset Mean (standard deviation) (range) | Aphasia severity Mean (standard deviation) |
| 153 | SLT: 40/36 Social support: 42/35 | SLT: 71 (range 32‐97) Social support: 70 (range 40‐92) | Admission to randomisation median 12 (IQR 9‐16) days | TOMs SLT: 1.9 (SD 1.2) (severe N = 47) Social support: 1.9 (SD 1.1) (severe N = 51) | |
| 18 | Supervised intensive language self training: 7/2 Visual‐cognitive tasks: 7/2 | Supervised intensive language self training: 50 (range 30‐72) Visual‐cognitive tasks: 48 (range 40‐61) | Supervised intensive language self training: 25 (range 12‐43) months Visual‐cognitive tasks: 28 (range 9‐53) months | Supervised intensive language self training: 7 moderate/2 severe Visual‐cognitive tasks: 8 moderate/1 severe | |
| 18 | B.A.Bar early + visual‐cognitive exercises: 7/2 Supervised home training with visual‐cognitive exercises followed by delayed intensive language self training: 7/2 | B.A.Bar early + visual‐cognitive exercises: 50 (range 30‐72) Supervised home training with visual‐cognitive exercises followed by delayed intensive language self training: 48 (range 40‐61) | B.A.Bar early + visual‐cognitive exercises: 25 (range 12‐43) months Supervised home training with visual‐cognitive exercises followed by delayed intensive language self training: 28 (range 9‐53) months | B.A.Bar early + visual‐cognitive exercises: 7 moderate/2 severe Supervised home training with visual‐cognitive exercises followed by delayed intensive language self training: 8 moderate/1 severe | |
| 97 | Intensive: 26/25 | Intensive: 71.2 (SD 14.9; range 26‐92) | Intensive: 34.2 (SD 19.1) days | WABAQ | |
| 33 (of 34 randomised) | Computer‐mediated word finding therapy: 9/7 No SLT: 12/5 | Computer‐mediated word finding therapy: 69.5 (SD 12.2) No SLT: 66.2 (SD 12.3) | Computer‐mediated word finding therapy: 6.2 (range 1‐29) years No SLT: 6.6 (range 1.8‐12.0) years | Computer‐mediated word finding therapy: mild 9 (56.3%); moderate 5 (31.3%); severe 2 (12.5%) No SLT: mild 11 (64.7%); moderate 4 (23.5%); severe 2 (11.8%) | |
| 30 | Modified MIT: 7/9 No SLT: 9/5 | Modified MIT: 56.8 (SD 17.11) No SLT: 66.9 (SD 11.77) | Modified MIT: 32.2 (SD 93.42) days No SLT: 28.4 (SD 67.84) days | Happy Birthday repeated (% words) Modified MIT: 11.9 (SD 4.46) No SLT: 10.6 (SD 4.41) | |
| 8 | Verb SLT: 2/1 Preposition SLT: 5/0 | Verb SLT: 50.3 (SD 8.5; range 44‐60) Preposition SLT: 48.8 (SD 13.77; range 27‐64) | Verb SLT: 87.33 (SD 40.61; range 60‐134) months Preposition SLT: 66.4 (SD 20.96; range 39‐86) | WABAQ Verb SLT: 76.2 (SD 9.81) Preposition SLT: 69.3 (SD 16.58) | |
| 14 | Naming therapy with gesture: 2/5 Conventional: 6/1 | Naming therapy with gesture: 72.1 (SD 10.5) Conventional: 63.0 (SD 9.2) | Naming therapy with gesture: 37.4 (SD 33.5; range 12‐87) months Conventional: 38.1 (SD 37.4; range 10‐112) months | WABAQ Naming therapy with gesture: 65.5 (SD 8.3) Conventional: 71.9 (SD 11.8) | |
| 133 (of 155 randomised) | Conventional: 35/30 | Conventional: 70 (SD 8.7) | Conventional: median 4 (range 4‐266) weeks | Baseline FCP scores for N = 98 retained until post‐therapy test Conventional: 42.4 (SD 20.8) | |
| 17 | Intensive: 5/3 | Intensive: 58.1 (SD 11.8) | Intensive: 3.2 (SD 1.8) months | AAT | |
| 14 | Programmed instruction: 7/0 | Programmed instruction: 57.6 (SD 9.2; range 44‐69) | Programmed instruction: 24.7 (SD 23.6; range 0‐66) months | Programmed instruction: severe | |
| 18 (of 19 randomised) | Computer‐mediated: 4/4 | Computer‐mediated: 62 (SD 9.0) | Computer‐mediated: 13 (range 11‐16) months | Computer‐mediated: ANELT‐ A 34 (SD 9); BNT 63 (SD 37) | |
| 8 | Not reported | Gesture cue: 52.9 (SD 6.0) | Gesture cue: 15.3 (SD 4.1; range 10‐20) months | Not reported | |
| 24 | Conventional: 7/5 | Conventional: 58.3 (SD 11.4; range 38‐79) | Conventional: 32.5 (SD 28.7; range 7‐103) months | Conventional: SPICA 7 mild to moderate, 7 moderate to severe | |
| 28 | CIAT: 15 Conventional:13 Sex data not reported | Not reported | All participants had a "left hemisphere cerebrovascular accident less than 3 months prior" | Not reported | |
| 12 | Functional SLT: 5/1 | Functional: 51.6 (SD 15) | Functional: 26.8 (SD 20.1; range 6‐58) months | BDAE Severity Rating | |
| 42 (reported data on 36) | Computer‐mediated: not reported | Computer‐mediated: 61.6 (SD 10) | Computer‐mediated: 6.2 (SD 5.2) years | PICA overall percentile; WABAQ Computer‐mediated: 57.3 (SD 17.9); 68.9 (SD 24.3). | |
| 40 (of 42 randomised) | Computer‐mediated: not reported | Computer‐mediated: 61.6 (SD 10) | Computer‐mediated: 6.2 (SD 5.2) years | PICA overall percentile; WABAQ Computer‐mediated: 57.3 (SD 17.9); 68.9 (SD 24.3) | |
| 123 | SLT: 33/29 No SLT: 23/38 | SLT: 76 (range 38‐94) No SLT: 79 (range 39‐94) | SLT: median 3 (IQR; 2‐4) days No SLT: median 3 (IQR; 2‐4) days | ANELT‐A median (IQR) SLT: 1 (0.0‐1.4) No SLT: 1 (0.0‐1.4) | |
| 94 | Conventional: 38/21 Volunteer‐facilitated: 22/13 | Conventional: 56 (SD 17) | Within first month after stroke | Conventional: moderate‐severe | |
| 12 | SLT/operant training: 3/3 | SLT/operant training: 54.33 (SD 6.68; range 45‐63) SLT/social support: 51.33 (SD 7.97; range 39‐63) | SLT/operant training: 3.17 (SD 1.60; range 1‐5) months | SLT/operant training: moderate | |
| 12 | Operant training/SLT: 5/1 | Operant training/SLT: 57.67 (SD 5.72; range 51‐64) | Operant training/SLT: 2.33 (SD 1.55; range 1‐5) months | Operant training/SLT: moderate | |
| 18 | Conventional SLT: 7/5 | Conventional SLT:52.83 (7.18; range 39‐63) | Conventional SLT: 4.17 (SD 2.76; range 1‐10) months | Conventional SLT: moderate | |
| (data for 58% of randomised participants) | 191 | Conventional: not reported | Conventional: not reported | Conventional: 10 weeks | Not reported |
| 12 | Operant training: 4/2 Placebo: 5/1 | Operant training: 52.33 (SD 11.50; range 32‐64) | Operant training: 5.5 (SD 4.89; range 1‐12) months | Operant training: severe | |
| 36 | SLT: 9/10 No SLT: 10/7 | SLT: 7 = 40‐65 years; 12 = 65‐80 years No SLT: 8 = 40‐65 years; 9 = 65‐80 years | SLT: 8 = 7‐20 days; 11 = 20‐45 days No SLT: 7 = 7‐20 days; 10 = 20‐45 days | BDAE SLT: 60.48 (SD 11.83) No SLT: 58.22 (SD 5.06) | |
| 30 | Functional: not reported | Functional: not reported | Functional: not reported | Functional: not reported | |
| 95 | MacKay 1988: 46/49 | MacKay 1988: median 75 | MacKay 1988: mean 30 months | Not reported | |
| 12 | Daily language rehabilitation: 4/2 No SLT: 3/3 | Daily language rehabilitation: 65.5 (SD 15) No SLT: 62.6 (SD 11) | Daily language rehabilitation: 2.1 (1SD .6) d No SLT: 2.3 (SD 1) d | NIHSS Stroke Severity Daily language rehabilitation: 4.16 (SD 0.75) No SLT: 4.3 (SD 0.81) | |
| 31 | Volunteer‐facilitated: 12/3 | Volunteer‐facilitated: 67.2 (SD 8.6) | Volunteer‐facilitated: 30.9 (29.5; range 4‐115) weeks | PICA percentile volunteer‐facilitated: 53.9 (SD 23.5) | |
| 20 | Constraint‐induced: 7/3 Volunteer‐facilitated: 9/1 | Constraint‐induced: 50.2 (SD 10.13) | Constraint‐induced: 30.7 (SD 18.9; range 6‐72) months | AAT profile score | |
| 27 | MIT: 4/12 Control: 7/4 | MIT: 53.1 (SD 12.0) Control: 52.0 (SD 6.6) | MIT: 9.3 (SD 2.0) weeks Control: 11.9 (SD 5.9) weeks | ANELT MIT: 13.0 (SD 5.1) Control: 12.7 (SD 5.9) | |
| 27 | MIT early + Control SLT: 4/12 Control SLT + delayed MIT: 7/4 | MIT early + control SLT: 53.1 (SD 12.0) control SLT + delayed MIT: 52.0 (SD 6.6) | MIT early + control SLT: 9.3 (SD 2.0) weeks Control SLT + delayed MIT: 11.9 (SD 5.9) weeks | ANELT MIT early + control SLT: 13.0 (SD 5.1) Control SLT + delayed MIT: 12.7 (SD 5.9) | |
| 14 | Narrative: 5/3 Conventional: 3/3 | Narrative: 63 (SD 16; range: 42‐87) Conventional: 55 (SD 11; range 37‐66) | Narrative: 21 (SD 17; range 2‐49) months Conventional: 48 (SD 66; range 3‐165) months | WAB‐R Narrative: 8.17 (SD 1.12) Conventional: 7.75 (SD 1.33) | |
| 13 | Intensive: 6 | Intensive SLT: 61.4 (SD 9.72; range 48.44‐74.5) | Intensive SLT: 36.2 (SD 28.2; range 8.6‐69.8) months | WABAQ Intensive SLT: 51.1 (1SD 7.8; range 28.0‐69.4) | |
| 25 | Computer: 8/3 Therapist: 8/6 | Computer: 56.6 (SD 9.2; range 41.7‐68) Therapist: 61.1 (SD 14.8; range 35.2‐81.7) | Computer: 66.7 (SD 71.5; range 13.8‐253.2) months Therapist: 41.3 (SD 45.7; range 12.2‐166) months | WABAQ Computer: 62.0 (SD 19.9) Therapist: 47.3 (SD 27.9) | |
| 21 | STACDAP: 5/5 | STACDAP: 70.3 (range 58‐83) | STACDAP: 15.2 (range 3‐35) months | STACDAP: FE scale 2.6 (0‐6), oral comprehension (BDAE and Token Test) 26.4 (0‐46) | |
| 17 | Constraint‐induced: 6/4 | Constraint‐induced: 55.4 (SD 10.9) | Constraint‐induced: 98.2 (SD 74.2) months | Constraint‐induced: 2 mild, 5 moderate, 3 severe | |
| 58 | Semantic: 18/11 | Semantic: 66 (SD 10) | Semantic: mean 4 (range 3‐5) months | ANELT‐A score | |
| 80 | Cognitive linguistic: 14/24 Communicative: 24/18 | Cognitive linguistic: 68 (SD 13) Communicative: 67 (SD 15) | Cognitive linguistic: 22 (range 11‐37) d Communicative: 23 (9‐49) d | ANELT‐A score Cognitive linguistic: 21.4 (SD 11.0) Communicative: 21.0 (SD 11.1) | |
| 5 | Sentence mapping: 0/3 | Sentence mapping: range 31‐74 | Sentence mapping: range 2‐9 years | Sentence mapping: BDAE 1‐2, phrase length 2.5‐4.0 | |
| 23 | Data not available at present | Data not available at present | All participants ≥ 6 months post onset, single symptomatic stroke resulting in aphasia | All participants have naming 10%‐ 70% on a screening test | |
| 52 | Language‐orientated: 18/10 | Language‐orientated: 62.18 (range 29‐82) | Language‐orientated: range 2‐4 weeks | Language‐orientated: 9 mild, 6 moderate, 13 severe | |
| 53 | Language‐orientated: 18/10 | Language‐orientated: 62.18 (range 29‐82) | Language‐orientated: range 2‐4 weeks | Language‐orientated: 9 mild, 6 moderate, 13 severe | |
| 49 | Conventional: 14/10 | Conventional: 65.63 (range 48‐85) | Conventional: range 2‐4 weeks | Conventional: 8 mild, 3 moderate, 13 severe | |
| 100 | CIAT: 30/20 Conventional: 30/20 | CIAT: 60.7 (range 41‐81) Conventional: 60.2 (range 34‐84) | CIAT: 36.7 (range 28‐84) days Conventional: 32.9 (range 28‐112) days | AAT Spontaneous Speech CIAT: 18.6 (SD 6.9) Conventional: 18.2 (SD 6.5) | |
| 33 (of 41 randomised) | Conventional: 11/4 | Conventional: 65.73 (SD 8.78; range 48‐77) | Conventional: 17.4 (SD 24.07; range 2‐36) months | Aphasia severity: not reported | |
| 33 | Intensive: 12/4 | Intensive: 62 | Not reported | MTDDA (mean error score percentage) | |
| 31 | Conventional: 10/4 | Conventional: 63 | Not reported | MTDDA (mean error score percentage) | |
| 30 | Intensive: 12/4 | Intensive: 62 | Not reported | MTDDA (mean error score percentage) | |
| 30 | High‐intensity: 10/5 Low‐intensity: 9/6 | High‐intensity: 58.27 (SD 12.29; range 40‐77) Low‐intensity: 64.33 (SD 10.46; range 42‐79) | High‐intensity: 7.67 (SD 2.97; range 3‐13) weeks Low‐intensity: 7.47 (SD 3.60; range 4‐15) weeks | AQ: High‐intensity: 37.81 (SD 25.87) Low‐intensity: 41.72 (SD 23.95) | |
| 24 | CIAT: not reported No SLT: not reported | CIAT: not reported No SLT: not reported | CIAT: not reported No SLT: not reported | CIAT: not reported No SLT: not reported | |
| 10 | Task‐specific: 0/5 | Task‐specific: 61.8 (SD 17.05; range 40‐77) | Task‐specific: 21 (SD 22.4; range 5‐60) months | FE scale and M‐S Comprehension Test | |
| 50 | Self administered computer programme therapy ('speech‐first'): 17/5 Visuo‐spatial sham computer programme ("sham‐first"): 12/13 | Self administered computer programme therapy ('speech‐first'): 63 (SD 17.2; range 28‐91) Visuo‐spatial sham computer programme ('sham‐first'): 68 (SD 13.4; range 36‐86) | Self administered ('speech‐first'): 18 (SD 14.17) months Visuo‐spatial sham ('sham‐first'): 25 (SD 24.72) months | Aphasia severity: composite score on lexical and grammatical probes Self administered computer programme therapy ('speech‐first'): 8–40; M=27 (SD 10.66) Visuo‐spatial sham computer programme ('sham‐first'): 6–40; M=27 (SD 10.91) | |
| 59 | Intensive SLT: 14/18 Conventional SLT: 15/12 | Intensive SLT: 70.3 (SD 12.8) Conventional SLT: 67.7 (SD 15.4) | Intensive SLT:3.2 (SD 2.2) days Conventional SLT: 3.4 (SD 2.2) days | WABAQ median (IQR) Intensive SLT: 31.0 (47) Conventional SLT: 9.0 (34.1) | |
| 20 | CIAT: 9/3 Conventional: 3/5 | CIAT: 69.4 (SD 15.0) Conventional: 72.6 (SD 14.1) | CIAT: 4.8 (SD 2.3) days Conventional: 5.6 (SD 2.3) days | WABAQ mean (SD) CIAT: 42.5 (SD 27.2) Conventional: 45.1 (SD 28.5) | |
| 67 | Not reported | (15 weeks after stroke) | Group SLT: 4 weeks | (15 weeks after stroke) | |
| 78 | Conventional: not reported | Conventional: 59.2 (SD 6.7) | Conventional: 6.6 (SD 4.8) weeks | PICA overall percentile Conventional: 46.59 (SD 16.05) | |
| 83 | Volunteer‐facilitated: 37/6 | Volunteer‐facilitated: 60.2 (SD 6.7) | Volunteer‐facilitated: 7.1 (SD 5.8) weeks | PICA overall percentile | |
| 81 | Volunteer‐facilitated: 37/6 | Volunteer‐facilitated:60.2 (SD 6.7) | Volunteer‐facilitated: 7.1 (SD 5.8) weeks | PICA overall percentile | |
| 9 | CIAT: 2/3 BOX: 4/0 | CIAT: 63 (SD 8) BOX: 71 (SD 9) | CIAT: duration of aphasia: 61 (SD 48) months BOX: duration of aphasia: 52 (SD 25) months | Participants in both groups reported as moderate | |
| 10 | Remote telerehabilitation SLT: 4/1 Conventional: 3/2 | Remote telerehabilitation SLT: 58.6 (SD 14.38) Conventional: 57.8 (SD 15.14) | Remote telerehabilitation SLT: 31.8 (1SD 4.11) months Conventional: 35.2 (SD 33.16) months | CATs semantic score: Remote telerehabilitation SLT: 9.8 (SD 0.45) Conventional: 8.4 (SD 0.89) Naming score: Remote telerehabilitation SLT: 27.4 (SD 5.94) Conventional: 20.2 (SD 8.84) | |
| 10 | Teleconf supported SLT: 4/1 Teleconf supported conversation: 3/2 | Teleconf supported SLT: 58.6 (SD 14.38) Teleconf supported conversation: 57.8 (SD 15.14) | Teleconf supported SLT: 31.8 (SD 14.11) months Teleconf supported conversation: 35.2 (SD 33.16) months | CATs semantic score: Teleconf supported SLT: 9.8 (SD 0.45) Teleconf supported conversation: 8.4 (SD 0.89) | |
| 10 | Conventional SLT: 3/2 Teleconf supported conversation: 4/1 | Conventional SLT: 57.8 (SD 15.14) Teleconf supported conversation: 58.6 (SD 14.38) | Conventional SLT: 35.2 (SD 33.16) months Teleconf supported conversation: 31.8 (SD 14.11) months | CATs semantic score: Conventional SLT: 8.4(SD 0.89) Teleconf supported conversation: 8.4 (SD 0.89) | |
| 236 | Conventional: not reported | Conventional: (range 39‐81) | Not reported | Not reported | |
| 5 | Conventional: not reported | Conventional: not reported No SLT: not reported | Conventional: range 1‐3 months No SLT: not reported | Conventional: not reported No SLT: not reported | |
| 34 | Language training: not reported No SLT: not reported | Language training: not reported No SLT: not reported | Language training: not reported No SLT: not reported | Language training: not reported No SLT: not reported | |
| 60 | Group SLT: not reported | Group SLT: not reported | Not reported | Not reported | |
| 54 | Group SLT: not reported | Group SLT: not reported | Not reported | Not reported | |
| 54 | Group SLT: not reported | Group SLT: not reported | Not reported | Not reported | |
| 36 | SLT: 10/9 No SLT: 11/6 | SLT: 63.40 (SD 7.82) No SLT: 59.36 (SD 7.69) | SLT: 29.45 (SD 10.63) days No SLT: 27.80 (SD 9.79) days | ABC AQ SLT: 48.70 (SD 33.49) No SLT: 49.87 (SD 26.83) | |
| 37 | SLT: 11/9 No SLT: 11/6 | SLT: 60.80 (SD 8.13) No SLT: 59.36 (SD 7.69) | SLT: 28.10 (SD 9.15) days No SLT: 27.80 (SD 9.79) days | ABC AQ SLT: 48.43 (SD 29.18) No SLT: 49.87 (SD 26.83) | |
| 138 | Not reported | Not reported | Not reported | Not reported | |
| AAT: Aachen Aphasia Test; ABC: Aphasia Battery of Chinese; ANELT: Amsterdam‐Nijmegen Everyday Language Test;AQ: Aphasia Quotient; BDAE: Boston Diagnostic Aphasia Examination; BNT: Boston Naming Test; CAT: Comprehensive Aphasia Test; CIAT: Constraint Induced Aphasia Therapy;FCP: Functional Communication Profile; FE scale: Functional‐Expression scale;IQR: interquartile range; MIT: Melodic Intonation Therapy; M‐S Comprehension Test: Morpho‐Syntactic Comprehension Test; MTDDA: Minnesota Test for the Differential Diagnosis of Aphasia; NIHSS: National Institutes of Health Stroke Scale; PICA: Porch Index of Communicative Abilities; SD: standard deviation; SLT: Speech and Language therapy/therapist; SPICA: Shortened Porch Index of Communicative Abilities; STACDAP: Systematic Therapy for Auditory Comprehension Disorders in Aphasic Patients; TOMs: Therapy Outcome Measures; WAB: Western Aphasia Battery; WABAQ: Western Aphasia Battery Aphasia Quotient. | |||||
| Study ID | Dropouts by intervention | Reasons | Follow‐up | Reasons |
| Conventional: 8 Social support: 20 | Conventional: 4 died, 3 declined, 1 post randomisation exclusion, 2 non‐study SLT Social support: 7 died, 12 declined, 1 post randomisation exclusion, 18 non‐study SLT | No follow‐up | NA | |
| Intensive: 16 | Intensive: 2 died, 14 withdrew | Intensive: 4 | Not reported | |
| Computer SLT: 2 No SLT: 4 | Across trial including follow‐up: Computer SLT: 3 illness and changed circumstances, 1 further stroke. No SLT: 3 illness, 3 declined | Computer SLT: 2 No SLT: 2 | Across trial including follow‐up: Computer SLT: 3 illness and changed circumstances, 1 further stroke. No SLT: 3 illness, 3 declined | |
| MIT: unclear No SLT: unclear | Not reported | No follow‐up | NA | |
| Conventional: 23 | Conventional: 4 died, 5 new stroke, 2 self discharge, 5 illness, 3 moved, 4 other | Conventional: 11 | Not reported | |
| Computer‐mediated: 1 | Computer‐mediated: 1 illness | No follow‐up | NA | |
| Conventional: 2 | Conventional: 1 transport, 1 time constraints | Conventional: 0 | NA | |
| Computer‐mediated: 0 | Prolonged illness, new stroke, death | Computer‐mediated: 0 | NA | |
| Computer‐mediated: 0 | Prolonged illness, new stroke, death | Computer‐mediated: 0 | NA | |
| SLT: 3 No SLT: 6 | SLT: 1 death, 2 illness No SLT: 3 declined, 3 illness | At 6 months SLT: 9 No SLT: 6 | SLT: 4 death, 2 declined, 3 illness No SLT: 6 death | |
| Conventional: 21 | Conventional: 2 death, 3 new stroke, 3 transport, 4 declined, 2 moved, 5 illness, 2 transfer | Conventional: 0 | NA | |
| Social support: ? | Homesickness, illness | No follow‐up | NA | |
| Social support: ? | Homesickness, illness | No follow‐up | NA | |
| Social support: ? | Homesickness, illness | No follow‐up | NA | |
| Conventional: 78 | Death, refused, illness, recovered, unsuitable, relocated | No follow‐up | NA | |
| Volunteer‐facilitated: 0 | Not reported | No follow‐up | NA | |
| SLT:0 No SLT:0 | None | SLT:0 No SLT:1 | 1 died | |
| Conventional: 0 | Conventional: 0 | No follow‐up | NA | |
| MIT: 5 Control: 0 | MIT: 3 did not complete MIT; 2 did not complete post‐therapy assessment | NA (see MIT 2014ii) | NA | |
| MIT early + SLT: 3 SLT + delayed MIT: 2 | MIT early + SLT: 3 did not complete MIT early SLT + delayed MIT: 1 did not complete delayed MIT; 1 did not complete assessment | No follow‐up | NA | |
| Semantic: 6 | Semantic: 4 received < 40 h treatment, 2 severe neurological illness | No follow‐up | NA | |
| Cognitive linguistic: 4 Communicative: 6 | Cognitive linguistic: 3 illness, 1 refusal by therapist Communicative: 1 illness, 5 declined | No follow‐up | NA | |
| Language orientated: 6 | Language orientated: 1 death, 2 relocation, 3 withdrew | No follow‐up | NA | |
| Language orientated: 6 | Language orientated: 1 death, 2 relocation, 3 withdrew | No follow‐up | NA | |
| Conventional: 1 | Conventional: 1 death | No follow‐up | NA | |
| CIAT: unclear Conventional: unclear | Across the trial 54 withdrew as they were satisfied with the results. Unclear from which group. | CIAT: 35 Conventional: 39 | Not reported | |
| Conventional: 5 | Conventional: 3 uncooperative, 2 illness | Conventional: 7 | Conventional: 3 illness, 4 refused | |
| Intensive: 6 | Reasons not detailed | Intensive: 4 | Not reported | |
| Conventional: 2 | Reasons not detailed | Conventional: 4 | Not reported | |
| Intensive: 6 | Reasons not detailed | Intensive: 4 | Not reported | |
| CIAT: 6 Conventional: 6 | CIAT: 4 missed evaluation, 1 transferred, 1 died Conventional: 2 illness, 1 severe depression, 2 transfers, 1 died. | CIAT: 3 Conventional: 1 | CIAT: 3 declined Conventional: 1 missed evaluation | |
| CIAT: not reported No SLT:not reported | Not reported | CIAT: not reported No SLT:not reported | Not reported | |
| Computer SLT:2 No SLT:0 | Computer SLT: 1 withdrew; 1 researcher safety risk. No SLT: 0 | Cross‐over. No follow‐up | NA | |
| Early computer SLT:3 Late computer SLT: 0 | Early computer therapy: 1 withdrew; 1 researcher safety risk, 1 died Late computer therapy: 0 | Early computer therapy: 2 Late computer therapy: 1 | Early computer therapy: 2 withdrew Late computer therapy: 1 withdrew | |
| Intensive: 7 Conventional: 1 | Intensive: 4 declined, 2 discharged early, 1 died. Conventional: 1 declined | Intensive: 4 Conventional: 2 | Intensive: 4 refused Conventional: 1 refused, 1 death | |
| CIAT: 3 Conventional: 0 | CIAT: 3 Conventional: 0 | Across 12 and 26 week follow‐ups CIAT: 6 Conventional: 3 | CIAT: 12 weeks; 1 declined; 26 weeks (1 declined, 2 moved, 2 self reported language problems resolved) Conventional: 12 weeks: 1 moved; 26 weeks: 2 moved; 1 self reported language problems resolved) | |
| Group: 17 | 22 self discharged (return home or declined to travel), 4 illness, 2 stroke, 3 died, 2 returned to work | No follow‐up | NA | |
| Conventional: 7 | Illness, new stroke | Conventional: 2 | Illness, new stroke | |
| Volunteer‐facilitated: 6 | Illness, new stroke | Volunteer‐facilitated: 1 | Illness, new stroke | |
| Conventional: 7 | Illness, new stroke | Conventional: 2 | Illness, new stroke | |
| ANELT: Amsterdam‐Nijmegen Everyday Language Test; SLT: speech and language therapy. | ||||
| Outcome or subgroup title | No. of studies | No. of participants | Statistical method | Effect size |
| 1 Functional communication Show forest plot | 10 | 376 | Std. Mean Difference (IV, Fixed, 95% CI) | 0.28 [0.06, 0.49] |
| 1.1 WAB (spontaneous speech) | 2 | 55 | Std. Mean Difference (IV, Fixed, 95% CI) | 0.14 [‐0.40, 0.69] |
| 1.2 ANELT | 3 | 150 | Std. Mean Difference (IV, Fixed, 95% CI) | 0.18 [‐0.15, 0.50] |
| 1.3 AAT (spontaneous speech) | 1 | 12 | Std. Mean Difference (IV, Fixed, 95% CI) | 0.46 [‐0.69, 1.62] |
| 1.4 Functional Communication Profile | 2 | 103 | Std. Mean Difference (IV, Fixed, 95% CI) | 0.25 [‐0.16, 0.66] |
| 1.5 Chinese Functional Communication Examination | 2 | 56 | Std. Mean Difference (IV, Fixed, 95% CI) | 0.77 [0.18, 1.37] |
| 2 Receptive language: auditory comprehension Show forest plot | 10 | 399 | Std. Mean Difference (IV, Fixed, 95% CI) | 0.06 [‐0.15, 0.26] |
| 2.1 Token Test | 4 | 148 | Std. Mean Difference (IV, Fixed, 95% CI) | 0.15 [‐0.19, 0.48] |
| 2.2 Aphasia Battery of Chinese | 2 | 56 | Std. Mean Difference (IV, Fixed, 95% CI) | 0.08 [‐0.49, 0.65] |
| 2.3 PICA subtest | 2 | 55 | Std. Mean Difference (IV, Fixed, 95% CI) | 0.15 [‐0.40, 0.69] |
| 2.4 Norsk Grunntest for Afasi | 1 | 114 | Std. Mean Difference (IV, Fixed, 95% CI) | ‐0.01 [‐0.38, 0.36] |
| 2.5 CAT (spoken sentence comprehension) | 1 | 26 | Std. Mean Difference (IV, Fixed, 95% CI) | ‐0.36 [‐1.13, 0.42] |
| 3 Receptive language: reading comprehension Show forest plot | 8 | 253 | Std. Mean Difference (IV, Fixed, 95% CI) | 0.29 [0.03, 0.55] |
| 3.1 Reading Comprehension Battery for Aphasia | 2 | 103 | Std. Mean Difference (IV, Fixed, 95% CI) | 0.11 [‐0.30, 0.52] |
| 3.2 PICA reading subtest | 2 | 55 | Std. Mean Difference (IV, Fixed, 95% CI) | 0.12 [‐0.42, 0.67] |
| 3.3 Aphasia Battery of Chinese | 2 | 56 | Std. Mean Difference (IV, Fixed, 95% CI) | 0.88 [0.28, 1.48] |
| 3.4 AAT subtest | 1 | 12 | Std. Mean Difference (IV, Fixed, 95% CI) | 0.73 [‐0.45, 1.92] |
| 3.5 CAT (Written Word Comprehension) | 1 | 27 | Std. Mean Difference (IV, Fixed, 95% CI) | 0.11 [‐0.65, 0.87] |
| 4 Receptive language: other Show forest plot | 5 | 192 | Std. Mean Difference (IV, Random, 95% CI) | 1.23 [0.11, 2.36] |
| 4.1 PICA gestural subtest | 4 | 158 | Std. Mean Difference (IV, Random, 95% CI) | 0.34 [0.01, 0.67] |
| 4.2 Chinese Language Impairment Examination: comprehension | 1 | 34 | Std. Mean Difference (IV, Random, 95% CI) | 5.69 [4.10, 7.28] |
| 5 Expressive language: naming Show forest plot | 7 | 275 | Std. Mean Difference (IV, Fixed, 95% CI) | 0.14 [‐0.10, 0.38] |
| 5.1 Boston Naming Test | 1 | 18 | Std. Mean Difference (IV, Fixed, 95% CI) | ‐0.00 [‐0.93, 0.93] |
| 5.2 WAB Naming subtest | 2 | 55 | Std. Mean Difference (IV, Fixed, 95% CI) | 0.27 [‐0.27, 0.82] |
| 5.3 Norsk Grunntest for Afasi | 1 | 114 | Std. Mean Difference (IV, Fixed, 95% CI) | 0.02 [‐0.35, 0.39] |
| 5.4 AAT subtest | 1 | 12 | Std. Mean Difference (IV, Fixed, 95% CI) | 1.10 [‐0.15, 2.36] |
| 5.5 Object and Action Naming Battery (treated) | 1 | 28 | Std. Mean Difference (IV, Fixed, 95% CI) | ‐0.01 [‐0.75, 0.74] |
| 5.6 Naming accuracy (matched) | 1 | 48 | Std. Mean Difference (IV, Fixed, 95% CI) | 0.21 [‐0.36, 0.78] |
| 6 Expressive language: general Show forest plot | 7 | 248 | Std. Mean Difference (IV, Random, 95% CI) | 1.28 [0.38, 2.19] |
| 6.1 PICA Verbal subtest | 4 | 158 | Std. Mean Difference (IV, Random, 95% CI) | 0.26 [‐0.07, 0.59] |
| 6.2 Aphasia Battery of Chinese (verbal presentation) | 2 | 56 | Std. Mean Difference (IV, Random, 95% CI) | 1.99 [1.03, 2.95] |
| 6.3 Chinese Language Impairment Examination | 1 | 34 | Std. Mean Difference (IV, Random, 95% CI) | 4.65 [3.29, 6.00] |
| 7 Expressive language: written Show forest plot | 8 | 253 | Std. Mean Difference (IV, Fixed, 95% CI) | 0.41 [0.14, 0.67] |
| 7.1 PICA Writing subtest | 2 | 55 | Std. Mean Difference (IV, Fixed, 95% CI) | 0.34 [‐0.21, 0.89] |
| 7.2 PICA Graphic | 2 | 103 | Std. Mean Difference (IV, Fixed, 95% CI) | 0.25 [‐0.16, 0.66] |
| 7.3 Aphasia Battery of Chinese (Writing) | 2 | 56 | Std. Mean Difference (IV, Fixed, 95% CI) | 1.02 [0.41, 1.63] |
| 7.4 AAT subtest | 1 | 12 | Std. Mean Difference (IV, Fixed, 95% CI) | 1.46 [0.12, 2.80] |
| 7.5 CAT (Writing Picture Names) | 1 | 27 | Std. Mean Difference (IV, Fixed, 95% CI) | ‐0.20 [‐0.96, 0.56] |
| 8 Expressive language: written copying Show forest plot | 2 | Mean Difference (IV, Fixed, 95% CI) | Subtotals only | |
| 8.1 PICA Copying subtest | 2 | 55 | Mean Difference (IV, Fixed, 95% CI) | 3.88 [‐5.75, 13.50] |
| 9 Expressive language: repetition Show forest plot | 5 | 229 | Std. Mean Difference (IV, Fixed, 95% CI) | 0.12 [‐0.14, 0.38] |
| 9.1 WAB Repetition subtest | 2 | 55 | Std. Mean Difference (IV, Fixed, 95% CI) | 0.28 [‐0.27, 0.82] |
| 9.2 Norsk Grunntest for Afasi | 1 | 114 | Std. Mean Difference (IV, Fixed, 95% CI) | ‐0.04 [‐0.40, 0.33] |
| 9.3 AAT subtest | 1 | 12 | Std. Mean Difference (IV, Fixed, 95% CI) | 0.84 [‐0.36, 2.04] |
| 9.4 Repetition Accuracy (matched) | 1 | 48 | Std. Mean Difference (IV, Fixed, 95% CI) | 0.17 [‐0.40, 0.74] |
| 10 Expressive language: fluency Show forest plot | 1 | Mean Difference (IV, Fixed, 95% CI) | Totals not selected | |
| 10.1 Regensburg Word Fluency Test (Food) | 1 | Mean Difference (IV, Fixed, 95% CI) | 0.0 [0.0, 0.0] | |
| 10.2 Regensburg Word Fluency Test (Animals) | 1 | Mean Difference (IV, Fixed, 95% CI) | 0.0 [0.0, 0.0] | |
| 11 Severity of impairment: Aphasia Battery Score (+ PICA) Show forest plot | 11 | 593 | Std. Mean Difference (IV, Random, 95% CI) | 0.55 [‐0.14, 1.25] |
| 11.1 Aphasia Quotient (CRRCAE) | 2 | 84 | Std. Mean Difference (IV, Random, 95% CI) | 0.02 [‐0.43, 0.47] |
| 11.2 Porch Index of Communicative Ability | 4 | 165 | Std. Mean Difference (IV, Random, 95% CI) | 0.26 [‐0.07, 0.58] |
| 11.3 BDAE (Chinese) | 1 | 36 | Std. Mean Difference (IV, Random, 95% CI) | 0.52 [‐0.15, 1.18] |
| 11.4 Aphasia Battery of Chinese (ABC) | 2 | 56 | Std. Mean Difference (IV, Random, 95% CI) | 0.23 [‐0.34, 0.80] |
| 11.5 Norsk Grunntest for Afasi (Coefficient) | 1 | 114 | Std. Mean Difference (IV, Random, 95% CI) | 0.03 [‐0.34, 0.40] |
| 11.6 Chinese Aphasia Measurement | 1 | 138 | Std. Mean Difference (IV, Random, 95% CI) | 3.84 [3.25, 4.43] |
| 12 Mood: MAACL Show forest plot | 1 | Mean Difference (IV, Fixed, 95% CI) | Totals not selected | |
| 12.1 Anxiety Scale (MAACL) | 1 | Mean Difference (IV, Fixed, 95% CI) | 0.0 [0.0, 0.0] | |
| 12.2 Depression Scale (MAACL) | 1 | Mean Difference (IV, Fixed, 95% CI) | 0.0 [0.0, 0.0] | |
| 12.3 Hostility Scale (MAACL) | 1 | Mean Difference (IV, Fixed, 95% CI) | 0.0 [0.0, 0.0] | |
| 13 Economic outcomes Show forest plot | 1 | Std. Mean Difference (IV, Random, 95% CI) | Totals not selected | |
| 13.1 Costs per month (GBP) | 1 | Std. Mean Difference (IV, Random, 95% CI) | 0.0 [0.0, 0.0] | |
| 13.2 EQ‐5D | 1 | Std. Mean Difference (IV, Random, 95% CI) | 0.0 [0.0, 0.0] | |
| 13.3 EQ‐5D VAS | 1 | Std. Mean Difference (IV, Random, 95% CI) | 0.0 [0.0, 0.0] | |
| 14 Number of dropouts (any reason) Show forest plot | 13 | 921 | Odds Ratio (M‐H, Fixed, 95% CI) | 0.92 [0.66, 1.28] |
| 15 Adherence to allocated intervention Show forest plot | 4 | 248 | Odds Ratio (M‐H, Fixed, 95% CI) | 0.75 [0.30, 1.85] |
| Outcome or subgroup title | No. of studies | No. of participants | Statistical method | Effect size |
| 1 Functional communication Show forest plot | 2 | 111 | Std. Mean Difference (IV, Random, 95% CI) | 0.19 [‐0.80, 1.18] |
| 1.1 ANELT (6 month follow‐up) | 1 | 99 | Std. Mean Difference (IV, Random, 95% CI) | ‐0.18 [‐0.57, 0.22] |
| 1.2 AAT (spontaneous speech; 6 month follow‐up) | 1 | 12 | Std. Mean Difference (IV, Random, 95% CI) | 0.88 [‐0.33, 2.09] |
| 2 Receptive language: auditory comprehension Show forest plot | 2 | 111 | Mean Difference (IV, Fixed, 95% CI) | 1.38 [‐1.39, 4.15] |
| 2.1 Norsk Grunntest for Afasi (6 month follow‐up) | 1 | 99 | Mean Difference (IV, Fixed, 95% CI) | 0.12 [‐3.25, 3.49] |
| 2.2 AAT subtest (6 months follow‐up) | 1 | 12 | Mean Difference (IV, Fixed, 95% CI) | 4.0 [‐0.85, 8.85] |
| 3 Receptive language: reading comprehension Show forest plot | 1 | Mean Difference (IV, Fixed, 95% CI) | Totals not selected | |
| 3.1 AAT subtest (6 month follow‐up) | 1 | Mean Difference (IV, Fixed, 95% CI) | 0.0 [0.0, 0.0] | |
| 4 Expressive language: naming Show forest plot | 3 | 135 | Std. Mean Difference (IV, Random, 95% CI) | 0.07 [‐0.59, 0.73] |
| 4.1 Norsk Grunntest for Afasi (6 month follow‐up) | 1 | 99 | Std. Mean Difference (IV, Random, 95% CI) | ‐0.06 [‐0.45, 0.33] |
| 4.2 AAT subtest (6 month follow‐up) | 1 | 12 | Std. Mean Difference (IV, Random, 95% CI) | 1.21 [‐0.06, 2.49] |
| 4.3 Object and Action Naming Battery (treated; 3 month follow‐up) | 1 | 24 | Std. Mean Difference (IV, Random, 95% CI) | ‐0.39 [‐1.20, 0.42] |
| 5 Expressive language: written Show forest plot | 1 | Std. Mean Difference (IV, Fixed, 95% CI) | Totals not selected | |
| 5.1 AAT subtest (6 month follow‐up) | 1 | Std. Mean Difference (IV, Fixed, 95% CI) | 0.0 [0.0, 0.0] | |
| 6 Expressive language: repetition Show forest plot | 2 | 110 | Mean Difference (IV, Fixed, 95% CI) | ‐0.29 [‐2.62, 2.03] |
| 6.1 Norsk Grunntest for Afasi (6 month follow‐up) | 1 | 98 | Mean Difference (IV, Fixed, 95% CI) | ‐0.40 [‐2.73, 1.93] |
| 6.2 AAT subtest (6 month follow‐up) | 1 | 12 | Mean Difference (IV, Fixed, 95% CI) | 26.00 [‐10.49, 62.49] |
| 7 Severity of impairment: Aphasia Battery Score Show forest plot | 3 | 183 | Std. Mean Difference (IV, Random, 95% CI) | 0.37 [‐0.29, 1.04] |
| 7.1 Norsk Grunntest for Afasi (6 month follow‐up) | 1 | 99 | Std. Mean Difference (IV, Random, 95% CI) | ‐0.03 [‐0.42, 0.37] |
| 7.2 Aphasia Quotient (CRRCAE) 3 month follow‐up | 2 | 84 | Std. Mean Difference (IV, Random, 95% CI) | 0.62 [‐0.34, 1.58] |
| 8 Economic outcomes Show forest plot | 1 | Std. Mean Difference (IV, Fixed, 95% CI) | Totals not selected | |
| 8.1 EQ‐5D | 1 | Std. Mean Difference (IV, Fixed, 95% CI) | 0.0 [0.0, 0.0] | |
| 8.2 EQ‐5D VAS | 1 | Std. Mean Difference (IV, Fixed, 95% CI) | 0.0 [0.0, 0.0] | |
| 9 Number of dropouts (any reason) Show forest plot | 6 | 322 | Odds Ratio (M‐H, Fixed, 95% CI) | 0.73 [0.38, 1.39] |
| Outcome or subgroup title | No. of studies | No. of participants | Statistical method | Effect size |
| 1 Functional communication Show forest plot | 4 | Std. Mean Difference (IV, Random, 95% CI) | Subtotals only | |
| 1.1 Functional Communication Profile | 1 | 96 | Std. Mean Difference (IV, Random, 95% CI) | ‐0.10 [‐0.50, 0.30] |
| 1.2 TOMs | 1 | 136 | Std. Mean Difference (IV, Random, 95% CI) | 0.13 [‐0.20, 0.47] |
| 1.3 Discourse conversation: content words per turn | 2 | 15 | Std. Mean Difference (IV, Random, 95% CI) | ‐0.14 [‐1.22, 0.94] |
| 2 Receptive language: auditory comprehension Show forest plot | 2 | Mean Difference (IV, Fixed, 95% CI) | Totals not selected | |
| 2.1 PCB (sentence comprehension) | 1 | Mean Difference (IV, Fixed, 95% CI) | 0.0 [0.0, 0.0] | |
| 2.2 PCB (picture comprehension) | 1 | Mean Difference (IV, Fixed, 95% CI) | 0.0 [0.0, 0.0] | |
| 2.3 Token Test | 1 | Mean Difference (IV, Fixed, 95% CI) | 0.0 [0.0, 0.0] | |
| 3 Receptive language: other Show forest plot | 1 | Mean Difference (IV, Fixed, 95% CI) | Totals not selected | |
| 3.1 PICA gestural subtest | 1 | Mean Difference (IV, Fixed, 95% CI) | 0.0 [0.0, 0.0] | |
| 4 Expressive language:naming Show forest plot | 3 | 33 | Std. Mean Difference (IV, Random, 95% CI) | 1.24 [‐1.70, 4.18] |
| 4.1 Object Naming Test (ONT) | 1 | 18 | Std. Mean Difference (IV, Random, 95% CI) | ‐1.18 [‐2.25, ‐0.11] |
| 4.2 Spoken Picture Naming test | 2 | 15 | Std. Mean Difference (IV, Random, 95% CI) | 2.63 [‐0.11, 5.36] |
| 5 Expressive language: sentences Show forest plot | 1 | Mean Difference (IV, Fixed, 95% CI) | Totals not selected | |
| 5.1 Caplan & Hanna Test: total | 1 | Mean Difference (IV, Fixed, 95% CI) | 0.0 [0.0, 0.0] | |
| 5.2 Caplan & Hanna Test: treated | 1 | Mean Difference (IV, Fixed, 95% CI) | 0.0 [0.0, 0.0] | |
| 5.3 Caplan & Hanna Test: untreated | 1 | Mean Difference (IV, Fixed, 95% CI) | 0.0 [0.0, 0.0] | |
| 6 Expressive language: picture description Show forest plot | 2 | Std. Mean Difference (IV, Fixed, 95% CI) | Subtotals only | |
| 6.1 Picture description | 2 | 23 | Std. Mean Difference (IV, Fixed, 95% CI) | 0.26 [‐0.62, 1.15] |
| 6.2 Picture description with structure modelling: treated items | 1 | 5 | Std. Mean Difference (IV, Fixed, 95% CI) | 0.45 [‐1.44, 2.33] |
| 6.3 Picture description with structure modelling: untreated items | 1 | 5 | Std. Mean Difference (IV, Fixed, 95% CI) | 0.41 [‐1.46, 2.28] |
| 7 Expressive language: overall spoken Show forest plot | 1 | Mean Difference (IV, Fixed, 95% CI) | Totals not selected | |
| 7.1 PICA verbal subtest | 1 | Mean Difference (IV, Fixed, 95% CI) | 0.0 [0.0, 0.0] | |
| 8 Expressive language: written Show forest plot | 1 | Mean Difference (IV, Fixed, 95% CI) | Totals not selected | |
| 8.1 PICA graphic subtests | 1 | Mean Difference (IV, Fixed, 95% CI) | 0.0 [0.0, 0.0] | |
| 9 Expressive language: fluency Show forest plot | 1 | Std. Mean Difference (IV, Random, 95% CI) | Totals not selected | |
| 9.1 Word fluency | 1 | Std. Mean Difference (IV, Random, 95% CI) | 0.0 [0.0, 0.0] | |
| 10 Severity of impairment: Aphasia Battery Score Show forest plot | 1 | Mean Difference (IV, Fixed, 95% CI) | Totals not selected | |
| 10.1 PICA | 1 | Mean Difference (IV, Fixed, 95% CI) | 0.0 [0.0, 0.0] | |
| 11 Psychosocial impact Show forest plot | 1 | Std. Mean Difference (IV, Fixed, 95% CI) | Totals not selected | |
| 11.1 COAST | 1 | Std. Mean Difference (IV, Fixed, 95% CI) | 0.0 [0.0, 0.0] | |
| 11.2 Carer COAST | 1 | Std. Mean Difference (IV, Fixed, 95% CI) | 0.0 [0.0, 0.0] | |
| 12 Number of dropouts for any reason Show forest plot | 5 | 413 | Odds Ratio (M‐H, Fixed, 95% CI) | 0.51 [0.32, 0.81] |
| 13 Adherence to allocated intervention Show forest plot | 5 | 409 | Odds Ratio (M‐H, Fixed, 95% CI) | 0.18 [0.09, 0.37] |
| 14 Economic outcomes Show forest plot | 1 | Mean Difference (IV, Fixed, 95% CI) | Totals not selected | |
| 14.1 Cost data | 1 | Mean Difference (IV, Fixed, 95% CI) | 0.0 [0.0, 0.0] | |
| 14.2 Utility data | 1 | Mean Difference (IV, Fixed, 95% CI) | 0.0 [0.0, 0.0] | |
| Outcome or subgroup title | No. of studies | No. of participants | Statistical method | Effect size |
| 1 Functional communication Show forest plot | 2 | 84 | Mean Difference (IV, Random, 95% CI) | 11.75 [4.09, 19.40] |
| 1.1 Functional Communication Profile | 2 | 84 | Mean Difference (IV, Random, 95% CI) | 11.75 [4.09, 19.40] |
| 2 Receptive language: auditory comprehension Show forest plot | 2 | 42 | Std. Mean Difference (IV, Random, 95% CI) | 0.61 [‐0.81, 2.03] |
| 2.1 Token Test | 2 | 42 | Std. Mean Difference (IV, Random, 95% CI) | 0.61 [‐0.81, 2.03] |
| 3 Receptive language: reading comprehension Show forest plot | 1 | Mean Difference (IV, Fixed, 95% CI) | Totals not selected | |
| 3.1 AAT (Portuguese version) | 1 | Mean Difference (IV, Fixed, 95% CI) | 0.0 [0.0, 0.0] | |
| 4 Expressive language: naming Show forest plot | 2 | 42 | Std. Mean Difference (IV, Random, 95% CI) | 0.23 [‐0.38, 0.84] |
| 4.1 AAT naming subtest | 1 | 17 | Std. Mean Difference (IV, Random, 95% CI) | 0.34 [‐0.64, 1.31] |
| 4.2 Lisbon Aphasia Assessment Battery | 1 | 25 | Std. Mean Difference (IV, Random, 95% CI) | 0.16 [‐0.62, 0.95] |
| 5 Expressive language: written Show forest plot | 1 | Mean Difference (IV, Fixed, 95% CI) | Totals not selected | |
| 5.1 AAT (Portuguese version) (writing to dictation) | 1 | Mean Difference (IV, Fixed, 95% CI) | 0.0 [0.0, 0.0] | |
| 6 Expressive language: repetition Show forest plot | 2 | 42 | Std. Mean Difference (IV, Random, 95% CI) | ‐0.05 [‐0.66, 0.56] |
| 6.1 AAT repetition subtest | 1 | 17 | Std. Mean Difference (IV, Random, 95% CI) | ‐0.10 [‐1.07, 0.87] |
| 6.2 Lisbon Aphasia Assessment Battery | 1 | 25 | Std. Mean Difference (IV, Random, 95% CI) | ‐0.02 [‐0.80, 0.77] |
| 7 Expressive language: fluency Show forest plot | 1 | Mean Difference (IV, Fixed, 95% CI) | Totals not selected | |
| 7.1 Lisbon Aphasia Assessment Battery | 1 | Mean Difference (IV, Fixed, 95% CI) | 0.0 [0.0, 0.0] | |
| 8 Severity of impairment: Aphasia Battery Score Show forest plot | 5 | 187 | Std. Mean Difference (IV, Random, 95% CI) | 0.38 [0.07, 0.69] |
| 8.1 Aphasia Quotient (WAB) | 3 | 145 | Std. Mean Difference (IV, Random, 95% CI) | 0.35 [‐0.16, 0.85] |
| 8.2 AAT overall | 1 | 17 | Std. Mean Difference (IV, Random, 95% CI) | 0.23 [‐0.74, 1.20] |
| 8.3 Boston Diagnostic Aphasia Examination (10 weeks) | 1 | 25 | Std. Mean Difference (IV, Random, 95% CI) | 0.59 [‐0.22, 1.39] |
| 9 Mood Show forest plot | 1 | Mean Difference (IV, Fixed, 95% CI) | Totals not selected | |
| 9.1 Stroke Aphasia Depression Questionnaire (10 weeks) | 1 | Mean Difference (IV, Fixed, 95% CI) | 0.0 [0.0, 0.0] | |
| 10 Number of dropouts for any reason Show forest plot | 4 | 216 | Odds Ratio (M‐H, Fixed, 95% CI) | 2.35 [1.20, 4.60] |
| 11 Adherence to allocated intervention Show forest plot | 3 | 196 | Odds Ratio (M‐H, Fixed, 95% CI) | 4.63 [0.96, 22.40] |
| Outcome or subgroup title | No. of studies | No. of participants | Statistical method | Effect size |
| 1 Functional communication Show forest plot | 3 | Std. Mean Difference (IV, Random, 95% CI) | Subtotals only | |
| 1.1 FCP (3 month follow‐up) | 1 | 73 | Std. Mean Difference (IV, Random, 95% CI) | 0.07 [‐0.39, 0.53] |
| 1.2 Discourse conversation (content words per turn; 6 week follow‐up) | 2 | 15 | Std. Mean Difference (IV, Random, 95% CI) | ‐0.02 [‐1.10, 1.06] |
| 2 Expressive language: single words (6 week follow‐up) Show forest plot | 2 | 15 | Std. Mean Difference (IV, Random, 95% CI) | 2.25 [0.18, 4.32] |
| 2.1 Spoken Picture Naming test | 2 | 15 | Std. Mean Difference (IV, Random, 95% CI) | 2.25 [0.18, 4.32] |
| Outcome or subgroup title | No. of studies | No. of participants | Statistical method | Effect size |
| 1 Functional communication Show forest plot | 2 | Std. Mean Difference (IV, Random, 95% CI) | Subtotals only | |
| 1.1 Functional Communication Profile (40 weeks) | 2 | 77 | Std. Mean Difference (IV, Random, 95% CI) | 0.53 [0.07, 0.99] |
| 1.2 Discourse Analysis (6 months) | 1 | 59 | Std. Mean Difference (IV, Random, 95% CI) | 0.20 [‐0.31, 0.71] |
| 1.3 Functional Communication Profile (12 months) | 1 | 14 | Std. Mean Difference (IV, Random, 95% CI) | 0.12 [‐0.94, 1.18] |
| 2 Receptive language Show forest plot | 1 | Std. Mean Difference (IV, Random, 95% CI) | Subtotals only | |
| 2.1 Lisbon Aphasia Assessment Battery: auditory comprehension (40 weeks) | 1 | 18 | Std. Mean Difference (IV, Random, 95% CI) | 1.03 [0.03, 2.03] |
| 2.2 Lisbon Aphasia Assessment Battery: auditory comprehension (12 months) | 1 | 14 | Std. Mean Difference (IV, Random, 95% CI) | 1.64 [0.37, 2.92] |
| 2.3 Token Test: auditory comprehension (40 weeks) | 1 | 18 | Std. Mean Difference (IV, Random, 95% CI) | 0.56 [‐0.39, 1.50] |
| 2.4 Token Test: auditory comprehension (12 months) | 1 | 14 | Std. Mean Difference (IV, Random, 95% CI) | 0.86 [‐0.27, 1.98] |
| 2.5 AAT (Portuguese version): reading comprehension (40 weeks) | 1 | 18 | Std. Mean Difference (IV, Random, 95% CI) | 0.04 [‐0.89, 0.96] |
| 2.6 AAT (Portuguese version): reading comprehension (12 months) | 1 | 14 | Std. Mean Difference (IV, Random, 95% CI) | 0.35 [‐0.72, 1.42] |
| 3 Expressive language Show forest plot | 1 | Std. Mean Difference (IV, Random, 95% CI) | Totals not selected | |
| 3.1 Naming (50 weeks) | 1 | Std. Mean Difference (IV, Random, 95% CI) | 0.0 [0.0, 0.0] | |
| 3.2 Naming (62 weeks) | 1 | Std. Mean Difference (IV, Random, 95% CI) | 0.0 [0.0, 0.0] | |
| 3.3 Writing to dictation (50 weeks) | 1 | Std. Mean Difference (IV, Random, 95% CI) | 0.0 [0.0, 0.0] | |
| 3.4 Writing to dictation (62 weeks) | 1 | Std. Mean Difference (IV, Random, 95% CI) | 0.0 [0.0, 0.0] | |
| 3.5 Repetition (50 weeks) | 1 | Std. Mean Difference (IV, Random, 95% CI) | 0.0 [0.0, 0.0] | |
| 3.6 Repetition (62 weeks) | 1 | Std. Mean Difference (IV, Random, 95% CI) | 0.0 [0.0, 0.0] | |
| 3.7 Fluency (50 weeks) | 1 | Std. Mean Difference (IV, Random, 95% CI) | 0.0 [0.0, 0.0] | |
| 3.8 Fluency (62 weeks) | 1 | Std. Mean Difference (IV, Random, 95% CI) | 0.0 [0.0, 0.0] | |
| 4 Severity of impairment: Aphasia Battery Score Show forest plot | 3 | 143 | Std. Mean Difference (IV, Random, 95% CI) | 0.37 [‐0.03, 0.77] |
| 4.1 Aphasia Quotient (WAB) | 2 | 125 | Std. Mean Difference (IV, Random, 95% CI) | 0.29 [‐0.16, 0.74] |
| 4.2 Boston Diagnostic Aphasia Examination (50 weeks) | 1 | 18 | Std. Mean Difference (IV, Random, 95% CI) | 0.83 [‐0.14, 1.81] |
| 5 Mood Show forest plot | 1 | Mean Difference (IV, Fixed, 95% CI) | Totals not selected | |
| 5.1 Stroke Aphasia Depression Questionnaire (40 weeks) | 1 | Mean Difference (IV, Fixed, 95% CI) | 0.0 [0.0, 0.0] | |
| 5.2 Stroke Aphasia Depression Questionnaire (12 months) | 1 | Mean Difference (IV, Fixed, 95% CI) | 0.0 [0.0, 0.0] | |
| 6 Number of dropouts for any reason Show forest plot | 4 | 216 | Odds Ratio (M‐H, Fixed, 95% CI) | 1.41 [0.59, 3.34] |
| Outcome or subgroup title | No. of studies | No. of participants | Statistical method | Effect size |
| 1 Functional communication Show forest plot | 1 | Std. Mean Difference (IV, Random, 95% CI) | Totals not selected | |
| 1.1 Functional Communication Profile | 1 | Std. Mean Difference (IV, Random, 95% CI) | 0.0 [0.0, 0.0] | |
| 1.2 Discourse Analysis | 1 | Std. Mean Difference (IV, Random, 95% CI) | 0.0 [0.0, 0.0] | |
| 2 Receptive language: auditory comprehension (change from baseline) Show forest plot | 1 | Std. Mean Difference (IV, Random, 95% CI) | Totals not selected | |
| 2.1 AAT comprehension subtest | 1 | Std. Mean Difference (IV, Random, 95% CI) | 0.0 [0.0, 0.0] | |
| 2.2 Token Test | 1 | Std. Mean Difference (IV, Random, 95% CI) | 0.0 [0.0, 0.0] | |
| 3 Expressive language: spoken (change from baseline) Show forest plot | 1 | Std. Mean Difference (IV, Random, 95% CI) | Totals not selected | |
| 3.1 AAT naming subtest | 1 | Std. Mean Difference (IV, Random, 95% CI) | 0.0 [0.0, 0.0] | |
| 3.2 AAT repetition subtest | 1 | Std. Mean Difference (IV, Random, 95% CI) | 0.0 [0.0, 0.0] | |
| 4 Expressive language: written (change from baseline) Show forest plot | 1 | Mean Difference (IV, Fixed, 95% CI) | Totals not selected | |
| 4.1 AAT written subtest | 1 | Mean Difference (IV, Fixed, 95% CI) | 0.0 [0.0, 0.0] | |
| 5 Severity of impairment: Aphasia Battery Score Show forest plot | 3 | 145 | Std. Mean Difference (IV, Random, 95% CI) | 0.35 [‐0.16, 0.85] |
| 5.1 Aphasia Quotient (WAB) | 3 | 145 | Std. Mean Difference (IV, Random, 95% CI) | 0.35 [‐0.16, 0.85] |
| 6 Number of dropouts for any reason Show forest plot | 3 | 186 | Odds Ratio (M‐H, Fixed, 95% CI) | 2.01 [1.07, 3.79] |
| 7 Adherence to allocated intervention Show forest plot | 2 | 166 | Odds Ratio (M‐H, Fixed, 95% CI) | 5.13 [0.84, 31.18] |
| Outcome or subgroup title | No. of studies | No. of participants | Statistical method | Effect size |
| 1 Functional communication Show forest plot | 1 | Std. Mean Difference (IV, Random, 95% CI) | Totals not selected | |
| 1.1 Functional Communication Profile (40 weeks) | 1 | Std. Mean Difference (IV, Random, 95% CI) | 0.0 [0.0, 0.0] | |
| 1.2 Discourse Analysis (6 months) | 1 | Std. Mean Difference (IV, Random, 95% CI) | 0.0 [0.0, 0.0] | |
| 2 Severity of impairment: Aphasia Battery Score Show forest plot | 2 | 125 | Std. Mean Difference (IV, Random, 95% CI) | 0.29 [‐0.16, 0.74] |
| 2.1 Aphasia Quotient (WAB) | 2 | 125 | Std. Mean Difference (IV, Random, 95% CI) | 0.29 [‐0.16, 0.74] |
| 3 Number of dropouts for any reason Show forest plot | 3 | 186 | Odds Ratio (M‐H, Fixed, 95% CI) | 2.96 [1.36, 6.43] |
| Outcome or subgroup title | No. of studies | No. of participants | Statistical method | Effect size |
| 1 Functional communication Show forest plot | 1 | Std. Mean Difference (IV, Fixed, 95% CI) | Totals not selected | |
| 1.1 ANELT | 1 | Std. Mean Difference (IV, Fixed, 95% CI) | 0.0 [0.0, 0.0] | |
| 1.2 ANELT (4 weeks) | 1 | Std. Mean Difference (IV, Fixed, 95% CI) | 0.0 [0.0, 0.0] | |
| 1.3 CETI | 1 | Std. Mean Difference (IV, Fixed, 95% CI) | 0.0 [0.0, 0.0] | |
| 2 Receptive language: auditory comprehension Show forest plot | 1 | Mean Difference (IV, Fixed, 95% CI) | Totals not selected | |
| 2.1 Token Test | 1 | Mean Difference (IV, Fixed, 95% CI) | 0.0 [0.0, 0.0] | |
| 3 Expressive language: naming Show forest plot | 2 | 65 | Std. Mean Difference (IV, Random, 95% CI) | ‐0.19 [‐0.96, 0.58] |
| 3.1 AAT subtest | 1 | 18 | Std. Mean Difference (IV, Random, 95% CI) | ‐0.69 [‐1.65, 0.27] |
| 3.2 Naming accuracy (matched) | 1 | 47 | Std. Mean Difference (IV, Random, 95% CI) | 0.12 [‐0.45, 0.70] |
| 4 Expressive language: written Show forest plot | 1 | Mean Difference (IV, Fixed, 95% CI) | Totals not selected | |
| 4.1 AAT subtest | 1 | Mean Difference (IV, Fixed, 95% CI) | 0.0 [0.0, 0.0] | |
| 5 Expressive language: repetition Show forest plot | 2 | 65 | Std. Mean Difference (IV, Fixed, 95% CI) | ‐0.17 [‐0.65, 0.32] |
| 5.1 AAT subtest | 1 | 18 | Std. Mean Difference (IV, Fixed, 95% CI) | ‐0.49 [‐1.43, 0.45] |
| 5.2 Repetition accuracy (matched) | 1 | 47 | Std. Mean Difference (IV, Fixed, 95% CI) | ‐0.05 [‐0.62, 0.53] |
| 6 Expressive language: fluency Show forest plot | 1 | Mean Difference (IV, Fixed, 95% CI) | Totals not selected | |
| 6.1 Word fluency (food) | 1 | Mean Difference (IV, Fixed, 95% CI) | 0.0 [0.0, 0.0] | |
| 6.2 Word fluency (animals) | 1 | Mean Difference (IV, Fixed, 95% CI) | 0.0 [0.0, 0.0] | |
| 6.3 Word fluency (food; 1 month) | 1 | Mean Difference (IV, Fixed, 95% CI) | 0.0 [0.0, 0.0] | |
| 6.4 Word fluency (animals; 1 month) | 1 | Mean Difference (IV, Fixed, 95% CI) | 0.0 [0.0, 0.0] | |
| 7 Severity of impairment Show forest plot | 1 | Mean Difference (IV, Fixed, 95% CI) | Totals not selected | |
| 7.1 AAT overall | 1 | Mean Difference (IV, Fixed, 95% CI) | 0.0 [0.0, 0.0] | |
| 8 Number of dropouts for any reason Show forest plot | 2 | 77 | Odds Ratio (M‐H, Random, 95% CI) | 2.09 [0.30, 14.35] |
| Outcome or subgroup title | No. of studies | No. of participants | Statistical method | Effect size |
| 1 Expressive language: naming Show forest plot | 1 | Mean Difference (IV, Fixed, 95% CI) | Totals not selected | |
| 1.1 Naming accuracy (treated) | 1 | Mean Difference (IV, Fixed, 95% CI) | 0.0 [0.0, 0.0] | |
| 1.2 Naming accuracy (matched) | 1 | Mean Difference (IV, Fixed, 95% CI) | 0.0 [0.0, 0.0] | |
| 1.3 Naming accuracy (control) | 1 | Mean Difference (IV, Fixed, 95% CI) | 0.0 [0.0, 0.0] | |
| 2 Expressive language: repetition Show forest plot | 1 | Mean Difference (IV, Fixed, 95% CI) | Totals not selected | |
| 2.1 Repetition accuracy (treated) | 1 | Mean Difference (IV, Fixed, 95% CI) | 0.0 [0.0, 0.0] | |
| 2.2 Repetition accuracy (matched) | 1 | Mean Difference (IV, Fixed, 95% CI) | 0.0 [0.0, 0.0] | |
| 2.3 Repetition accuracy (control) | 1 | Mean Difference (IV, Fixed, 95% CI) | 0.0 [0.0, 0.0] | |
| 3 Number of dropouts for any reason Show forest plot | 1 | Odds Ratio (M‐H, Fixed, 95% CI) | Totals not selected | |
| Outcome or subgroup title | No. of studies | No. of participants | Statistical method | Effect size |
| 1 Functional communication Show forest plot | 2 | 50 | Std. Mean Difference (IV, Random, 95% CI) | 0.81 [0.23, 1.40] |
| 1.1 Discourse (content information units per minute) | 1 | 25 | Std. Mean Difference (IV, Random, 95% CI) | 0.62 [‐0.19, 1.44] |
| 1.2 Functional Communication Profile | 1 | 25 | Std. Mean Difference (IV, Random, 95% CI) | 1.02 [0.18, 1.86] |
| 2 Functional communication (follow‐up) Show forest plot | 1 | Std. Mean Difference (IV, Random, 95% CI) | Totals not selected | |
| 2.1 Functional Communication Profile (50 weeks follow‐up) | 1 | Std. Mean Difference (IV, Random, 95% CI) | 0.0 [0.0, 0.0] | |
| 2.2 Functional Communication Profile (1 year follow‐up) | 1 | Std. Mean Difference (IV, Random, 95% CI) | 0.0 [0.0, 0.0] | |
| 3 Receptive language: auditory comprehension Show forest plot | 2 | 42 | Std. Mean Difference (IV, Random, 95% CI) | 0.81 [0.17, 1.45] |
| 3.1 AAT comprehension subtest | 1 | 17 | Std. Mean Difference (IV, Random, 95% CI) | 0.47 [‐0.51, 1.45] |
| 3.2 Lisbon Aphasia Assessment Battery (simple commands) | 1 | 25 | Std. Mean Difference (IV, Random, 95% CI) | 1.06 [0.21, 1.90] |
| 4 Receptive language: comprehension (50 week follow‐up) Show forest plot | 1 | Mean Difference (IV, Fixed, 95% CI) | Totals not selected | |
| 4.1 Lisbon Aphasia Assessment Battery (simple commands) | 1 | Mean Difference (IV, Fixed, 95% CI) | 0.0 [0.0, 0.0] | |
| 4.2 Token Test | 1 | Mean Difference (IV, Fixed, 95% CI) | 0.0 [0.0, 0.0] | |
| 4.3 AAT (Portuguese version) Reading comprehension | 1 | Mean Difference (IV, Fixed, 95% CI) | 0.0 [0.0, 0.0] | |
| 5 Receptive language: comprehension (62 week follow‐up) Show forest plot | 1 | Mean Difference (IV, Fixed, 95% CI) | Totals not selected | |
| 5.1 Lisbon Aphasia Assessment Battery (simple commands) | 1 | Mean Difference (IV, Fixed, 95% CI) | 0.0 [0.0, 0.0] | |
| 5.2 Token Test | 1 | Mean Difference (IV, Fixed, 95% CI) | 0.0 [0.0, 0.0] | |
| 5.3 AAT (Portuguese version): reading comprehension | 1 | Mean Difference (IV, Fixed, 95% CI) | 0.0 [0.0, 0.0] | |
| 6 Receptive language: reading comprehension Show forest plot | 3 | 64 | Std. Mean Difference (IV, Random, 95% CI) | 0.18 [‐0.32, 0.67] |
| 6.1 WAB (reading comprehension) | 1 | 25 | Std. Mean Difference (IV, Random, 95% CI) | 0.15 [‐0.64, 0.94] |
| 6.2 AAT (Portuguese version) | 1 | 25 | Std. Mean Difference (IV, Random, 95% CI) | 0.28 [‐0.51, 1.06] |
| 6.3 Unknown | 1 | 14 | Std. Mean Difference (IV, Random, 95% CI) | 0.06 [‐0.99, 1.10] |
| 7 Expressive language: naming Show forest plot | 3 | 56 | Std. Mean Difference (IV, Fixed, 95% CI) | 0.23 [‐0.30, 0.76] |
| 7.1 AAT naming subtest | 1 | 17 | Std. Mean Difference (IV, Fixed, 95% CI) | 0.34 [‐0.64, 1.31] |
| 7.2 Lisbon Aphasia Assessment Battery | 1 | 25 | Std. Mean Difference (IV, Fixed, 95% CI) | 0.16 [‐0.62, 0.95] |
| 7.3 Thorndike‐Lorge Word List | 1 | 14 | Std. Mean Difference (IV, Fixed, 95% CI) | 0.23 [‐0.83, 1.28] |
| 8 Expressive language: written Show forest plot | 2 | 50 | Std. Mean Difference (IV, Random, 95% CI) | ‐0.01 [‐0.56, 0.55] |
| 8.1 WAB (writing) | 1 | 25 | Std. Mean Difference (IV, Random, 95% CI) | 0.16 [‐0.64, 0.95] |
| 8.2 AAT (Portuguese version) (writing to dictation) | 1 | 25 | Std. Mean Difference (IV, Random, 95% CI) | ‐0.16 [‐0.95, 0.62] |
| 9 Expressive language: repetition Show forest plot | 2 | 42 | Std. Mean Difference (IV, Random, 95% CI) | ‐0.05 [‐0.66, 0.56] |
| 9.1 AAT repetition subtest | 1 | 17 | Std. Mean Difference (IV, Random, 95% CI) | ‐0.10 [‐1.07, 0.87] |
| 9.2 Lisbon Aphasia Assessment Battery | 1 | 25 | Std. Mean Difference (IV, Random, 95% CI) | ‐0.02 [‐0.80, 0.77] |
| 10 Expressive language: fluency Show forest plot | 1 | Mean Difference (IV, Fixed, 95% CI) | Totals not selected | |
| 10.1 Lisbon Aphasia Assessment Battery | 1 | Mean Difference (IV, Fixed, 95% CI) | 0.0 [0.0, 0.0] | |
| 11 Expressive language: 50 and 62 weeks follow‐up Show forest plot | 1 | Mean Difference (IV, Fixed, 95% CI) | Totals not selected | |
| 11.1 Naming (50 weeks) | 1 | Mean Difference (IV, Fixed, 95% CI) | 0.0 [0.0, 0.0] | |
| 11.2 Repetition (50 weeks) | 1 | Mean Difference (IV, Fixed, 95% CI) | 0.0 [0.0, 0.0] | |
| 11.3 Fluency (50 weeks) | 1 | Mean Difference (IV, Fixed, 95% CI) | 0.0 [0.0, 0.0] | |
| 11.4 Writing to dictation (50 weeks) | 1 | Mean Difference (IV, Fixed, 95% CI) | 0.0 [0.0, 0.0] | |
| 11.5 Naming (62 weeks) | 1 | Mean Difference (IV, Fixed, 95% CI) | 0.0 [0.0, 0.0] | |
| 11.6 Repetition (62 weeks) | 1 | Mean Difference (IV, Fixed, 95% CI) | 0.0 [0.0, 0.0] | |
| 11.7 Fluency (62 weeks) | 1 | Mean Difference (IV, Fixed, 95% CI) | 0.0 [0.0, 0.0] | |
| 11.8 Writing to dictation (62 weeks) | 1 | Mean Difference (IV, Fixed, 95% CI) | 0.0 [0.0, 0.0] | |
| 12 Depression Show forest plot | 1 | Mean Difference (IV, Fixed, 95% CI) | Totals not selected | |
| 12.1 Stroke Aphasia Depression Questionnaire (10 weeks) | 1 | Mean Difference (IV, Fixed, 95% CI) | 0.0 [0.0, 0.0] | |
| 12.2 Stroke Aphasia Depression Questionnaire (50 weeks) | 1 | Mean Difference (IV, Fixed, 95% CI) | 0.0 [0.0, 0.0] | |
| 12.3 Stroke Aphasia Depression Questionnaire (62 weeks) | 1 | Mean Difference (IV, Fixed, 95% CI) | 0.0 [0.0, 0.0] | |
| 13 Severity of impairment: Aphasia Battery Score Show forest plot | 4 | 98 | Std. Mean Difference (IV, Random, 95% CI) | 0.22 [‐0.26, 0.71] |
| 13.1 WABAQ | 1 | 25 | Std. Mean Difference (IV, Random, 95% CI) | 0.57 [‐0.24, 1.38] |
| 13.2 PICA | 1 | 31 | Std. Mean Difference (IV, Random, 95% CI) | ‐0.38 [‐1.09, 0.33] |
| 13.3 AAT overall | 1 | 17 | Std. Mean Difference (IV, Random, 95% CI) | 0.23 [‐0.74, 1.20] |
| 13.4 Boston Diagnostic Aphasia Examination (10 weeks) | 1 | 25 | Std. Mean Difference (IV, Random, 95% CI) | 0.59 [‐0.22, 1.39] |
| 14 Severity of impairment: Aphasia Battery Score (follow‐up) Show forest plot | 1 | Std. Mean Difference (IV, Random, 95% CI) | Totals not selected | |
| 14.1 Boston Diagnostic Aphasia Examination (50 weeks) | 1 | Std. Mean Difference (IV, Random, 95% CI) | 0.0 [0.0, 0.0] | |
| 14.2 Boston Diagnostic Aphasia Examination (62 weeks) | 1 | Std. Mean Difference (IV, Random, 95% CI) | 0.0 [0.0, 0.0] | |
| 14.3 Aphasia Quotient (Lisbon Aphasia Assessment Battery) (50 weeks) | 1 | Std. Mean Difference (IV, Random, 95% CI) | 0.0 [0.0, 0.0] | |
| 14.4 Aphasia Quotient (Lisbon Aphasia Assessment Battery) (62 weeks) | 1 | Std. Mean Difference (IV, Random, 95% CI) | 0.0 [0.0, 0.0] | |
| 15 Number of dropouts for any reason Show forest plot | 1 | 31 | Odds Ratio (M‐H, Random, 95% CI) | 6.11 [0.27, 138.45] |
| 16 Adherence to allocated intervention Show forest plot | 1 | 31 | Odds Ratio (M‐H, Random, 95% CI) | 3.41 [0.13, 90.49] |
| Outcome or subgroup title | No. of studies | No. of participants | Statistical method | Effect size |
| 1 Functional communication Show forest plot | 3 | 46 | Std. Mean Difference (IV, Random, 95% CI) | 0.41 [‐0.19, 1.00] |
| 1.1 Pragmatic Protocol | 1 | 20 | Std. Mean Difference (IV, Random, 95% CI) | 0.24 [‐0.64, 1.12] |
| 1.2 ANELT | 1 | 9 | Std. Mean Difference (IV, Random, 95% CI) | 1.08 [‐0.40, 2.55] |
| 1.3 Discourse Analysis (% content information units per min) | 1 | 17 | Std. Mean Difference (IV, Random, 95% CI) | 0.32 [‐0.64, 1.28] |
| 2 Receptive language: auditory comprehension Show forest plot | 3 | Std. Mean Difference (IV, Fixed, 95% CI) | Subtotals only | |
| 2.1 Token Test | 3 | 60 | Std. Mean Difference (IV, Fixed, 95% CI) | 0.18 [‐0.34, 0.69] |
| 2.2 AAT comprehension subtest | 2 | 26 | Std. Mean Difference (IV, Fixed, 95% CI) | ‐0.00 [‐0.82, 0.81] |
| 3 Receptive language: other Show forest plot | 1 | Mean Difference (IV, Fixed, 95% CI) | Totals not selected | |
| 3.1 PICA gestural subtest | 1 | Mean Difference (IV, Fixed, 95% CI) | 0.0 [0.0, 0.0] | |
| 4 Expressive language: naming Show forest plot | 2 | Std. Mean Difference (IV, Random, 95% CI) | Subtotals only | |
| 4.1 AAT naming subtest | 2 | 26 | Std. Mean Difference (IV, Random, 95% CI) | 0.36 [‐0.42, 1.15] |
| 5 Expressive language: general Show forest plot | 1 | Std. Mean Difference (IV, Fixed, 95% CI) | Totals not selected | |
| 5.1 PICA verbal subtest | 1 | Std. Mean Difference (IV, Fixed, 95% CI) | 0.0 [0.0, 0.0] | |
| 6 Expressive language: repetition Show forest plot | 2 | Std. Mean Difference (IV, Fixed, 95% CI) | Subtotals only | |
| 6.1 AAT repetition subtest | 2 | 26 | Std. Mean Difference (IV, Fixed, 95% CI) | 0.00 [‐0.78, 0.78] |
| 7 Expressive language: written Show forest plot | 2 | 43 | Std. Mean Difference (IV, Fixed, 95% CI) | ‐0.22 [‐0.82, 0.38] |
| 7.1 PICA graphic | 1 | 34 | Std. Mean Difference (IV, Fixed, 95% CI) | ‐0.27 [‐0.95, 0.41] |
| 7.2 AAT written language subtest | 1 | 9 | Std. Mean Difference (IV, Fixed, 95% CI) | ‐0.04 [‐1.35, 1.28] |
| 8 Quality of life Show forest plot | 1 | Mean Difference (IV, Fixed, 95% CI) | Totals not selected | |
| 8.1 SAQoL | 1 | Mean Difference (IV, Fixed, 95% CI) | 0.0 [0.0, 0.0] | |
| 9 Severity of impairment: Aphasia Battery Score Show forest plot | 4 | 122 | Std. Mean Difference (IV, Random, 95% CI) | 0.15 [‐0.21, 0.50] |
| 9.1 Aphasia Quotient CRRCAE | 1 | 54 | Std. Mean Difference (IV, Random, 95% CI) | 0.30 [‐0.24, 0.84] |
| 9.2 PICA overall | 1 | 34 | Std. Mean Difference (IV, Random, 95% CI) | ‐0.06 [‐0.73, 0.61] |
| 9.3 AAT overall | 1 | 17 | Std. Mean Difference (IV, Random, 95% CI) | 0.23 [‐0.74, 1.20] |
| 9.4 Aphasia Quotient (WAB) | 1 | 17 | Std. Mean Difference (IV, Random, 95% CI) | ‐0.00 [‐0.96, 0.95] |
| 10 Number of dropouts for any reason Show forest plot | 2 | 87 | Odds Ratio (M‐H, Random, 95% CI) | 1.35 [0.31, 5.84] |
| Outcome or subgroup title | No. of studies | No. of participants | Statistical method | Effect size |
| 1 Functional communication Show forest plot | 1 | Mean Difference (IV, Random, 95% CI) | Totals not selected | |
| 1.1 Discourse Analysis (% content information units per min; 12 weeks) | 1 | Mean Difference (IV, Random, 95% CI) | 0.0 [0.0, 0.0] | |
| 1.2 Discourse Analysis (% content information units per min; 26 weeks) | 1 | Mean Difference (IV, Random, 95% CI) | 0.0 [0.0, 0.0] | |
| 2 Severity of impairment: Aphasia Battery Score Show forest plot | 2 | 70 | Std. Mean Difference (IV, Fixed, 95% CI) | 0.69 [0.19, 1.19] |
| 2.1 Aphasia Quotient CRRCAE (3‐month follow‐up) | 1 | 54 | Std. Mean Difference (IV, Fixed, 95% CI) | 1.04 [0.47, 1.62] |
| 2.2 Aphasia Quotient (WAB) (12 week follow‐up) | 1 | 16 | Std. Mean Difference (IV, Fixed, 95% CI) | ‐0.38 [‐1.37, 0.62] |
| 3 Quality of life Show forest plot | 1 | Mean Difference (IV, Fixed, 95% CI) | Totals not selected | |
| 3.1 SAQoL (12 weeks) | 1 | Mean Difference (IV, Fixed, 95% CI) | 0.0 [0.0, 0.0] | |
| 3.2 SAQoL (26 weeks) | 1 | Mean Difference (IV, Fixed, 95% CI) | 0.0 [0.0, 0.0] | |
| 4 Number of dropouts for any reason Show forest plot | 1 | 20 | Odds Ratio (M‐H, Random, 95% CI) | 2.0 [0.32, 12.51] |
| Outcome or subgroup title | No. of studies | No. of participants | Statistical method | Effect size |
| 1 Functional communication Show forest plot | 1 | Std. Mean Difference (IV, Random, 95% CI) | Totals not selected | |
| 1.1 CADL | 1 | Std. Mean Difference (IV, Random, 95% CI) | 0.0 [0.0, 0.0] | |
| 1.2 Functional Communication Profile | 1 | Std. Mean Difference (IV, Random, 95% CI) | 0.0 [0.0, 0.0] | |
| 2 Receptive language: auditory comprehension Show forest plot | 2 | Std. Mean Difference (IV, Fixed, 95% CI) | Subtotals only | |
| 2.1 Token Test | 2 | 88 | Std. Mean Difference (IV, Fixed, 95% CI) | 0.06 [‐0.36, 0.47] |
| 2.2 AAT subtest | 1 | 20 | Std. Mean Difference (IV, Fixed, 95% CI) | ‐0.37 [‐1.25, 0.52] |
| 3 Receptive language: reading comprehension Show forest plot | 2 | 88 | Std. Mean Difference (IV, Random, 95% CI) | ‐0.07 [‐0.49, 0.35] |
| 3.1 Reading Comprehension Battery for Aphasia | 1 | 68 | Std. Mean Difference (IV, Random, 95% CI) | 0.02 [‐0.46, 0.49] |
| 3.2 AAT subtest | 1 | 20 | Std. Mean Difference (IV, Random, 95% CI) | ‐0.37 [‐1.25, 0.52] |
| 4 Receptive language: other Show forest plot | 1 | Mean Difference (IV, Fixed, 95% CI) | Totals not selected | |
| 4.1 PICA gestural subtest | 1 | Mean Difference (IV, Fixed, 95% CI) | 0.0 [0.0, 0.0] | |
| 5 Expressive language: spoken Show forest plot | 2 | Std. Mean Difference (IV, Random, 95% CI) | Totals not selected | |
| 5.1 AAT naming subtest | 1 | Std. Mean Difference (IV, Random, 95% CI) | 0.0 [0.0, 0.0] | |
| 5.2 PICA verbal subtest | 1 | Std. Mean Difference (IV, Random, 95% CI) | 0.0 [0.0, 0.0] | |
| 6 Expressive language: repetition Show forest plot | 1 | Mean Difference (IV, Fixed, 95% CI) | Totals not selected | |
| 6.1 AAT repetition subtest | 1 | Mean Difference (IV, Fixed, 95% CI) | 0.0 [0.0, 0.0] | |
| 7 Expressive language: written Show forest plot | 2 | Std. Mean Difference (IV, Fixed, 95% CI) | Totals not selected | |
| 7.1 AAT written language subtest | 1 | Std. Mean Difference (IV, Fixed, 95% CI) | 0.0 [0.0, 0.0] | |
| 7.2 PICA graphic subtests | 1 | Std. Mean Difference (IV, Fixed, 95% CI) | 0.0 [0.0, 0.0] | |
| 8 Severity of impairment: Aphasia Battery Score Show forest plot | 3 | 126 | Std. Mean Difference (IV, Fixed, 95% CI) | ‐0.12 [‐0.47, 0.23] |
| 8.1 PICA | 2 | 106 | Std. Mean Difference (IV, Fixed, 95% CI) | ‐0.06 [‐0.44, 0.32] |
| 8.2 AAT | 1 | 20 | Std. Mean Difference (IV, Fixed, 95% CI) | ‐0.45 [‐1.34, 0.44] |
| 9 Number of dropouts for any reason Show forest plot | 3 | 206 | Odds Ratio (M‐H, Random, 95% CI) | 0.95 [0.49, 1.85] |
| 10 Adherence to allocated intervention Show forest plot | 2 | 125 | Odds Ratio (M‐H, Random, 95% CI) | 1.98 [0.52, 7.46] |
| Outcome or subgroup title | No. of studies | No. of participants | Statistical method | Effect size |
| 1 Functional communication Show forest plot | 3 | 55 | Std. Mean Difference (IV, Fixed, 95% CI) | 0.44 [‐0.10, 0.98] |
| 1.1 Pragmatic Protocol | 1 | 20 | Std. Mean Difference (IV, Fixed, 95% CI) | 0.24 [‐0.64, 1.12] |
| 1.2 Discourse (content information units per minute) | 1 | 25 | Std. Mean Difference (IV, Fixed, 95% CI) | 0.62 [‐0.19, 1.44] |
| 1.3 Discourse conversation: content words per turn | 1 | 10 | Std. Mean Difference (IV, Fixed, 95% CI) | 0.40 [‐0.86, 1.66] |
| 2 Receptive language Show forest plot | 2 | Std. Mean Difference (IV, Fixed, 95% CI) | Totals not selected | |
| 2.1 WAB (reading comprehension) | 1 | Std. Mean Difference (IV, Fixed, 95% CI) | 0.0 [0.0, 0.0] | |
| 2.2 PICA gestural subtest | 1 | Std. Mean Difference (IV, Fixed, 95% CI) | 0.0 [0.0, 0.0] | |
| 2.3 Token Test (auditory comprehension) | 1 | Std. Mean Difference (IV, Fixed, 95% CI) | 0.0 [0.0, 0.0] | |
| 3 Expressive language Show forest plot | 2 | Std. Mean Difference (IV, Random, 95% CI) | Totals not selected | |
| 3.1 Spoken Picture Naming test (Total) | 1 | Std. Mean Difference (IV, Random, 95% CI) | 0.0 [0.0, 0.0] | |
| 3.2 Spoken Picture Naming test (Treated) | 1 | Std. Mean Difference (IV, Random, 95% CI) | 0.0 [0.0, 0.0] | |
| 3.3 Spoken Picture Naming test (Untreated) | 1 | Std. Mean Difference (IV, Random, 95% CI) | 0.0 [0.0, 0.0] | |
| 3.4 PICA verbal subtest | 1 | Std. Mean Difference (IV, Random, 95% CI) | 0.0 [0.0, 0.0] | |
| 4 Expressive language: written Show forest plot | 2 | 59 | Std. Mean Difference (IV, Random, 95% CI) | ‐0.09 [‐0.61, 0.42] |
| 4.1 WAB (writing) | 1 | 25 | Std. Mean Difference (IV, Random, 95% CI) | 0.16 [‐0.64, 0.95] |
| 4.2 PICA graphic | 1 | 34 | Std. Mean Difference (IV, Random, 95% CI) | ‐0.27 [‐0.95, 0.41] |
| 5 Severity of impairment Show forest plot | 2 | 59 | Std. Mean Difference (IV, Random, 95% CI) | 0.21 [‐0.40, 0.82] |
| 5.1 WABAQ | 1 | 25 | Std. Mean Difference (IV, Random, 95% CI) | 0.57 [‐0.24, 1.38] |
| 5.2 PICA overall | 1 | 34 | Std. Mean Difference (IV, Random, 95% CI) | ‐0.06 [‐0.73, 0.61] |
| 6 Number of dropouts for any reason Show forest plot | 1 | 67 | Odds Ratio (M‐H, Random, 95% CI) | 0.94 [0.36, 2.46] |
| Outcome or subgroup title | No. of studies | No. of participants | Statistical method | Effect size |
| 1 Functional communication (6 weeks) Show forest plot | 1 | Std. Mean Difference (IV, Fixed, 95% CI) | Totals not selected | |
| 1.1 Discourse conversation: substantive turns | 1 | Std. Mean Difference (IV, Fixed, 95% CI) | 0.0 [0.0, 0.0] | |
| 1.2 Discourse conversation: content words per turn | 1 | Std. Mean Difference (IV, Fixed, 95% CI) | 0.0 [0.0, 0.0] | |
| 1.3 Discourse conversation: nouns per turn | 1 | Std. Mean Difference (IV, Fixed, 95% CI) | 0.0 [0.0, 0.0] | |
| 2 Expressive language: naming (6 weeks) Show forest plot | 1 | Mean Difference (IV, Fixed, 95% CI) | Totals not selected | |
| 2.1 Spoken Picture Naming test (total) | 1 | Mean Difference (IV, Fixed, 95% CI) | 0.0 [0.0, 0.0] | |
| 2.2 Spoken Picture Naming test (treated) | 1 | Mean Difference (IV, Fixed, 95% CI) | 0.0 [0.0, 0.0] | |
| 2.3 Spoken Picture Naming test (untreated) | 1 | Mean Difference (IV, Fixed, 95% CI) | 0.0 [0.0, 0.0] | |
| Outcome or subgroup title | No. of studies | No. of participants | Statistical method | Effect size |
| 1 Functional communication Show forest plot | 3 | 142 | Std. Mean Difference (IV, Random, 95% CI) | 0.02 [‐0.37, 0.40] |
| 1.1 ANELT | 3 | 142 | Std. Mean Difference (IV, Random, 95% CI) | 0.02 [‐0.37, 0.40] |
| 2 Receptive language: auditory comprehension Show forest plot | 2 | Std. Mean Difference (IV, Random, 95% CI) | Subtotals only | |
| 2.1 Token Test | 2 | 85 | Std. Mean Difference (IV, Random, 95% CI) | 0.07 [‐0.36, 0.50] |
| 2.2 AAT comprehension subtest | 1 | 9 | Std. Mean Difference (IV, Random, 95% CI) | 1.06 [‐0.41, 2.53] |
| 3 Receptive language: other Show forest plot | 3 | Std. Mean Difference (IV, Random, 95% CI) | Subtotals only | |
| 3.1 Semantic Association Test (verbal) | 3 | 120 | Std. Mean Difference (IV, Random, 95% CI) | 0.31 [‐0.05, 0.67] |
| 3.2 Semantic Association (PALPA) | 2 | 85 | Std. Mean Difference (IV, Random, 95% CI) | ‐0.09 [‐0.51, 0.34] |
| 3.3 Auditory Lexical Decision (PALPA) | 3 | 132 | Std. Mean Difference (IV, Random, 95% CI) | ‐0.37 [‐1.09, 0.34] |
| 3.4 Auditory Synonym Judgement | 1 | 9 | Std. Mean Difference (IV, Random, 95% CI) | 0.42 [‐0.92, 1.76] |
| 4 Expressive language: naming Show forest plot | 1 | Std. Mean Difference (IV, Random, 95% CI) | Totals not selected | |
| 4.1 AAT naming subtest | 1 | Std. Mean Difference (IV, Random, 95% CI) | 0.0 [0.0, 0.0] | |
| 4.2 Boston Naming Test | 1 | Std. Mean Difference (IV, Random, 95% CI) | 0.0 [0.0, 0.0] | |
| 5 Expressive language: written Show forest plot | 1 | Mean Difference (IV, Fixed, 95% CI) | Totals not selected | |
| 5.1 AAT subtest | 1 | Mean Difference (IV, Fixed, 95% CI) | 0.0 [0.0, 0.0] | |
| 6 Expressive language: repetition Show forest plot | 2 | Std. Mean Difference (IV, Random, 95% CI) | Subtotals only | |
| 6.1 Non‐word repetition (PALPA) | 2 | 85 | Std. Mean Difference (IV, Random, 95% CI) | 0.31 [‐0.12, 0.73] |
| 6.2 AAT repetition subtest | 1 | 9 | Std. Mean Difference (IV, Random, 95% CI) | 0.20 [‐1.12, 1.52] |
| 7 Expressive language: fluency Show forest plot | 1 | Std. Mean Difference (IV, Fixed, 95% CI) | Totals not selected | |
| 7.1 Word fluency (letters) | 1 | Std. Mean Difference (IV, Fixed, 95% CI) | 0.0 [0.0, 0.0] | |
| 7.2 Word fluency (semantic) | 1 | Std. Mean Difference (IV, Fixed, 95% CI) | 0.0 [0.0, 0.0] | |
| 8 Number of dropouts for any reason Show forest plot | 2 | 143 | Odds Ratio (M‐H, Fixed, 95% CI) | 0.83 [0.33, 2.09] |
| 9 Adherence to allocated intervention Show forest plot | 2 | 143 | Odds Ratio (M‐H, Fixed, 95% CI) | 1.05 [0.37, 2.97] |
| Outcome or subgroup title | No. of studies | No. of participants | Statistical method | Effect size |
| 1 Functional communication Show forest plot | 3 | 126 | Std. Mean Difference (IV, Random, 95% CI) | 0.15 [‐0.21, 0.50] |
| 1.1 AAT (spontaneous speech) | 1 | 100 | Std. Mean Difference (IV, Random, 95% CI) | 0.05 [‐0.34, 0.44] |
| 1.2 Discourse Analysis | 1 | 17 | Std. Mean Difference (IV, Random, 95% CI) | 0.32 [‐0.64, 1.28] |
| 1.3 ANELT | 1 | 9 | Std. Mean Difference (IV, Random, 95% CI) | 1.08 [‐0.40, 2.55] |
| 2 Receptive language: auditory comprehension Show forest plot | 3 | Std. Mean Difference (IV, Random, 95% CI) | Subtotals only | |
| 2.1 Token Test | 3 | 126 | Std. Mean Difference (IV, Random, 95% CI) | ‐0.04 [‐0.39, 0.31] |
| 2.2 AAT comprehension subtest | 3 | 126 | Std. Mean Difference (IV, Random, 95% CI) | ‐0.04 [‐0.61, 0.52] |
| 3 Receptive language: other Show forest plot | 1 | Std. Mean Difference (IV, Random, 95% CI) | Totals not selected | |
| 3.1 Semantic Association Test (Verbal) | 1 | Std. Mean Difference (IV, Random, 95% CI) | 0.0 [0.0, 0.0] | |
| 3.2 Semantic Association (PALPA) | 1 | Std. Mean Difference (IV, Random, 95% CI) | 0.0 [0.0, 0.0] | |
| 3.3 Auditory Lexical Decision: PALPA | 1 | Std. Mean Difference (IV, Random, 95% CI) | 0.0 [0.0, 0.0] | |
| 3.4 Auditory Synonym Judgement | 1 | Std. Mean Difference (IV, Random, 95% CI) | 0.0 [0.0, 0.0] | |
| 4 Expressive language: naming Show forest plot | 3 | Std. Mean Difference (IV, Random, 95% CI) | Subtotals only | |
| 4.1 AAT naming subtest | 3 | 126 | Std. Mean Difference (IV, Random, 95% CI) | 0.14 [‐0.22, 0.49] |
| 4.2 Boston Naming Test | 1 | 9 | Std. Mean Difference (IV, Random, 95% CI) | 0.0 [‐1.31, 1.31] |
| 5 Expressive language: repetition Show forest plot | 3 | Std. Mean Difference (IV, Random, 95% CI) | Subtotals only | |
| 5.1 AAT repetition subtest | 3 | 126 | Std. Mean Difference (IV, Random, 95% CI) | ‐0.02 [‐0.37, 0.33] |
| 5.2 Non‐words: PALPA | 1 | 9 | Std. Mean Difference (IV, Random, 95% CI) | 0.27 [‐1.06, 1.59] |
| 6 Expressive language: written Show forest plot | 2 | Mean Difference (IV, Random, 95% CI) | Subtotals only | |
| 6.1 AAT written language subtest | 2 | 109 | Mean Difference (IV, Random, 95% CI) | ‐1.96 [‐9.08, 5.16] |
| 7 Quality of life Show forest plot | 1 | Mean Difference (IV, Fixed, 95% CI) | Totals not selected | |
| 7.1 SAQoL | 1 | Mean Difference (IV, Fixed, 95% CI) | 0.0 [0.0, 0.0] | |
| 8 Severity of impairment Show forest plot | 2 | 34 | Std. Mean Difference (IV, Random, 95% CI) | 0.11 [‐0.57, 0.79] |
| 8.1 AAT overall | 1 | 17 | Std. Mean Difference (IV, Random, 95% CI) | 0.23 [‐0.74, 1.20] |
| 8.2 Aphasia Quotient (WAB) | 1 | 17 | Std. Mean Difference (IV, Random, 95% CI) | ‐0.00 [‐0.96, 0.95] |
| Outcome or subgroup title | No. of studies | No. of participants | Statistical method | Effect size |
| 1 Functional communication Show forest plot | 1 | Std. Mean Difference (IV, Random, 95% CI) | Totals not selected | |
| 1.1 Discourse Analysis score (12 weeks) | 1 | Std. Mean Difference (IV, Random, 95% CI) | 0.0 [0.0, 0.0] | |
| 1.2 Discourse Analysis score (26 weeks) | 1 | Std. Mean Difference (IV, Random, 95% CI) | 0.0 [0.0, 0.0] | |
| 2 Quality of life Show forest plot | 1 | Mean Difference (IV, Fixed, 95% CI) | Totals not selected | |
| 2.1 SAQoL (12 weeks) | 1 | Mean Difference (IV, Fixed, 95% CI) | 0.0 [0.0, 0.0] | |
| 2.2 SAQoL (26 weeks) | 1 | Mean Difference (IV, Fixed, 95% CI) | 0.0 [0.0, 0.0] | |
| 3 Severity of impairment Show forest plot | 1 | Mean Difference (IV, Random, 95% CI) | Totals not selected | |
| 3.1 Aphasia Quotient (WAB) (12 weeks) | 1 | Mean Difference (IV, Random, 95% CI) | 0.0 [0.0, 0.0] | |
| 3.2 Aphasia Quotient (WAB) (26 weeks) | 1 | Mean Difference (IV, Random, 95% CI) | 0.0 [0.0, 0.0] | |
| Outcome or subgroup title | No. of studies | No. of participants | Statistical method | Effect size |
| 1 Functional communication Show forest plot | 1 | Std. Mean Difference (IV, Random, 95% CI) | Totals not selected | |
| 1.1 Correct informational units (CIU) | 1 | Std. Mean Difference (IV, Random, 95% CI) | 0.0 [0.0, 0.0] | |
| 1.2 Utterances with new information (UIN) | 1 | Std. Mean Difference (IV, Random, 95% CI) | 0.0 [0.0, 0.0] | |
| 1.3 Grammatical sentences | 1 | Std. Mean Difference (IV, Random, 95% CI) | 0.0 [0.0, 0.0] | |
| 1.4 Propositions | 1 | Std. Mean Difference (IV, Random, 95% CI) | 0.0 [0.0, 0.0] | |
| 2 Expressive language Show forest plot | 1 | Std. Mean Difference (IV, Random, 95% CI) | Totals not selected | |
| 2.1 Picture‐naming probes | 1 | Std. Mean Difference (IV, Random, 95% CI) | 0.0 [0.0, 0.0] | |
| 2.2 Boston Naming Test | 1 | Std. Mean Difference (IV, Random, 95% CI) | 0.0 [0.0, 0.0] | |
| 2.3 Category Generation Probes | 1 | Std. Mean Difference (IV, Random, 95% CI) | 0.0 [0.0, 0.0] | |
| 3 Severity of impairment: Aphasia Battery Score Show forest plot | 1 | Mean Difference (IV, Fixed, 95% CI) | Totals not selected | |
| 3.1 WAB Aphasia Quotient | 1 | Mean Difference (IV, Fixed, 95% CI) | 0.0 [0.0, 0.0] | |
| 4 Functional communication (follow‐up) Show forest plot | 1 | Std. Mean Difference (IV, Fixed, 95% CI) | Totals not selected | |
| 4.1 Correct informational units (CIU) | 1 | Std. Mean Difference (IV, Fixed, 95% CI) | 0.0 [0.0, 0.0] | |
| 4.2 Utterances with new information (UIN) | 1 | Std. Mean Difference (IV, Fixed, 95% CI) | 0.0 [0.0, 0.0] | |
| 4.3 Grammatical sentences | 1 | Std. Mean Difference (IV, Fixed, 95% CI) | 0.0 [0.0, 0.0] | |
| 4.4 Propositions | 1 | Std. Mean Difference (IV, Fixed, 95% CI) | 0.0 [0.0, 0.0] | |
| 5 Expressive language: (follow‐up) Show forest plot | 1 | Std. Mean Difference (IV, Fixed, 95% CI) | Totals not selected | |
| 5.1 Picture‐naming probes (3 month follow‐up) | 1 | Std. Mean Difference (IV, Fixed, 95% CI) | 0.0 [0.0, 0.0] | |
| 5.2 Boston Naming Test (3 month follow‐up) | 1 | Std. Mean Difference (IV, Fixed, 95% CI) | 0.0 [0.0, 0.0] | |
| 5.3 Category Generation Probes (3 month follow‐up) | 1 | Std. Mean Difference (IV, Fixed, 95% CI) | 0.0 [0.0, 0.0] | |
| 6 Severity of impairment: Aphasia Battery Score (follow‐up) Show forest plot | 1 | Mean Difference (IV, Fixed, 95% CI) | Totals not selected | |
| 6.1 WAB Aphasia Quotient (3 month follow‐up) | 1 | Mean Difference (IV, Fixed, 95% CI) | 0.0 [0.0, 0.0] | |
| Outcome or subgroup title | No. of studies | No. of participants | Statistical method | Effect size |
| 1 Functional communication Show forest plot | 1 | Std. Mean Difference (IV, Fixed, 95% CI) | Totals not selected | |
| 1.1 ANELT | 1 | Std. Mean Difference (IV, Fixed, 95% CI) | 0.0 [0.0, 0.0] | |
| 1.2 Content information units (Sabadel) narrative discourse | 1 | Std. Mean Difference (IV, Fixed, 95% CI) | 0.0 [0.0, 0.0] | |
| 2 Expressive language: naming Show forest plot | 1 | Mean Difference (IV, Fixed, 95% CI) | Totals not selected | |
| 2.1 AAT naming subtest | 1 | Mean Difference (IV, Fixed, 95% CI) | 0.0 [0.0, 0.0] | |
| 3 Expressive language: repetition Show forest plot | 1 | Std. Mean Difference (IV, Random, 95% CI) | Totals not selected | |
| 3.1 AAT repetition subtest | 1 | Std. Mean Difference (IV, Random, 95% CI) | 0.0 [0.0, 0.0] | |
| 3.2 MIT repetition (trained Items) | 1 | Std. Mean Difference (IV, Random, 95% CI) | 0.0 [0.0, 0.0] | |
| 3.3 MIT repetition (untrained items) | 1 | Std. Mean Difference (IV, Random, 95% CI) | 0.0 [0.0, 0.0] | |
| 4 Number of dropouts for any reason Show forest plot | 1 | Odds Ratio (M‐H, Random, 95% CI) | Totals not selected | |
| Outcome or subgroup title | No. of studies | No. of participants | Statistical method | Effect size |
| 1 Functional communication Show forest plot | 1 | Mean Difference (IV, Fixed, 95% CI) | Totals not selected | |
| 1.1 CETI | 1 | Mean Difference (IV, Fixed, 95% CI) | 0.0 [0.0, 0.0] | |
| Outcome or subgroup title | No. of studies | No. of participants | Statistical method | Effect size |
| 1 Receptive language: auditory comprehension Show forest plot | 3 | Std. Mean Difference (IV, Fixed, 95% CI) | Subtotals only | |
| 1.1 Word comprehension (BDAE subtest) | 1 | 12 | Std. Mean Difference (IV, Fixed, 95% CI) | 0.13 [‐1.01, 1.26] |
| 1.2 Peabody PVT | 1 | 12 | Std. Mean Difference (IV, Fixed, 95% CI) | 0.13 [‐1.01, 1.26] |
| 1.3 Token Test | 3 | 36 | Std. Mean Difference (IV, Fixed, 95% CI) | 0.23 [‐0.43, 0.89] |
| 2 Receptive language: other Show forest plot | 3 | Mean Difference (IV, Fixed, 95% CI) | Subtotals only | |
| 2.1 PICA gestural subtest | 3 | 36 | Mean Difference (IV, Fixed, 95% CI) | ‐0.29 [‐0.97, 0.39] |
| 3 Expressive language: spoken Show forest plot | 3 | Std. Mean Difference (IV, Fixed, 95% CI) | Subtotals only | |
| 3.1 Naming | 3 | 36 | Std. Mean Difference (IV, Fixed, 95% CI) | ‐0.25 [‐0.92, 0.41] |
| 3.2 Word fluency | 2 | 24 | Std. Mean Difference (IV, Fixed, 95% CI) | ‐1.05 [‐1.93, ‐0.17] |
| 3.3 Picture description | 2 | 24 | Std. Mean Difference (IV, Fixed, 95% CI) | ‐0.20 [‐1.04, 0.64] |
| 3.4 PICA verbal subtest | 3 | 36 | Std. Mean Difference (IV, Fixed, 95% CI) | ‐0.31 [‐0.99, 0.37] |
| 4 Expressive language: written Show forest plot | 3 | Mean Difference (IV, Fixed, 95% CI) | Subtotals only | |
| 4.1 PICA graphic subtest | 3 | 36 | Mean Difference (IV, Fixed, 95% CI) | ‐0.85 [‐1.69, ‐0.01] |
| 5 Severity of impairment Show forest plot | 3 | Mean Difference (IV, Fixed, 95% CI) | Subtotals only | |
| 5.1 PICA overall | 3 | 36 | Mean Difference (IV, Fixed, 95% CI) | ‐0.74 [‐1.50, 0.01] |
| Outcome or subgroup title | No. of studies | No. of participants | Statistical method | Effect size |
| 1 Receptive language: auditory comprehension Show forest plot | 1 | Mean Difference (IV, Fixed, 95% CI) | Totals not selected | |
| 1.1 WAB auditory comprehension | 1 | Mean Difference (IV, Fixed, 95% CI) | 0.0 [0.0, 0.0] | |
| 2 Receptive language: reading Show forest plot | 1 | Std. Mean Difference (IV, Fixed, 95% CI) | Totals not selected | |
| 2.1 Computer‐based verb Test (treated items) | 1 | Std. Mean Difference (IV, Fixed, 95% CI) | 0.0 [0.0, 0.0] | |
| 2.2 Computer‐based verb test (untreated items) | 1 | Std. Mean Difference (IV, Fixed, 95% CI) | 0.0 [0.0, 0.0] | |
| 2.3 Real World Verb Test (treated items) | 1 | Std. Mean Difference (IV, Fixed, 95% CI) | 0.0 [0.0, 0.0] | |
| 2.4 Real World Verb Test (untreated items) | 1 | Std. Mean Difference (IV, Fixed, 95% CI) | 0.0 [0.0, 0.0] | |
| 2.5 Computer‐based preposition test (treated items) | 1 | Std. Mean Difference (IV, Fixed, 95% CI) | 0.0 [0.0, 0.0] | |
| 2.6 Computer‐based preposition test (untreated items) | 1 | Std. Mean Difference (IV, Fixed, 95% CI) | 0.0 [0.0, 0.0] | |
| 2.7 Real World Preposition Test (treated items) | 1 | Std. Mean Difference (IV, Fixed, 95% CI) | 0.0 [0.0, 0.0] | |
| 2.8 Real World Preposition Test (untreated items) | 1 | Std. Mean Difference (IV, Fixed, 95% CI) | 0.0 [0.0, 0.0] | |
| 2.9 Morphology | 1 | Std. Mean Difference (IV, Fixed, 95% CI) | 0.0 [0.0, 0.0] | |
| 3 Expressive language Show forest plot | 1 | Std. Mean Difference (IV, Fixed, 95% CI) | Totals not selected | |
| 3.1 WAB naming subtest | 1 | Std. Mean Difference (IV, Fixed, 95% CI) | 0.0 [0.0, 0.0] | |
| 3.2 WAB fluency subtest | 1 | Std. Mean Difference (IV, Fixed, 95% CI) | 0.0 [0.0, 0.0] | |
| 3.3 WAB repetition subtest | 1 | Std. Mean Difference (IV, Fixed, 95% CI) | 0.0 [0.0, 0.0] | |
| 4 Severity of impairment: Aphasia Battery Score Show forest plot | 1 | Mean Difference (IV, Fixed, 95% CI) | Totals not selected | |
| 4.1 WABAQ | 1 | Mean Difference (IV, Fixed, 95% CI) | 0.0 [0.0, 0.0] | |
| Outcome or subgroup title | No. of studies | No. of participants | Statistical method | Effect size |
| 1 Functional communication Show forest plot | 1 | Mean Difference (IV, Fixed, 95% CI) | Totals not selected | |
| 1.1 Discourse (recount, procedural, exposition) number of utterances | 1 | Mean Difference (IV, Fixed, 95% CI) | 0.0 [0.0, 0.0] | |
| 2 Receptive language: word comprehension Show forest plot | 1 | Mean Difference (IV, Fixed, 95% CI) | Totals not selected | |
| 2.1 Northwestern Assessment of Verbs and Sentences | 1 | Mean Difference (IV, Fixed, 95% CI) | 0.0 [0.0, 0.0] | |
| 3 Expressive language: naming Show forest plot | 1 | Mean Difference (IV, Fixed, 95% CI) | Totals not selected | |
| 3.1 Object and Action Naming Battery (objects) | 1 | Mean Difference (IV, Fixed, 95% CI) | 0.0 [0.0, 0.0] | |
| Outcome or subgroup title | No. of studies | No. of participants | Statistical method | Effect size |
| 1 Functional communication Show forest plot | 1 | Mean Difference (IV, Fixed, 95% CI) | Totals not selected | |
| 1.1 Functional expression | 1 | Mean Difference (IV, Fixed, 95% CI) | 0.0 [0.0, 0.0] | |
| 2 Expressive language: spoken sentence Show forest plot | 1 | Mean Difference (IV, Fixed, 95% CI) | Totals not selected | |
| 2.1 Sentence construction (AmAT) | 1 | Mean Difference (IV, Fixed, 95% CI) | 0.0 [0.0, 0.0] | |
| 2.2 Sentence construction (AmAT) 3‐week follow‐up | 1 | Mean Difference (IV, Fixed, 95% CI) | 0.0 [0.0, 0.0] | |
| 3 Expressive language: naming Show forest plot | 1 | Mean Difference (IV, Fixed, 95% CI) | Totals not selected | |
| 3.1 AmAT naming test | 1 | Mean Difference (IV, Fixed, 95% CI) | 0.0 [0.0, 0.0] | |
| 4 Expressive language: naming (follow‐up) Show forest plot | 1 | Mean Difference (IV, Fixed, 95% CI) | Totals not selected | |
| 4.1 AmAT Naming Test (3‐week follow‐up) | 1 | Mean Difference (IV, Fixed, 95% CI) | 0.0 [0.0, 0.0] | |
| 5 Expressive language: spoken sentence Show forest plot | 1 | Mean Difference (IV, Fixed, 95% CI) | Totals not selected | |
| 5.1 Sentence construction (AmAT) | 1 | Mean Difference (IV, Fixed, 95% CI) | 0.0 [0.0, 0.0] | |
| 5.2 Sentence construction (AmAT) 3‐week follow‐up | 1 | Mean Difference (IV, Fixed, 95% CI) | 0.0 [0.0, 0.0] | |
| 6 Expressive language: treated items Show forest plot | 1 | Std. Mean Difference (IV, Fixed, 95% CI) | Totals not selected | |
| 6.1 Naming (treated) | 1 | Std. Mean Difference (IV, Fixed, 95% CI) | 0.0 [0.0, 0.0] | |
| 6.2 Sentence construction (treated) | 1 | Std. Mean Difference (IV, Fixed, 95% CI) | 0.0 [0.0, 0.0] | |
| 6.3 Naming (treated: 3‐week follow‐up) | 1 | Std. Mean Difference (IV, Fixed, 95% CI) | 0.0 [0.0, 0.0] | |
| 6.4 Sentence construction (treated: 3‐week follow‐up) | 1 | Std. Mean Difference (IV, Fixed, 95% CI) | 0.0 [0.0, 0.0] | |
| Outcome or subgroup title | No. of studies | No. of participants | Statistical method | Effect size |
| 1 Number of dropouts for any reason Show forest plot | 1 | Odds Ratio (M‐H, Random, 95% CI) | Totals not selected | |
| 2 Adherence to allocated intervention Show forest plot | 1 | Odds Ratio (M‐H, Fixed, 95% CI) | Totals not selected | |
| Outcome or subgroup title | No. of studies | No. of participants | Statistical method | Effect size |
| 1 Functional communication Show forest plot | 1 | Mean Difference (IV, Fixed, 95% CI) | Totals not selected | |
| 1.1 Functional expression | 1 | Mean Difference (IV, Fixed, 95% CI) | 0.0 [0.0, 0.0] | |
| 2 Receptive language: word comprehension Show forest plot | 1 | Std. Mean Difference (IV, Fixed, 95% CI) | Totals not selected | |
| 2.1 Word comprehension (BDAE subtest) | 1 | Std. Mean Difference (IV, Fixed, 95% CI) | 0.0 [0.0, 0.0] | |
| 2.2 Identify body part (BDAE subtest) | 1 | Std. Mean Difference (IV, Fixed, 95% CI) | 0.0 [0.0, 0.0] | |
| 3 Receptive language: other auditory comprehension Show forest plot | 1 | Std. Mean Difference (IV, Fixed, 95% CI) | Totals not selected | |
| 3.1 Sentence comprehension | 1 | Std. Mean Difference (IV, Fixed, 95% CI) | 0.0 [0.0, 0.0] | |
| 3.2 Token Test | 1 | Std. Mean Difference (IV, Fixed, 95% CI) | 0.0 [0.0, 0.0] | |
| 4 Receptive language: auditory comprehension (treated items) Show forest plot | 1 | Std. Mean Difference (IV, Fixed, 95% CI) | Totals not selected | |
| 4.1 Word comprehension (phonology) | 1 | Std. Mean Difference (IV, Fixed, 95% CI) | 0.0 [0.0, 0.0] | |
| 4.2 Word comprehension (lexicon) | 1 | Std. Mean Difference (IV, Fixed, 95% CI) | 0.0 [0.0, 0.0] | |
| 4.3 Sentence comprehension (morphosyntax) | 1 | Std. Mean Difference (IV, Fixed, 95% CI) | 0.0 [0.0, 0.0] | |
| 5 Receptive language: reading comprehension Show forest plot | 1 | Mean Difference (IV, Random, 95% CI) | Totals not selected | |
| 5.1 Reading comprehension | 1 | Mean Difference (IV, Random, 95% CI) | 0.0 [0.0, 0.0] | |
| 6 Expressive language: naming Show forest plot | 1 | Mean Difference (IV, Fixed, 95% CI) | Totals not selected | |
| 6.1 AmAT naming test | 1 | Mean Difference (IV, Fixed, 95% CI) | 0.0 [0.0, 0.0] | |
| 7 Expressive language: spoken sentence Show forest plot | 1 | Mean Difference (IV, Fixed, 95% CI) | Totals not selected | |
| 7.1 Sentence construction (AmAT) | 1 | Mean Difference (IV, Fixed, 95% CI) | 0.0 [0.0, 0.0] | |
| Outcome or subgroup title | No. of studies | No. of participants | Statistical method | Effect size |
| 1 Expressive language: naming Show forest plot | 1 | Mean Difference (IV, Fixed, 95% CI) | Totals not selected | |
| 1.1 Thorndike‐Lorge Word List | 1 | Mean Difference (IV, Fixed, 95% CI) | 0.0 [0.0, 0.0] | |
| 2 Receptive language: reading comprehension Show forest plot | 1 | Mean Difference (IV, Fixed, 95% CI) | Totals not selected | |
| 2.1 Reading comprehension | 1 | Mean Difference (IV, Fixed, 95% CI) | 0.0 [0.0, 0.0] | |