Fármacos antiinflamatorios no esteroideos para la menorragia
Resumen
Antecedentes
La menorragia es una causa importante de problemas de salud en las mujeres premenopáusicas. Aunque la cirugía se utiliza a menudo como tratamiento, también se encuentran disponibles varios tratamientos médicos. Los fármacos antiinflamatorios no esteroideos (AINE) reducen los niveles de prostaglandina que se encuentran elevados en las mujeres con sangrado menstrual abundante y también pueden tener un efecto beneficioso sobre la dismenorrea.
Objetivos
Determinar la efectividad, la seguridad y la tolerabilidad de los AINE para lograr una reducción de la pérdida sanguínea menstrual (PSM) en mujeres en edad reproductiva con SMA.
Métodos de búsqueda
En abril de 2019, se realizaron búsquedas en el Registro especializado del Grupo Cochrane de Ginecología y Fertilidad (Cochrane Gynaecology and Fertility), el Registro Cochrane Central de Estudios en Línea (Cochrane Central Register of Studies Online, CENTRAL CRSO), MEDLINE, Embase, PsycINFO, los registros de ensayos clínicos y las listas de referencias de los artículos.
Criterios de selección
Los criterios de inclusión consistieron en comparaciones aleatorizadas de AINE individuales o combinados con otros tratamientos entre sí, con placebo u otros tratamientos médicos en mujeres con períodos regulares de sangrado abundante, medido de forma objetiva o subjetiva, y sin causas patológicas o iatrogénicas (inducidas por un tratamiento) del SMA.
Obtención y análisis de los datos
Se identificaron 19 ensayos controlados aleatorizados (ECA) (759 mujeres) que cumplieron con los criterios de inclusión para esta revisión y dos autores de la revisión extrajeron los datos de forma independiente. Se calcularon los odds ratios (OR) para los resultados dicotómicos y las diferencias de medias (DM) para los resultados continuos a partir de los datos de nueve ensayos. En las tablas de datos se describieron los resultados de los siete ensayos cruzados restantes con datos inadecuados para el agrupamiento, un ensayo con datos asimétricos y un ensayo con varianzas faltantes. Un ensayo no tuvo datos disponibles para el análisis.
Resultados principales
Como grupo, los AINE fueron más efectivos que placebo para reducir el SMA, pero menos efectivos que el ácido tranexámico, el danazol o el sistema intrauterino liberador de levonorgestrel (SIU LNG). El tratamiento con danazol produjo una duración más corta de la menstruación y más eventos adversos que los AINE, aunque este hecho no pareció afectar la aceptabilidad del tratamiento, según ensayos de 1980 a 1990. Sin embargo, en la actualidad el danazol no es un tratamiento habitual ni recomendado para el SMA. No hubo evidencia clara de diferencias entre los AINE y los otros tratamientos (progestágeno luteínico oral, etamsilato, un sistema intrauterino liberador de progesterona más antiguo y la píldora anticonceptiva oral [PAO]), aunque la mayoría de los estudios tuvieron escaso poder estadístico. No hubo evidencia de alguna diferencia entre los AINE individuales (naproxeno y ácido mefenámico) en la reducción de la menorragia. La calidad de la evidencia varió de baja a moderada y las limitaciones principales fueron el riesgo de sesgo y la imprecisión.
Conclusiones de los autores
Los AINE reducen la menorragia en comparación con placebo, aunque son menos efectivos que el ácido tranexámico, el danazol o el SIU LNG. Sin embargo, los eventos adversos son más graves con el tratamiento con danazol. En el número limitado de estudios pequeños adecuados para la evaluación, no hubo evidencia clara de una diferencia en la eficacia entre los AINE y otros tratamientos médicos como el progestágeno luteínico oral, el etamsilato, la PAO o el sistema intrauterino liberador de progesterona más antiguo.
PICOs
Resumen en términos sencillos
¿Los fármacos antiinflamatorios no esteroideos son seguros y efectivos para tratar el sangrado menstrual abundante?
Pregunta de la revisión
Los autores de Cochrane investigaron si los fármacos antiinflamatorios no esteroideos (AINE) ayudaron a reducir el sangrado menstrual abundante (SMA) en las mujeres antes de la menopausia.
Antecedentes
Los AINE reducen los niveles de prostaglandinas, que son elevados en mujeres con sangrado menstrual abundante. Se indicó que podrían ayudar con el sangrado abundante y podrían tener un efecto beneficioso sobre los períodos menstruales dolorosos.
Características de los estudios
Los autores buscaron en las bases de datos médicas e identificaron 19 ensayos controlados aleatorizados (ECA; estudios clínicos en los que las personas se asignan de forma aleatoria a uno de dos o más grupos de tratamiento) con 759 mujeres que se pudieron incluir en la revisión, aunque solo los datos de nueve ensayos fueron adecuados para el análisis.
Resultados clave
Las mujeres buscaron ayuda para el SMA cuando afectaba su calidad de vida. Los niveles de prostaglandina (una hormona natural) son más altos en las mujeres con SMA y son reducidos por los AINE. La revisión de los ensayos encontró que los AINE tuvieron una efectividad moderada para reducir el SMA, mientras que otros fármacos, como el danazol, el ácido tranexámico y el sistema intrauterino liberador de levonorgestrel (SIU LNG), son más efectivos. Estos resultados se basaron en un número pequeño de ensayos de calidad baja a moderada.
Calidad de la evidencia
La calidad de la evidencia varió de baja a moderada y las principales limitaciones fueron el informe deficiente de los métodos de estudio y la imprecisión debido al número reducido de estudios.
Authors' conclusions
Summary of findings
| NSAIDs versus placebo (control) | ||||||
| Patient or population: women with heavy menstrual bleeding | ||||||
| Outcomes | Illustrative comparative risks* (95% CI) | Relative effect | No of participants | Quality of the evidence | Comments | |
| Assumed risk | Corresponding risk | |||||
| Control | NSAIDs | |||||
| MBL (mL/cycle) | — | The mean MBL (mL/cycle) in the intervention groups was | — | 11 | ⊕⊕⊝⊝ | — |
| Proportion of women with no subjective improvement in MBL | Study population | OR 0.08 | 80 | ⊕⊕⊝⊝ | — | |
| 800 per 1000 | 242 per 1000 | |||||
| Moderate | ||||||
| 800 per 1000 | 242 per 1000 | |||||
| Quality of life | No study reported this outcome | |||||
| Number of days' bleeding | No study reported this outcome | |||||
| *The basis for the assumed risk (e.g. the median control group risk across studies) is provided in footnotes. The corresponding risk (and its 95% confidence interval) is based on the assumed risk in the comparison group and the relative effect of the intervention (and its 95% CI). CI: confidence interval; MBL: menstrual blood loss; NSAID: non‐steroidal anti‐inflammatory drug; OR: odds ratio. | ||||||
| GRADE Working Group grades of evidence | ||||||
| aDowngraded two levels for imprecision (very small trial). | ||||||
| NSAIDs versus tranexamic acid (control) | ||||||
| Patient or population: women with heavy menstrual bleeding | ||||||
| Outcomes | Illustrative comparative risks* (95% CI) | Relative effect | No of participants | Quality of the evidence | Comments | |
| Assumed risk | Corresponding risk | |||||
| Control | NSAIDs | |||||
| MBL (mL/cycle) | — | The mean MBL (mL/cycle) in the intervention groups was | — | 48 | ⊕⊕⊝⊝ | — |
| Proportion of women with no subjective improvement in MBL | Study population | OR 1.44 | 49 | ⊕⊕⊝⊝ | — | |
| 308 per 1000 | 390 per 1000 | |||||
| Moderate | ||||||
| 308 per 1000 | 391 per 1000 | |||||
| Number of days' bleeding | — | The mean duration of menstruation (days) in the intervention groups was | — | 49 | ⊕⊕⊝⊝ | — |
| Quality of life | No study reported this outcome | |||||
| *The basis for the assumed risk (e.g. the median control group risk across studies) is provided in footnotes. The corresponding risk (and its 95% confidence interval) is based on the assumed risk in the comparison group and the relative effect of the intervention (and its 95% CI). CI: confidence interval; MBL: menstrual blood loss; NSAID: non‐steroidal anti‐inflammatory drug; OR: odds ratio. | ||||||
| GRADE Working Group grades of evidence | ||||||
| aDowngraded one level for risk of bias (allocation concealment not stated). | ||||||
| NSAIDs versus ethamsylate (control) | ||||||
| Patient or population: women with heavy menstrual bleeding | ||||||
| Outcomes | Illustrative comparative risks* (95% CI) | Relative effect | No of participants | Quality of the evidence | Comments | |
| Assumed risk | Corresponding risk | |||||
| Control | NSAIDs | |||||
| MBL at Rx (mL/cycle) | — | The mean MBL at Rx (mL/cycle) in the intervention groups was | — | 82 | ⊕⊕⊕⊝ | — |
| Proportion of women with no subjective improvement in MBL | Study population | OR 0.7 | 50 | ⊕⊕⊝⊝ | ||
| 481 per 1000 | 394 per 1000 | |||||
| Moderate | ||||||
| 482 per 1000 | 394 per 1000 | |||||
| Number of days' bleeding | — | The mean duration of menstruation (days) in the intervention groups was | — | 46 | ⊕⊕⊝⊝ | — |
| Quality of life | No study reported this outcome | |||||
| *The basis for the assumed risk (e.g. the median control group risk across studies) is provided in footnotes. The corresponding risk (and its 95% confidence interval) is based on the assumed risk in the comparison group and the relative effect of the intervention (and its 95% CI). CI: confidence interval; MBL: menstrual blood loss; NSAID: non‐steroidal anti‐inflammatory drug; OR: odds ratio; Rx: treatment | ||||||
| GRADE Working Group grades of evidence | ||||||
| aDowngraded one level for risk of bias (allocation concealment not stated). | ||||||
| NSAIDs versus danazol (control) | ||||||
| Patient or population: women with heavy menstrual bleeding | ||||||
| Outcomes | Illustrative comparative risks* (95% CI) | Relative effect | No of participants | Quality of the evidence | Comments | |
| Assumed risk | Corresponding risk | |||||
| Control | NSAIDs | |||||
| MBL (mL/cycle) | — | The mean MBL (mL/cycle) in the intervention groups was | — | 79 | ⊕⊕⊕⊝ | — |
| Number of days' bleeding | — | The mean duration of menstruation (days) in the intervention groups was | — | 53 | ⊕⊕⊕⊝ | — |
| Quality of life | No study reported this outcome | |||||
| *The basis for the assumed risk (e.g. the median control group risk across studies) is provided in footnotes. The corresponding risk (and its 95% confidence interval) is based on the assumed risk in the comparison group and the relative effect of the intervention (and its 95% CI). CI: confidence interval; MBL: menstrual blood loss; NSAID: non‐steroidal anti‐inflammatory drug. | ||||||
| GRADE Working Group grades of evidence | ||||||
| aDowngraded one level for risk of bias (allocation concealment not stated). | ||||||
| NSAIDs vs oral progestogens (control) | ||||||
| Patient or population: women with heavy menstrual bleeding | ||||||
| Outcomes | Illustrative comparative risks* (95% CI) | Relative effect | No of participants | Quality of the evidence | Comments | |
| Assumed risk | Corresponding risk | |||||
| Control | NSAIDs vs oral progestogens | |||||
| MBL (mL/cycle) | — | The mean MBL (mL/cycle) in the intervention groups was | — | 48 | ⊕⊕⊝⊝ | — |
| Number of days' bleeding | — | The mean duration of bleeding (days) in the intervention groups was | — | 48 | ⊕⊕⊕⊝ | — |
| Quality of life | No study reported this outcome | |||||
| *The basis for the assumed risk (e.g. the median control group risk across studies) is provided in footnotes. The corresponding risk (and its 95% confidence interval) is based on the assumed risk in the comparison group and the relative effect of the intervention (and its 95% CI). CI: confidence interval; MBL: menstrual blood loss; NSAID: non‐steroidal anti‐inflammatory drug. | ||||||
| GRADE Working Group grades of evidence | ||||||
| aDowngraded one level for risk of bias (allocation concealment not reported). | ||||||
| NSAIDs versus progesterone‐releasing intrauterine system (control) | ||||||
| Patient or population: women with heavy menstrual bleeding | ||||||
| Outcomes | Illustrative comparative risks* (95% CI) | Relative effect | No of participants | Quality of the evidence | Comments | |
| Assumed risk | Corresponding risk | |||||
| Control | NSAIDs | |||||
| MBL (mL/cycle) | — | The mean MBL (mL/cycle) in the intervention groups was | — | 16 | ⊕⊕⊝⊝ | — |
| Number of days' bleeding | — | The mean duration of menstruation (days) in the intervention groups was | — | 16 | ⊕⊕⊝⊝ | — |
| Quality of life | No study reported this outcome | |||||
| *The basis for the assumed risk (e.g. the median control group risk across studies) is provided in footnotes. The corresponding risk (and its 95% confidence interval) is based on the assumed risk in the comparison group and the relative effect of the intervention (and its 95% CI). CI: confidence interval; MBL: menstrual blood loss; NSAID: non‐steroidal anti‐inflammatory drug. | ||||||
| GRADE Working Group grades of evidence | ||||||
| aDowngraded one level for risk of bias (randomisation method and allocation concealment not reported). | ||||||
| NSAIDs versus oral contraceptive pill (control) | ||||||
| Patient or population: women with heavy menstrual bleeding | ||||||
| Outcomes | Illustrative comparative risks* (95% CI) | Relative effect | No of participants | Quality of the evidence | Comments | |
| Assumed risk | Corresponding risk | |||||
| Control | NSAIDs | |||||
| MBL (mL/cycle) | — | The mean MBL (mL/cycle) in the intervention groups was | — | 26 | ⊕⊕⊝⊝ | — |
| Quality of life | No study reported this outcome | |||||
| Days of bleeding | No study reported this outcome | |||||
| *The basis for the assumed risk (e.g. the median control group risk across studies) is provided in footnotes. The corresponding risk (and its 95% confidence interval) is based on the assumed risk in the comparison group and the relative effect of the intervention (and its 95% CI). CI: confidence interval; MBL: menstrual blood loss; NSAID: non‐steroidal anti‐inflammatory drug. | ||||||
| GRADE Working Group grades of evidence | ||||||
| aDowngraded one level for risk of bias (randomisation method and allocation concealment not reported). | ||||||
| Mefenamic acid compared to naproxen for heavy menstrual bleeding | ||||||
| Patient or population: women with heavy menstrual bleeding | ||||||
| Outcomes | Illustrative comparative risks* (95% CI) | Relative effect | No of participants | Quality of the evidence | Comments | |
| Assumed risk | Corresponding risk | |||||
| Naproxen | Mefenamic acid | |||||
| MBL (mL/cycle) | — | The mean MBL (mL/cycle) in the intervention groups was | — | 61 | ⊕⊕⊝⊝ | — |
| Number of days' bleeding | — | The mean duration of menstruation (days) in the intervention groups was | — | 35 | ⊕⊕⊝⊝ | — |
| Quality of life | No study reported this outcome | |||||
| *The basis for the assumed risk (e.g. the median control group risk across studies) is provided in footnotes. The corresponding risk (and its 95% confidence interval) is based on the assumed risk in the comparison group and the relative effect of the intervention (and its 95% CI). CI: confidence interval; MBL: menstrual blood loss; NSAID: non‐steroidal anti‐inflammatory drug. | ||||||
| GRADE Working Group grades of evidence | ||||||
| aDowngraded one level for risk of bias (lack of blinding). | ||||||
Background
Description of the condition
Excessively heavy menstrual bleeding (menorrhagia or HMB) is an important cause of ill health in women and a very common gynaecological problem. It causes a major burden in quality of life (Frick 2009), and uses substantial healthcare resources (Liu 2007). In the UK one in 20 women between 30 and 49 years see their doctor each year for HMB (NICE 2018). According to a European study, 27% of women in reproductive age had experienced HMB symptoms within the previous 12 months (Fraser 2014).
HMB has often been objectively defined as 80 mL or more of menstrual blood loss (MBL) per period (Cole 1971; Hallberg 1966), which is unrelated to pregnancy or any known pelvic or systemic disease. However, this definition is mainly used in research and is difficult to quantify in clinical settings. Unacceptably problematic bleeding is most commonly determined by the woman herself if the amount or frequency of blood loss interferes with her physical or psychosocial well‐being. This personal perception is often what determines the need for treatment, and the assessment of outcomes afterwards. To clarify the situation, the International Federation of Gynaecology and Obstetrics (FIGO) formally defined HMB as "the woman's perspective of increased menstrual volume, regardless of regularity, frequency or duration" (Munro 2011).
Research studies have traditionally used the alkaline haematin method to measure HMB objectively (Hallberg 1966), but a simpler method that is often used is the pictorial blood loss assessment chart (PBAC) (Higham 1990). With this method, the woman assesses the blood loss on her used sanitary pads or tampons and assigns a numerical score. It has been suggested that total menstrual fluid loss (TMFL) may be used as an assessment of HMB (Reid 2005). Measurement is determined by the difference in weight of tampons or pads before and after use. TMFL correlates well with changes in objective MBL and may be of more relevance to women concerned mainly about heavy menstrual flow (flooding).
Surgery has traditionally had a dominant role in treating HMB, but 80% of women treated by surgery have no anatomical pathology and over a third of women undergoing hysterectomy for excessive blood loss have normal uteri (wombs) removed (Clarke 1995; Gath 1982). Thus, medical therapy, with the avoidance of possibly unnecessary surgery and a bonus of preserved fertility in women who have not completed their family, is an attractive alternative.
Description of the intervention
A wide variety of medications are used to reduce HMB. The currently available medical therapies include hormonal agents, anti‐fibrinolytic drugs and non‐steroidal anti‐inflammatory drugs (NSAIDs). These agents vary in their effectiveness, tolerability and acceptability to women. When selecting a medical treatment, patient preference and need for contraception are issues that need to be taken into account, together with the benefits and risks of each treatment. NSAIDs are considered useful for women not desiring contraception, especially women with dysmenorrhoea (Fraser 2008). Individual NSAIDs used for the treatment of HMB include mefenamic acid (MFA), naproxen, ibuprofen, flurbiprofen, meclofenamic acid, diclofenac, indomethacin and acetylsalicylic acid (aspirin).
How the intervention might work
A rationale for the use of NSAIDs is given by the accumulation of data suggesting a role for the prostaglandins in the pathogenesis of HMB (Hagenfeldt 1987; Lopez 1991). The endometria of women with excessive menstrual bleeding have higher levels of prostaglandin E2 and prostaglandin F2α when compared with women with normal menses (Willman 1976). There is further evidence of deranged haemostasis (abnormal clotting) as the ratio of prostaglandin E2 to F2α (Smith 1981), and the ratio of prostacyclin (prostaglandin I2) to thromboxane A2 (Makarainen 1986), are elevated. These substances are present both in the endometrium and myometrium, although the exact mechanism by which the excessive blood loss occurs remains speculative. NSAIDs reduce prostaglandin levels by inhibiting the cyclo‐oxygenase enzyme (Rees 1987; Smith 1981).
NSAIDs are contraindicated in women with HMB and an underlying bleeding disorder because of their inhibitory effect on platelet (cell fragment) aggregation (Kadir 2005).
Why it is important to do this review
NSAIDs reduces MBL by 25% to 35% or more in about three‐quarters of women with HMB (Roy 2004). NSAIDs also can have a beneficial effect on dysmenorrhoea, a symptom often related to HMB. Adverse effects of treatment, especially gastrointestinal effects, are variable in frequency but are not usually severe. It is important to distinguish this medical option for HMB from other options with respect to effectiveness, tolerability, acceptability and safety for women to make informed choices. In addition, it is usually assumed that there are no differences in effectiveness between individual NSAIDs, even though there are individual women who seem to respond well to one agent but less well to another. This review tested this assumption with the inclusion of individual NSAID comparisons for the treatment of HMB.
Objectives
To determine the effectiveness, safety and tolerability of NSAIDs in achieving a reduction in MBL in women of reproductive years with HMB.
Methods
Criteria for considering studies for this review
Types of studies
Randomised controlled comparisons of NSAID therapies or combined NSAID and other medical therapy with either placebo or other medical therapies when used to reduce HMB. Comparisons of one type of NSAID with another type of NSAID were also eligible for the review.
Types of participants
Inclusion criteria
-
Women of reproductive years.
-
Women with regular heavy periods measured either objectively (greater than 80 mL) for one or more cycles prior to the intervention or subjectively by the women (this criterion has been changed from two or more previous cycles to one or more previous cycles in the 2007 and 2012 updates).
-
Women recruited from primary care, family planning or specialist clinics.
Exclusion criteria
-
Postmenopausal bleeding (less than one year from the last period).
-
Irregular menses and intermenstrual bleeding.
-
Pathological causes of HMB.
-
Iatrogenic (treatment induced) causes of HMB.
Types of interventions
-
NSAIDs versus placebo or any other medical therapy (antifibrinolytic agents, hormone treatment, danazol, gonadotropin‐releasing hormone analogues).
-
Specific NSAIDs versus other NSAIDs (MFA, naproxen, ibuprofen, flurbiprofen, meclofenamic acid, diclofenac, acetylsalicylic acid).
-
NSAIDs combined with other medical treatment(s) versus other medical treatment(s) (this comparison was added in the 2012 update).
We considered variable doses and routes of administration of treatments.
Types of outcome measures
Each of the following outcomes were recorded where available.
Primary outcomes
-
MBL:
-
objective assessment of blood loss, by the alkaline haematin method (mL/cycle) (Newton 1977);
-
subjective assessment of blood loss by the pictorial chart method (score on PBAC chart) (Higham 1990), or patient perception (on questionnaire or survey instrument).
-
-
Quality of life: women's perceived change in quality of life where it was recorded in a reproducible and validated format. This included improvement in symptoms of dysmenorrhoea, headache, diarrhoea, depression and other menstrually related symptoms.
Secondary outcomes
-
Total menstrual fluid loss (TMFL: measured as difference between the original weight of the sanitary material and the returned sanitary material) (Fraser 1985; Fraser 2001).
-
Number of days' bleeding during the intervention menstrual cycle.
-
Patient adherence to treatment.
-
Patient acceptability of treatment.
-
Adverse events, of any degree, reported either spontaneously by the patient or elicited from specific questioning.
-
Resource use/cost.
Search methods for identification of studies
Electronic searches
The original search was performed in 1998, with updated searches undertaken in September/October 2001, April 2004, July 2007, July 2012 and April 2019. We searched the following electronic databases, trial registers and websites:
-
Cochrane Gynaecology and Fertility Specialised Register of Controlled Trials; PROCITE platform (searched 1 April 2019)
-
Cochrane Central Register of Studies Online (CENTRAL CRSO); web platform (searched 1 April 2019)
-
MEDLINE; OVID platform (searched from 1946 to 1 April 2019)
-
Embase; OVID platform (searched from 1980 to 1 April 2019)
-
PsycINFO; OVID platform (searched from 1806 to 1 April 2019)
-
trial registers for ongoing and registered trials: www.controlled‐trials.com, clinicaltrials.gov/ct/home, www.who.int/trialsearch/Default.aspx; web platform (searched 1 April 2019)
-
conference abstracts in the ISI Web of Knowledge: wokinfo.com/; web platform (searched 1 April 2019)
-
LILACS database: lilacs.bvsalud.org/en/; web platform (searched 1 April 2019)
-
clinical study results for clinical trial results of marketed pharmaceuticals: www.clinicalstudyresults.org/; web platform (searched 1 April 2019)
-
PubMed: www.ncbi.nlm.nih.gov/pubmed/; web platform (searched 1 April 2019)
-
OpenSIGLE database: opensigle.inist.fr; web platform (searched 1 April 2019)
-
GOOGLE and GOOGLE Scholar for grey literature, web platform (searched 1 April 2019).
Searching other resources
We also searched the reference lists of relevant publications and identified trials.
Data collection and analysis
Selection of studies
Two review authors (AL and MB) independently selected trials for inclusion in the review using the search strategy described previously. We used the prespecified inclusion criteria to consider titles and abstracts from the lists of potentially relevant studies. Where necessary, we obtained full‐text copies of the studies for the independent assessment. We planned to resolve differences in opinion over study selection by discussion and consensus, but this did not prove necessary.
Data extraction and management
We analysed included trials for the following quality criteria, methodological details and study characteristics.
Trial characteristics
-
Method of randomisation.
-
Presence or absence of blinding to treatment allocation.
-
Quality of allocation concealment.
-
Number of women randomised, excluded or lost to follow‐up.
-
Use of an intention‐to‐treat analysis.
-
Use of a power calculation.
-
Duration, timing and location of the study.
Characteristics of the study participants
-
Age and any other recorded characteristics of women in the study.
-
Methods used to define heavy MBL.
-
Other inclusion criteria.
-
Exclusion criteria.
Interventions used
-
Types of medical therapy used.
-
Dose, duration and timing of administration of medical therapy.
Outcomes
-
Methods used to measure MBL at or after intervention.
-
Methods used to evaluate patient satisfaction, symptoms and change in quality of life.
All three review authors independently extracted data using forms designed according to Cochrane guidelines. One of these review authors was a content expert and the other two had methodological expertise. Where necessary, we sought additional information on trial methodology or actual trial data from the principal author of any trials that appeared to meet the eligibility criteria. In cases where results were presented in graphs and no actual data were given, we extracted the data from the graphs.
Assessment of risk of bias in included studies
Two review authors (AL and either CA or SF) independently assessed the included studies for risk of bias using the Cochrane 'Risk of bias' assessment tool (Higgins 2011). Individual domains included random sequence generation, allocation concealment, blinding, incomplete outcome data and other bias; each domain was separately scored as low, unclear or high risk of bias.
We resolved disagreements over quality assessments by discussion with a third review author (KD).
Measures of treatment effect
For dichotomous data (e.g. proportion of women who found the treatment unacceptable), we expressed results for each study as an odds ratio (OR) with 95% confidence intervals (CI) and combined them for meta‐analysis with Review Manager 5 using the Peto OR (Review Manager 2014). For all dichotomous outcomes, a high value had negative consequences (e.g. the proportion of women who had no subjective improvement in MBL and proportion who had no improvement in quality of life). For ease of interpretation of the graphs, this meant that results to the left of the line favoured the experimental group (i.e. NSAIDs), and results to the right of the line favoured the control or other comparison group.
There were difficulties with the reporting of continuous outcomes (e.g. MBL after treatment). Meta‐analysis with Review Manager 5 software used a mean difference (MD) to combine outcomes and required data to be presented as absolute values of post‐treatment means with their standard deviations (SD) (or change values (either absolute or percentage) between baseline and final values together with the SD of the change). For many outcomes, particularly MBL, the data are skewed and authors correctly presented their data as medians with a range. Where possible, we obtained original data from the principal authors, but post‐treatment means and SDs were not always available or calculable. Where only medians and ranges were available and there was evidence that the data were approximately normally distributed, we regarded the median as being identical to the mean and calculated an estimate of the SD from the range (range multiplied by 0.95/4). We performed sensitivity analysis with and without these studies in the meta‐analysis to check the appropriateness of this assumption. Where there was strong evidence that the data were highly skewed and the sample size was small, we considered it inappropriate to regard the median as identical to the mean and did not combine the results of the relevant study in meta‐analysis but reported them separately in the 'Other data' section of this review. For all continuous outcomes, a high value had negative consequences and so results to the left of the line in the graphs favoured the experimental group (i.e. NSAIDs), and results to the right of the line favoured the control or other comparison group.
Unit of analysis issues
All analyses were per woman randomised.
Dealing with missing data
We analysed data, where possible, on an intention‐to‐treat basis. We attempted to obtain missing data from the authors of the included studies, where necessary, but were often unsuccessful. We did not impute missing values.
Assessment of heterogeneity
We considered whether the clinical and methodological characteristics of the included studies were sufficiently similar for meta‐analysis to provide a clinically meaningful summary. Where meta‐analysis was feasible, we examined heterogeneity between the results of different combined studies by inspecting the scatter in the data points and the overlap in their CIs. We then assessed any outliers identified by this method to determine whether the differences could be further explained. We used the results of the Chi2 tests for formal assessment of heterogeneity (with P < 0.10 being considered evidence of significant heterogeneity) and the I2 statistic for quantity (Higgins 2003).
Assessment of reporting biases
We undertook a comprehensive search to minimise the chance of publication bias in the review. We planned to use a funnel plot to explore the possibility of small‐study effects on the results, but there were insufficient studies for this to be meaningful.
Data synthesis
We undertook meta‐analysis where possible (participants, interventions, outcomes and duration of included studies sufficiently homogeneous, or where data were in an appropriate form for combination, or both). Where there was substantial heterogeneity indicated that could not be explained, we used a random‐effects model as a more appropriate method for estimating a mean treatment effect.
Several studies were cross‐over in design. In principle, cross‐over and parallel group designed RCTs estimate the same effect but there are practical difficulties, such as carryover from the first treatment period and differences in the standard errors, and so pooling the data from both types of trials was not appropriate. An option was to enter data from cross‐over trials at the end of the first treatment period so that the two comparison groups were in effect parallel groups. We attempted to locate the original data at the end of the first cross‐over trial period but for most of the cross‐over trials these were unavailable. The data from these trials were described in text form in the 'Other data' section of this review and not included in the meta‐analysis.
Subgroup analysis and investigation of heterogeneity
Differences between the action of individual NSAIDs are minimal but there is considerable variation in individual patient response and in the incidence and type of adverse events. We performed subgroup analyses comparing the efficacy and adverse events of individual NSAIDs with placebo and compared the results.
Sensitivity analysis
We planned sensitivity analysis to compare potential differences in participants, interventions, outcomes and whether allocation concealment was adequate in the included studies. However, only limited sensitivity analysis could be undertaken because of the small numbers of included studies for each outcome.
Overall quality of the body of evidence; 'Summary of findings' tables
We generated 'Summary of findings' tables using GRADEpro software (GRADEpro GDT) to evaluate the overall quality of the body of evidence for both the primary review outcomes: MBL and quality of life. Two review authors (AL, KD) independently judged on the overall quality of studies for each of these outcomes, according to the GRADE criteria (study limitations, i.e. risk of bias; consistency of effect; imprecision; indirectness and publication bias). For each GRADE criterion, if there were concerns about quality, the assessment could be downgraded by one or two levels. Overall quality for each outcome could be categorised as high, moderate, low or very low according to these assessments.
Results
Description of studies
Results of the search
The search identified 25 RCTs of medical treatment with NSAIDs for regular HMB. Nineteen RCTs met the criteria for inclusion in the review (see Characteristics of included studies table). See Figure 1 for details of the screening and selection process.

Study flow diagram.
Included studies
The studies included 759 women but not all the women could be included in each measured outcome as there were multiple comparison groups. One study that was previously awaiting classification was included on the 2019 update, but had no data available for comparisons (Jaisamrarn 2006). We contacted the authors but received no data. Thirteen studies were conducted in Europe. Six in the UK (Cameron 1987; Cameron 1990; Chamberlain 1991; Hall 1987; Muggeridge 1983; Reid 2005), two in Ireland (Bonnar 1996; Dockeray 1989), two in Finland (Makarainen 1986; Ylikorkala 1986), two in Sweden (Andersch 1988; Rybo 1981), and one in the Netherlands (van Eijkeren 1992). Two studies were conducted in India (Grover 1990; Najam 2010), two in Australia (Fraser 1981; Fraser 1991), one in Thailand (Jaisamrarn 2006), and one in Canada (Tsang 1987).
Trials included in the meta‐analysis
The data from nine trials with 419 women were included in meta‐analyses (Bonnar 1996; Cameron 1987; Cameron 1990; Chamberlain 1991; Dockeray 1989; Fraser 1991; Grover 1990; Hall 1987; van Eijkeren 1992). All comparisons were between MFA and placebo (two trials); another NSAID; naproxen (two trials) or other medical treatments: danazol, tranexamic acid, ethamsylate, oral contraceptive pill (OCP), norethisterone given during the luteal phase and the progesterone‐releasing intrauterine system (IUS).
Participants
The age of the participants in 18 of the included trials ranged from 18 to 55 years and all had sought medical assistance for HMB. One trial included women from 12 to 45 years, with 67% being over 30 years, but no further details were provided.Ten studies defined HMB objectively using the alkaline haematin method to satisfy the criteria for inclusion. Some of the studies also required the women to have regular ovulatory cycles. Common exclusion criteria were hormonal contraception, intrauterine device (IUD) use, fibroids and pelvic pathology.
Interventions
In general, the dosage regimen did not vary extensively for each type of NSAID. MFA was most commonly studied and the usual dosage was 500 mg three times a day from onset of menses for four or five days or until menstruation ceased. Two studies required administration of MFA four or five days prior to menses until its cessation (Reid 2005; van Eijkeren 1992), and one study used a slightly different dosage (500 mg initially, then 250 mg four times per day for three to five days) (Tsang 1987). Four studies used a similar regimen for naproxen: 500 mg at onset and three to five hours later, then 500 mg twice a day for five days (Ylikorkala 1986); 500 mg in the morning, 250 mg in the afternoon for days one to two, then 250 mg twice a day for up to seven days (Rybo 1981); 500 mg then 250 mg three to four times daily (Fraser 1991); 550 mg initially, then 275 mg four times daily for five days (Hall 1987). The trial that compared MBL in women treated with ibuprofen versus placebo used two different regimens of ibuprofen: 600 mg daily and 1200 mg daily.
Comparisons
The duration of medication with tranexamic acid and ethamsylate was during the five days of menstruation. Danazol administration was daily throughout the cycle. The studies gave oral progestogen as a luteal phase supplement although a longer regimen is widely accepted as having greater efficacy. The progesterone‐releasing IUS/levonorgestrel‐releasing IUS (LNG IUS) were inserted for the whole trial period and the OCP taken for three of the four weeks of the cycle. Duration of the intervention mostly ranged from two to three menstrual cycles, but for the van Eijkeren 1992 the treatment phase was only one month.
Outcomes
All trials but two, had MBL measured objectively by the alkaline haematin method as the main outcome; the remaining trials assessed the effect of treatment on MBL by the proportion of women experiencing "relief" of HMB (no details given by the author as to how this was measured) (Grover 1990), or PBAC scores (Najam 2010). One trial also measured TMFL and PBAC scores in addition to MBL measured by the alkaline haematin method. Five trials assessed the effects of treatment on number of days of menstrual bleeding, eight trials measured the incidence of adverse events, three trials measured the effects on dysmenorrhoea, two assessed treatment acceptability and women's perception of change in MBL, and one trial measured non‐adherence.
Trials used several methods to assess adverse events. Some studies recorded the numbers of women who experienced any adverse events. Other studies reported the numbers of women who experienced specific adverse events (e.g. headache, nausea, abdominal pain). One study attempted to combine specific adverse events in broad categories (e.g. gastrointestinal events and central nervous system events). The patient either mentioned adverse effects spontaneously or by responding to specific questioning such as "Do you think the treatment has upset you in any way?"
Data considered unsuitable for pooling in the meta‐analysis (cross‐over trials, trials with skewed data or no measure of variance)
The data from seven trials of cross‐over design with 99 women could not be pooled and included in the meta‐analysis but the individual results are described in data tables rather than forest plots (Andersch 1988; Fraser 1981; Makarainen 1986; Muggeridge 1983; Rybo 1981; Tsang 1987; Ylikorkala 1986). Three trials compared MBL in MFA and placebo groups, two trials compared MBL in naproxen and placebo groups, one trial compared MBL in ibuprofen and placebo groups (Analysis 1.4), and one trial compared MBL in flurbiprofen and tranexamic acid treatment groups (Analysis 2.6).
The data from Reid 2005 were highly skewed and the results from this study are also reported in data tables (Analysis 6.2).
The data from Najam 2010 did not include measures of the variance and the results of this study are also reported in data tables (Analysis 9.1).
Excluded studies
Two trials were excluded in previous versions of the review. One of these assessed reduction in bleeding in the treatment and placebo groups according to the number of sanitary pads used compared to the baseline use of sanitary wear in the categories of no change, one to three less, four to six less and seven to nine less) (Martinez Alcala 1979). There is sometimes a weak positive correlation between the number of pads and tampons used and the amount of MBL, but this is often dependent on the personal hygiene of the woman and varies even between a woman's two menstruations of almost the same volume (Chimbira 1980; Fraser 1984). The other excluded trial compared meclofenamate sodium with placebo (Vargyas 1987). It included seven women (21%) with fitted IUDs, which is an exclusion criterion for this review.
In the 2019 version, we excluded three trials. Two because the women were randomised to "medical treatment" including NSAIDs. Gupta 2013 randomised women to the progesterone‐releasing IUS or to other medical treatment including NSAIDs, but they were free to choose the medical treatment. Famuyide 2017 randomised women to endometrial ablation or medical treatment, and they were also free to choose between combined OCP or NSAIDs. We excluded one trial because the comparison was MFA versus MFA plus herbal medicine (Naafe 2018).
Risk of bias in included studies
Risk of bias assessments are presented for the individual studies in the Characteristics of included studies table and summaries are presented in figures (Figure 2; Figure 3).
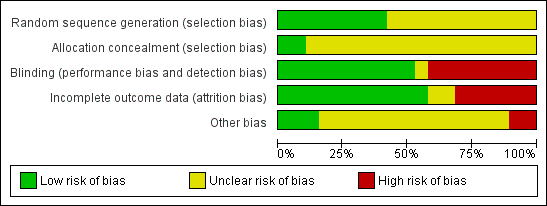
Risk of bias graph: review authors' judgements about each risk of bias item presented as percentages across all included studies.

Risk of bias summary: review authors' judgements about each risk of bias item for each included study.
Allocation
Sequence generation and allocation concealment
Eight studies described an adequate randomisation method and were at low risk of bias for this domain; the remaining 11 studies did not report how this was performed and were classified at unclear risk of bias. Only two of the 19 trials were at low risk of bias for allocation concealment (van Eijkeren 1992; Reid 2005). However, van Eijkeren 1992 had a very small sample size, had a high proportion of withdrawals and duration of treatment was for only one month. The remaining trials were at unclear risk of bias as they did not provide evidence of sufficient safeguards in place to conceal the allocation.
Blinding
Ten of 19 studies used double blinding (low risk of bias) and one trial used single blinding (unclear who was blinded; unclear risk); the remaining studies did not report whether blinding was undertaken and this was considered unlikely (high risk of bias).
Incomplete outcome data
Nine of 19 trials did not report whether there was any loss to follow‐up or exclusions or withdrawals post randomisation. The remaining 10 trials had loss to follow‐up ranging from 16% to 29% (three trials) or exclusions or withdrawals after randomisation ranging from 3% to 42% (seven trials) (low risk of bias). Two of these trials with exclusions or withdrawals had intention‐to‐treat analysis and were considered at low risk of bias.
Other potential sources of bias
Two trials reported results separately for subgroups. One trial gave results for four women with primary menorrhagia out of the total 14 who were randomised (Rybo 1981). Another study included a heterogeneous group of women with many different diagnoses: ovulatory and anovulatory menorrhagia, fibroids, IUD, tubal sterilisation, von Willebrand's disease and OCP (Fraser 1981). Reduction in blood loss was reported separately for the women with ovulatory menorrhagia but a significant proportion of this group did not have excessive bleeding, as defined by the alkaline haematin method. This subgroup of women did not report other outcomes.
Two trials provided confusing outcome data and were at high risk of this bias. Fourteen trials provided insufficient information and were considered at unclear risk of this bias. Three trials reported similar data at baseline and were at low risk of this bias.
Effects of interventions
See: Summary of findings for the main comparison NSAIDs versus placebo (control); Summary of findings 2 NSAIDs versus tranexamic acid (control); Summary of findings 3 NSAIDs versus ethamsylate (control); Summary of findings 4 NSAIDs versus danazol (control); Summary of findings 5 NSAIDs versus oral progestogens (control); Summary of findings 6 NSAIDs versus progesterone‐releasing intrauterine system (control); Summary of findings 7 NSAIDs versus oral contraceptive pill (control); Summary of findings 8 Mefenamic acid compared to naproxen for heavy menstrual bleeding
1 NSAIDs versus placebo
summary of findings Table for the main comparison provides a summary of the main findings for the comparison of NSAIDs versus placebo.
1.1 Menstrual blood loss (objective, subjective or both)
Eight trials measured MBL in different ways. One small trial with 11 women found clear evidence of difference in mean MBL favouring the MFA group compared to the placebo group (MBL in the MFA group was 124 mL less than in the placebo group; MD –124 mL/cycle, 95% CI –186 to –62; Analysis 1.1). There were no other trials with data suitable for pooling but six cross‐over trials reported a total effect at the end of the study (three trials compared MFA with placebo, two trials compared naproxen with placebo and one trial compared different dosages (600 mg and 1200 mg daily) of ibuprofen with placebo). In five of the seven post‐treatment comparisons, there was clear evidence of difference in the post‐treatment mean MBL favouring NSAIDs. However, there was no clear evidence of difference between low‐dose ibuprofen versus placebo (Makarainen 1986), or MFA versus placebo (Muggeridge 1983).
There was clear evidence of a difference in women's perception of "relief" of HMB between MFA and placebo groups (OR 0.08, 95% CI 0.03 to 0.18; Analysis 1.2; Grover 1990). The authors provided no additional information regarding the measurement of relief of HMB. In one of the cross‐over trials not included in the meta‐analysis (Ylikorkala 1986), 79% of women indicated that naproxen was "better" compared to 21% who indicated that the placebo treatment was "better" at reducing their HMB.
1.2 Adverse events
In the small van Eijkeren and colleagues study, total incidence of adverse events was comparable between MFA and placebo (Analysis 1.3; van Eijkeren 1992). Of the cross‐over trials identified above, there was no change in dysmenorrhoea scores between MFA and placebo (Muggeridge 1983), and no differences in the total incidence of adverse events between naproxen versus placebo and ibuprofen versus placebo (Analysis 1.4; Makarainen 1986; Ylikorkala 1986).
1.3 Other outcomes
We identified no trials for the meta‐analysis to assess quality of life, TMFL, number of days of bleeding, patient adherence to treatment, patient acceptability of treatment or resource use/cost.
2 NSAIDs versus tranexamic acid
summary of findings Table 2 provides a summary of the main findings for the comparison of NSAIDS versus tranexamic acid.
2.1 Menstrual blood loss (objective, subjective or both)
In the one study available for analysis with 48 women, the MD was 73 mL/cycle (95% CI 22 to 124) in the comparison of MFA and tranexamic acid (MBL in the tranexamic acid group was 73 mL less than in the MFA group; Analysis 2.1; Bonnar 1996). In the same study, there was no clear evidence of difference between the groups in the women's perception of change in their MBL (Analysis 2.2; Bonnar 1996). In one cross‐over trial, where data were not suitable for pooling, mean MBL was significantly less in the tranexamic acid cycles (155 mL) than in the flurbiprofen cycles (223 mL) (P < 0.01; Andersch 1988).
2.2 Number of days' bleeding
In the one study available for analysis, there was no clear evidence of a difference between treatment groups (Peto OR 1.44, 95% CI 0.45 to 4.61; 49 women; 1 study; Analysis 2.3).
2.3 Quality of life
There was no clear evidence of differences between groups for change in quality of life (Peto OR 1.13, 95% CI 0.27 to 4.73; 49 women; 1 study; Analysis 2.4) and treatment acceptability (Peto OR 1.17, 95% CI 0.32 to 4.27; 49 women; 1 study; Analysis 2.5), although these results were based on only one study. Another study reported outcomes in a form that was not suitable for analysis (Analysis 2.6).
2.4 Other outcomes
We identified no trials for the meta‐analysis to assess TMFL, patient adherence to treatment, patient acceptability of treatment or resource use/cost.
3 NSAIDs versus ethamsylate
summary of findings Table 3 provides a summary of the main findings for the comparison of NSAIDs versus ethamsylate.
Two studies contributed to this comparison (Bonnar 1996; Chamberlain 1991).
3.1 Menstrual blood loss (objective, subjective or both)
There was no evidence of a difference in MBL measured objectively both immediately after treatment in two studies (MD –42.88 mL/cycle, 95% CI –86.25 to 0.50; 82 women; I2 = 0%; Analysis 3.1), or at longer follow‐up at six months in one study (MD –70.30 mL/cycle, 95% CI –158.88 to 18.28; 31 women; Analysis 3.2). Women were unable to perceive a difference in their blood loss in one study (Peto OR 0.70, 95% CI 0.23 to 2.12; 50 women; Analysis 3.3).
3.2 Quality of life
In the one study available for analysis, there was no clear evidence of a difference between treatment groups for quality of life (Peto OR 0.83, 95% CI 0.18 to 3.72; 50 women; Analysis 3.4).
3.3 Number of days' bleeding
There was no clear evidence of a difference in number of treatment days of menstrual bleeding between treatment groups in one study (MD –0.40 days, 95% CI –1.56 to 0.76; 46 women; Analysis 3.5).
3.4 Patient acceptability of treatment
A greater proportion of women found ethamsylate unacceptable compared to NSAIDs (Peto OR 0.20, 95% CI 0.07 to 0.61; 50 women; Analysis 3.6).
3.5 Other outcomes
We identified no trials for the meta‐analysis to assess TMFL, patient adherence to treatment, patient acceptability of treatment or resource use/cost.
4 NSAIDs versus danazol
summary of findings Table 4 provides a summary of the main findings for the comparison of NSAIDs versus danazol.
4.1 Menstrual blood loss (objective)
Reduction of HMB was significantly greater in the danazol group (MD 45.06 mL/cycle, 95% CI 18.73 to 71.39; 79 women; 3 studies; I2 = 29%; Analysis 4.1). No trials assessed women's perception of MBL after treatment.
4.2 Quality of life
There was no clear evidence of a difference between groups for quality of life (Peto OR 1.19, 95% CI 0.20 to 7.05; 28 women; 1 study; Analysis 4.2).
4.3 Number of days' bleeding
There was clear evidence of a difference in the number of days of menstrual bleeding between danazol and the MFA groups favouring danazol (MD 1.03 days, 95% CI 0.26 to 1.80; 53 women; 2 studies; I2 = 0%; Analysis 4.3).
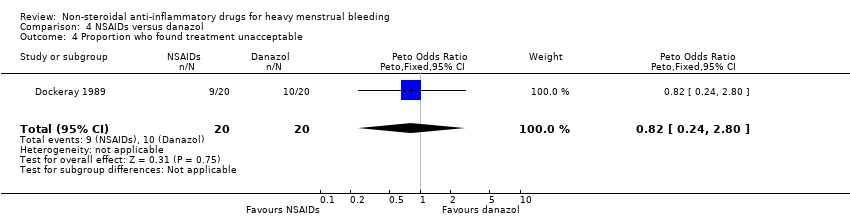
4.4 Patient acceptability of treatment
There was no clear evidence of a difference between groups for treatment acceptability, although these results were based on one study with 40 women (Peto OR 0.82, 95% CI 0.24 to 2.80; Analysis 4.4)
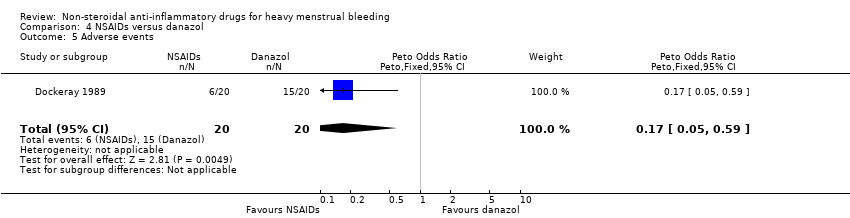
4.5 Adverse events
In this same study, the risk of adverse events was less in the MFA group (Peto OR 0.17, 95% CI 0.05 to 0.59; 40 women; Analysis 4.5).
4.6 Other outcomes
We identified no trials for the meta‐analysis to assess TMFL, patient adherence to treatment or resource use/cost.
5 NSAIDs versus oral progestogen (luteal phase)
summary of findings Table 5 provides a summary of the main findings for the comparison of NSAIDs versus oral progestogen.
5.1 Menstrual blood loss (objective, subjective or both)
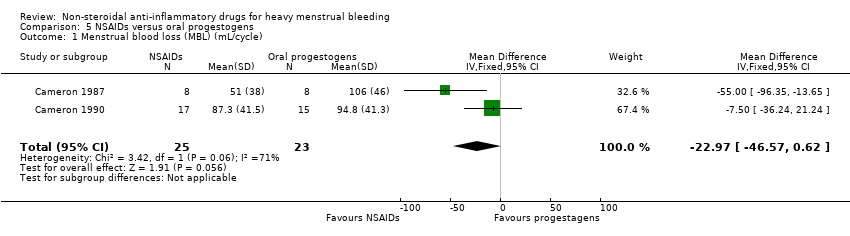
Two studies assessed MBL and duration of bleeding.
NSAIDs may have improved MBL compared to oral progestogens (MD –22.97 mL/cycle, 95% CI –46.57 to 0.62; 48 women; 2 studies; I2 = 71%; Analysis 5.1). The high heterogeneity could be explained by different inclusion criteria (age and bleeding level at baseline) in the two included studies.
5.2 Number of days' bleeding
There was no clear evidence of a difference in duration of bleeding (MD –0.41, 95% CI –0.95 to 0.13; 48 women; 2 studies; I2 = 35%; Analysis 5.2).
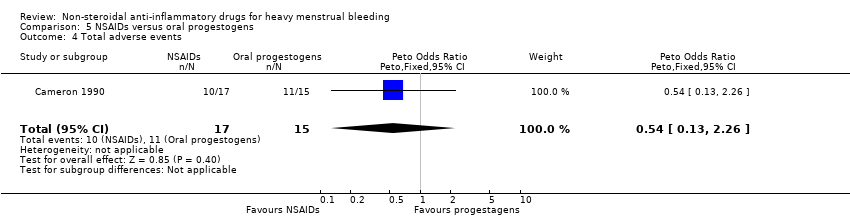
5.3 Adverse events
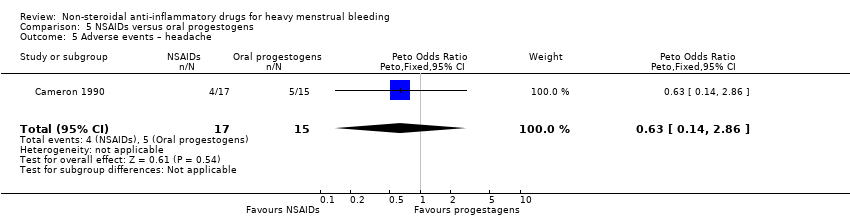
There was no clear evidence of a difference for non‐adherence (Peto OR 0.88, 95% CI 0.05 to 14.78; 32 women; 1 study; Analysis 5.3), total adverse events (Peto OR 0.54, 95% CI 0.13 to 2.26; 32 women; 1 study; Analysis 5.4), headache (Peto OR 0.63, 95% CI 0.14 to 2.86; 32 women; 1 study; Analysis 5.5), abdominal pain (Peto OR 0.86, 95% CI 0.15 to 4.96; 32 women; 1 study; Analysis 5.6), and nausea (Peto OR 1.79, 95% CI 0.17 to 18.65; 32 women; 1 study; Analysis 5.7). One study had no data available for comparisons (Jaisamrarn 2006).
5.4 Other outcomes
We identified no trials for the meta‐analysis to assess TMFL, patient adherence to treatment, patient acceptability of treatment or resource use/cost.
6 NSAIDs versus progesterone‐releasing intrauterine system
summary of findings Table 6 provides a summary of the main findings for the comparison of NSAIDs versus progesterone‐releasing IUS.
6.1 Menstrual blood loss (objective, subjective or both)
There was no clear evidence of a difference in reduction of HMB between groups (MD –4.00 mL/cycle, 95% CI –31.23 to 23.23; 16 women; 1 study; Analysis 6.1). Another larger trial that compared MFA with the LNG IUS reported highly significant differences between groups in MBL and PBAC scores (P < 0.001 for both outcomes; no summary effect measures calculated; Analysis 6.2).
6.2 Total menstrual fluid loss
One trial that compared MFA with the LNG IUS reported highly significant differences between groups in TMFL (P < 0.001; no summary effect measures calculated; Analysis 6.2).
6.3 Number of days' bleeding
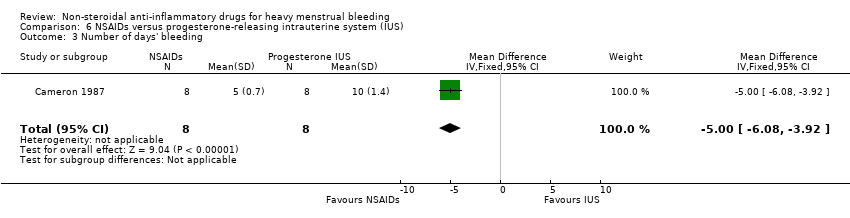
There was clear evidence of a difference in the number of days of menstrual bleeding favouring NSAIDs compared to the progesterone‐releasing IUS (withdrawn from the market since 2001) (MD –5.00 days, 95% CI –6.08 to –3.92; 16 women; 1 study; Analysis 6.3).
6.4 Adverse events
There was no clear evidence of a difference for adverse events other than abdominal pain which may have been lower (Peto OR 0.22, 95% CI 0.06 to 0.87; 51 women; 1 study; Analysis 6.4).
6.5 Other outcomes
We identified no trials for the meta‐analysis to assess quality of life, patient adherence to treatment, patient acceptability of treatment or resource use/cost.
7 NSAIDs versus oral contraceptive pill
summary of findings Table 7 provides a summary of the main findings for the comparison of NSAIDs versus OCP.
7.1 Menstrual blood loss (objective, subjective or both)
In the one study with data suitable for analysis, there was no clear evidence of a difference in the objective measurement of MBL between groups (MD 25.25 mL/cycle, 95% CI –22.34 to 72.84; 26 women; 1 study; Analysis 7.1).
7.2 Other outcomes
We identified no trials for the meta‐analysis to assess quality of life, TMFL, number of days' bleeding, patient adherence to treatment, patient acceptability of treatment, adverse events or resource use/cost.
8 Mefenamic acid versus naproxen
summary of findings Table 8 provides a summary of the main findings for the comparison of MFA versus naproxen.
8.1 Menstrual blood loss (objective, subjective or both)
There was no clear evidence of a difference between groups in the objective measurement of MBL (MD 21.00 mL/cycle, 95% CI –5.85 to 47.85; 61 women; 2 studies; I2 = 25%; Analysis 8.1).
8.2 Number of days' bleeding
There was no clear evidence of a difference between groups in duration of bleeding (MD –0.40 days, 95% CI –1.59 to 0.79; 35 women; 1 study; Analysis 8.2).
8.3 Adverse events
There was no clear evidence of difference in the total incidence of adverse events between groups (Peto OR 0.12, 95% CI 0.01 to 2.00; 35 women; 1 study; Analysis 8.3).
There was clear evidence of a difference in the risk of gastrointestinal effects favouring the MFA group compared with the naproxen group (Peto OR 0.24, 95% CI 0.06 to 0.87; 35 women; 1 study; Analysis 8.4).
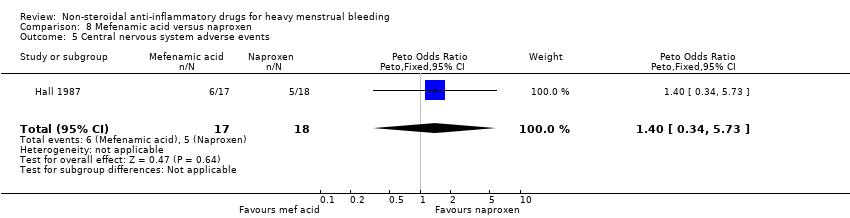
There was no clear evidence of a difference in central nervous system adverse events between groups (Peto OR 1.40, 95% CI 0.34 to 5.73; 35 women; 1 study; Analysis 8.5).
8.4 Other outcomes
We identified no trials for the meta‐analysis to assess quality of life, TMFL, number of days' bleeding, patient adherence to treatment, patient acceptability of treatment or resource use/cost.
9 Tranexamic acid plus mefenamic acid versus tranexamic acid
9.1 Menstrual blood loss (objective, subjective or both)
There was clear evidence of a reduction in MBL from baseline in the combined tranexamic acid plus MFA group in one study with 55 women (PBAC score at baseline 246 versus PBAC score at 6 months' follow‐up 100; P < 0.01). There was no clear evidence of a difference in MBL from baseline in the tranexamic acid alone group (PBAC score at baseline 250 versus PBAC score at 6 months' follow‐up 125; P > 0.05; Analysis 9.1).
9.2 Other outcomes
We identified no trials for the meta‐analysis to assess quality of life, TMFL, number of days' bleeding, patient adherence to treatment, patient acceptability of treatment, adverse events or resource use/cost.
Discussion
Summary of main results
NSAIDs versus placebo
Evidence from the one trial in the meta‐analysis and five of the six cross‐over studies confirms that NSAIDs are more effective than placebo in reducing MBL. However, the quality of the only study in the meta‐analysis was not high; 42% of randomised patients dropped out and the analysis was not intention to treat. A highly significant difference between NSAIDs and placebo in reduction of MBL was also perceived by the patients in one study that recorded the proportion of patients who were relieved of their HMB as the primary outcome.
NSAIDs versus other medical treatments
In the comparisons of NSAIDs as a group with other medical treatments, both tranexamic acid and danazol were more effective than any of the NSAIDs in reducing MBL. One cross‐over trial confirmed results from the only study in the meta‐analysis assessing the effect NSAIDs versus tranexamic acid on MBL (Andersch 1988). There was clear evidence of a difference in the reduction of blood loss in the meta‐analysis of NSAIDs versus danazol in two included studies; the third study had non‐comparable groups at baseline with a significantly higher (almost double) pretreatment MBL in the danazol group and the results must be regarded with caution (Cameron 1987).
There was no clear evidence of a difference in reduction of MBL in the comparisons of NSAIDs with ethamsylate, oral progestogen given during the luteal phase, the progesterone‐releasing IUS and the OCP.
The study comparing the progesterone‐releasing IUS was very small and results may have been affected by the lack of baseline comparability between groups. The progesterone‐releasing IUS was withdrawn from the market in 2001. A newer progesterone‐releasing IUS delivering 20 μg of levonorgestrel daily was developed primarily as a contraceptive and reduced both MBL and TMFL more effectively in one study (Reid 2005). There is evidence that blood contributes only a third of the TMFL in normal women (Fraser 1985; Fraser 2001). Thus, it could be argued that women may seek medical advice for excess total fluid loss (i.e. blood and fluid) rather than blood loss per se. The study found high correlations between MBL and TMFL and the authors suggested that TMFL may be a more useful estimate of MBL because it is easier to measure. It remains to be demonstrated in future trials if women are more concerned about the volume rather than the composition of unacceptable menstrual loss.
In the comparisons of NSAIDs with other medical treatment, the number of days of menstrual bleeding was shorter with danazol treatment and longer with the progesterone‐releasing IUS, although this latter result was based on only one small trial. This outcome was not compared with OCP treatment.
Abdominal pain was more likely with LNG IUS than MFA in the short term (up to six months) but this adverse effect usually resolved over time (Stewart 2001). Incidence of total adverse events was more likely under danazol treatment. Although acceptability of treatment did not differ between danazol and MFA therapy (50% with danazol versus 47% with MFA refused to continue), the reasons given were not similar. About 80% of this group of danazol‐treated women refused to continue because of adverse effects, but 100% of the MFA group unwilling to continue were unhappy about the lack of efficacy of their treatment. A greater proportion of women in the ethamsylate group compared to women in the NSAID group (MFA) found their treatment unacceptable.
Comparison of individual NSAIDs
The clinical differences between individual NSAID preparations have not been previously explored thoroughly in randomised studies. Two studies in this review compared MFA with naproxen and found no differences in post‐treatment MBL or incidence of adverse events, although women treated with MFA were less likely to have gastrointestinal effects. However, this latter finding is based on only one small trial.
Although data comparing different types of NSAIDs were limited, there was no suggestion of differential efficacy, so, in line with the widely accepted assumption that NSAIDs have similar clinical efficacy, studies comparing different NSAIDs with placebo or other treatments were combined.
Tranexamic acid plus NSAIDs versus tranexamic acid alone
The authors of one trial reported that six months of combined treatment with tranexamic acid plus NSAIDs significantly reduced PBAC scores from baseline, but not treatment with tranexamic acid alone. However the data were in a form that could not be entered into analysis.
Overall comparisons
Despite the limited data, it appears that NSAIDs are more effective than placebo but less effective than tranexamic acid, danazol or the LNG IUS in reducing HMB. However, adverse events are more frequent under danazol therapy than NSAID therapy. No trials were identified with data on cost or resource use of NSAID treatments.
Overall completeness and applicability of evidence
Assessment of MBL is difficult because of cycle‐to‐cycle variation in women (Haynes 1977). Haynes and coworkers found that cycle‐to‐cycle variation was greater in women with HMB (39 mL to 271 mL) than in women with normal menses. Consequently, we included trials in this review only if MBL (measured objectively) was greater than 80 mL/cycle for two or more cycles prior to the intervention, although we also included trials where women had a subjective complaint of HMB. The alkaline haematin extraction method is the most commonly used objective method for assessment of blood loss and is used as the standard but a woman's own perception of her MBL is also important in the evaluation of effectiveness of treatment on MBL and as such is also a valid assessment tool. However, many women who seek medical help for HMB will have normal blood loss (Fraser 1984; Haynes 1977; Warner 2004a; Warner 2004b), and results from one RCT have suggested that there is little response to therapy in women with MBL less than 35 mL (Fraser 1981). Since a proportion of the study participants with a complaint of HMB had normal MBL, it is likely that some reported differences between treatment and placebo groups have been underestimated.
The studies included in this review examined effects over two or three menstrual cycles of treatment and one study with unpublished data assessed effects one month after treatment was withdrawn. There was no evidence from randomised trials of effects over a longer period but one observational study examined the effects of MFA in 34 women over a 16‐month period and reported persistent reductions of 25% to 35% in MBL and improvement in quality of life (Fraser 1983).
Moreover, different regimens for some of the medical therapies were not considered in the included trials. A longer duration of oral progestogen treatment (from days five to 26 of the menstrual cycle), and longer duration of treatment over a number of cycles with all medical therapies are necessary to assess the comparisons considered in this review adequately.
Quality of the evidence
Although 19 trials met the criteria for inclusion, the inadequacies in some of the studies must be highlighted. The trials were all small and underpowered and for many outcomes the results were based on only one trial. Reduction of MBL in two of the nine trials that were included in the meta‐analysis was correctly reported as a median and range in the publications since the distribution of data was positively skewed with one or more extremely high values (Cameron 1987; Hall 1987). Substitution of the mean for the median and the estimation of the SD for these studies has enabled their inclusion in the meta‐analysis but sensitivity analysis with and without the inclusion of Cameron 1987 has not altered results. Hall 1987 was the only trial comparing MBL after treatment with two NSAIDs, MFA and naproxen. The Mann‐Whitney U test reported in the publication of the trial agreed with the results of the meta‐analysis finding no clear evidence of a difference between the groups.
Two of the included trials had non‐comparable groups at baseline (Cameron 1987; Chamberlain 1991), but sensitivity analysis indicated that their inclusion in the meta‐analysis did not substantially alter the results.
Two trials assessed carryover effects (Fraser 1981; Hall 1987). Fraser 1981 was a cross‐over trial of MFA and placebo, and found that the MBL during placebo cycles was greater (but not significantly) in the group that received MFA first. Of considerable interest was the finding that blood loss in the MFA cycles was significantly less when placebo was taken first (P < 0.01), so that MFA appeared to have a greater beneficial effect when taken after placebo. There was evidence of a small carryover effect but this did not reach statistical significance. Hall 1987 also tested for carryover effects but found none (P = 0.96). It is generally believed that MBL returns to baseline levels very quickly after medical treatment is withdrawn and so the results from the cross‐over trials were unlikely to be affected by carryover effects.
Potential biases in the review process
A comprehensive search for relevant studies minimised the chance of publication bias, but this could not be ruled out. There were too few studies for an analysis of funnel plots to be meaningful. We used appropriate methods to select studies, extract data and make quality assessments, thus minimising the chance of review author error and bias.
Agreements and disagreements with other studies or reviews
The search identified no systematic reviews of NSAIDs. However, evidence‐based guidance from the UK National Institute for Health and Care Excellence (NICE) suggests that NSAIDs, together with tranexamic acid and OCPs, are a recommended second‐line treatment option for women with HMB in whom either hormonal or non‐hormonal treatments are acceptable. For women in whom hormonal treatment is not acceptable, NSAIDs are a first‐line option alongside tranexamic acid (NICE 2007).
Risk of bias graph: review authors' judgements about each risk of bias item presented as percentages across all included studies.
Risk of bias summary: review authors' judgements about each risk of bias item for each included study.
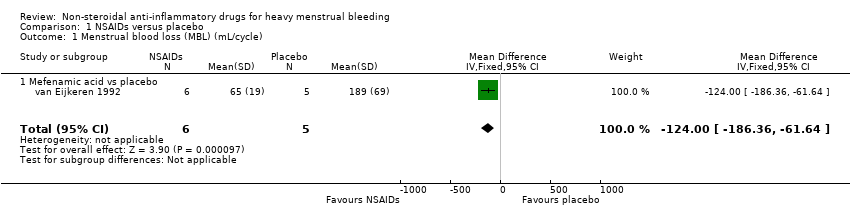
Comparison 1 NSAIDs versus placebo, Outcome 1 Menstrual blood loss (MBL) (mL/cycle).

Comparison 1 NSAIDs versus placebo, Outcome 2 Proportion with no subjective improvement in MBL.

Comparison 1 NSAIDs versus placebo, Outcome 3 Adverse events.
| Study | |
| Mefenamic acid vs placebo | |
| Fraser 1981 | Mean menstrual blood loss (standard deviation (SD)) on placebo: 70.7 (24.9) mL |
| Muggeridge 1983 | Mean menstrual blood loss (SD) on placebo: 161 (78.5) mL Mean score of dysmenorrhoea symptoms (SD) in 2nd placebo cycle: 2.1 (2.1) |
| Tsang 1987 | Mean menstrual blood loss (SD) on placebo: 156.5 (105.9) |
| Naproxen vs placebo | |
| Rybo 1981 | Mean menstrual blood loss (standard deviation (SD)) on placebo: 144 (26) mL |
| Ylikorkala 1986 | Mean menstrual blood loss (SD) on placebo: 150.7 (34) mL Proportion of women with adverse effects on placebo: 7% |
| Ibuprofen vs placebo | |
| Makarainen 1986 | Median menstrual blood loss (range) on placebo: 146 (71–374) mL |
Comparison 1 NSAIDs versus placebo, Outcome 4 MBL and other outcomes (descriptive results).

Comparison 2 NSAIDs versus tranexamic acid, Outcome 1 Menstrual blood loss (MBL) (mL/cycle).

Comparison 2 NSAIDs versus tranexamic acid, Outcome 2 Proportion with no subjective improvement in MBL.

Comparison 2 NSAIDs versus tranexamic acid, Outcome 3 Number of days' bleeding.

Comparison 2 NSAIDs versus tranexamic acid, Outcome 4 Proportion with no improvement in quality of life or dysmenorrhoea (or both).
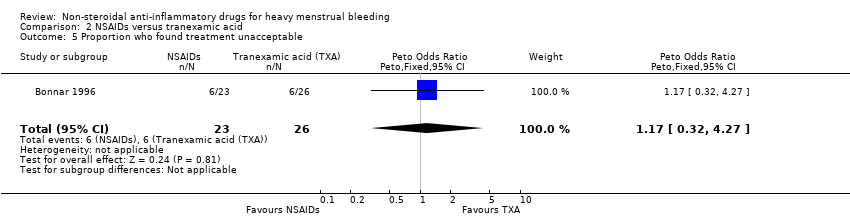
Comparison 2 NSAIDs versus tranexamic acid, Outcome 5 Proportion who found treatment unacceptable.
| Study | |
| Andersch 1988 | Mean menstrual blood loss (standard deviation (SD)) on tranexamic acid: 154.8 (127.8) mL Proportion of women with adverse effects on tranexamic acid: 47% |
Comparison 2 NSAIDs versus tranexamic acid, Outcome 6 MBL and other outcomes (descriptive results).

Comparison 3 NSAIDs versus ethamsylate, Outcome 1 Menstrual blood loss after treatment (mL/cycle).

Comparison 3 NSAIDs versus ethamsylate, Outcome 2 Menstrual blood loss 1–6 months after treatment (mL/cycle).

Comparison 3 NSAIDs versus ethamsylate, Outcome 3 Proportion with no subjective improvement in MBL.

Comparison 3 NSAIDs versus ethamsylate, Outcome 4 Proportion with no improvement in quality of life or dysmenorrhoea (or both).

Comparison 3 NSAIDs versus ethamsylate, Outcome 5 Number of days' bleeding.
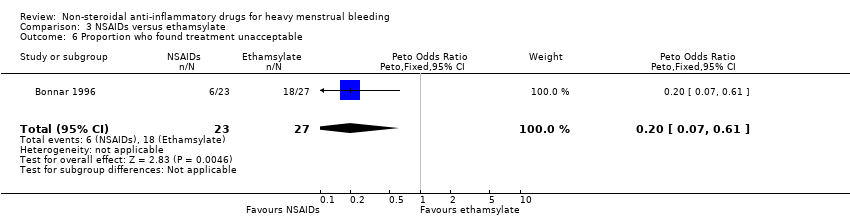
Comparison 3 NSAIDs versus ethamsylate, Outcome 6 Proportion who found treatment unacceptable.

Comparison 4 NSAIDs versus danazol, Outcome 1 Menstrual blood loss (MBL) (mL/cycle).

Comparison 4 NSAIDs versus danazol, Outcome 2 Proportion with no improvement in quality of life or dysmenorrhoea (or both).

Comparison 4 NSAIDs versus danazol, Outcome 3 Number of days' bleeding.
Comparison 4 NSAIDs versus danazol, Outcome 4 Proportion who found treatment unacceptable.
Comparison 4 NSAIDs versus danazol, Outcome 5 Adverse events.
Comparison 5 NSAIDs versus oral progestogens, Outcome 1 Menstrual blood loss (MBL) (mL/cycle).

Comparison 5 NSAIDs versus oral progestogens, Outcome 2 Number of days' bleeding.

Comparison 5 NSAIDs versus oral progestogens, Outcome 3 Proportion with non‐adherence.
Comparison 5 NSAIDs versus oral progestogens, Outcome 4 Total adverse events.
Comparison 5 NSAIDs versus oral progestogens, Outcome 5 Adverse events – headache.

Comparison 5 NSAIDs versus oral progestogens, Outcome 6 Adverse events – abdominal pain.

Comparison 5 NSAIDs versus oral progestogens, Outcome 7 Adverse events – nausea.

Comparison 6 NSAIDs versus progesterone‐releasing intrauterine system (IUS), Outcome 1 Menstrual blood loss (MBL) (mL/cycle).
| Study | Outcomes | Results (NSAIDs) | Results (LNG IUS) | Significance test | Comment |
| Reid 2005 | Menstrual blood loss (alkaline haematin method): | 3 months: | 3 months: | Wilcoxon rank sum test: | — |
Comparison 6 NSAIDs versus progesterone‐releasing intrauterine system (IUS), Outcome 2 MBL and other outcomes (descriptive results).
Comparison 6 NSAIDs versus progesterone‐releasing intrauterine system (IUS), Outcome 3 Number of days' bleeding.

Comparison 6 NSAIDs versus progesterone‐releasing intrauterine system (IUS), Outcome 4 Adverse events.

Comparison 7 NSAIDs versus oral contraceptive pill (OCP), Outcome 1 Menstrual blood loss (mL/cycle).

Comparison 8 Mefenamic acid versus naproxen, Outcome 1 Menstrual blood loss (mL/cycle).

Comparison 8 Mefenamic acid versus naproxen, Outcome 2 Number of days' bleeding.

Comparison 8 Mefenamic acid versus naproxen, Outcome 3 Total adverse events.

Comparison 8 Mefenamic acid versus naproxen, Outcome 4 Gastrointestinal adverse events.
Comparison 8 Mefenamic acid versus naproxen, Outcome 5 Central nervous system adverse events.
| Study | Group | n | Baseline mean PBAC score | Baseline standard deviation (SD) | PBAC score at 6 months | SD at 6 months | Test |
| Najam 2010 | Tranexamic acid + mefenamic acid | 55 | 246 points | Not reported | 100 points | Not reported | Significant change from baseline, P < 0.01 |
| Najam 2010 | Tranexamic acid | 55 | 250 points | Not reported | 125 points | Not reported | Not significant change from baseline, P > 0.05 |
Comparison 9 Tranexamic acid and mefenamic acid versus tranexamic acid, Outcome 1 Pictorial blood loss assessment chart (PBAC) score at 6 months' follow‐up.
| NSAIDs versus placebo (control) | ||||||
| Patient or population: women with heavy menstrual bleeding | ||||||
| Outcomes | Illustrative comparative risks* (95% CI) | Relative effect | No of participants | Quality of the evidence | Comments | |
| Assumed risk | Corresponding risk | |||||
| Control | NSAIDs | |||||
| MBL (mL/cycle) | — | The mean MBL (mL/cycle) in the intervention groups was | — | 11 | ⊕⊕⊝⊝ | — |
| Proportion of women with no subjective improvement in MBL | Study population | OR 0.08 | 80 | ⊕⊕⊝⊝ | — | |
| 800 per 1000 | 242 per 1000 | |||||
| Moderate | ||||||
| 800 per 1000 | 242 per 1000 | |||||
| Quality of life | No study reported this outcome | |||||
| Number of days' bleeding | No study reported this outcome | |||||
| *The basis for the assumed risk (e.g. the median control group risk across studies) is provided in footnotes. The corresponding risk (and its 95% confidence interval) is based on the assumed risk in the comparison group and the relative effect of the intervention (and its 95% CI). CI: confidence interval; MBL: menstrual blood loss; NSAID: non‐steroidal anti‐inflammatory drug; OR: odds ratio. | ||||||
| GRADE Working Group grades of evidence | ||||||
| aDowngraded two levels for imprecision (very small trial). | ||||||
| NSAIDs versus tranexamic acid (control) | ||||||
| Patient or population: women with heavy menstrual bleeding | ||||||
| Outcomes | Illustrative comparative risks* (95% CI) | Relative effect | No of participants | Quality of the evidence | Comments | |
| Assumed risk | Corresponding risk | |||||
| Control | NSAIDs | |||||
| MBL (mL/cycle) | — | The mean MBL (mL/cycle) in the intervention groups was | — | 48 | ⊕⊕⊝⊝ | — |
| Proportion of women with no subjective improvement in MBL | Study population | OR 1.44 | 49 | ⊕⊕⊝⊝ | — | |
| 308 per 1000 | 390 per 1000 | |||||
| Moderate | ||||||
| 308 per 1000 | 391 per 1000 | |||||
| Number of days' bleeding | — | The mean duration of menstruation (days) in the intervention groups was | — | 49 | ⊕⊕⊝⊝ | — |
| Quality of life | No study reported this outcome | |||||
| *The basis for the assumed risk (e.g. the median control group risk across studies) is provided in footnotes. The corresponding risk (and its 95% confidence interval) is based on the assumed risk in the comparison group and the relative effect of the intervention (and its 95% CI). CI: confidence interval; MBL: menstrual blood loss; NSAID: non‐steroidal anti‐inflammatory drug; OR: odds ratio. | ||||||
| GRADE Working Group grades of evidence | ||||||
| aDowngraded one level for risk of bias (allocation concealment not stated). | ||||||
| NSAIDs versus ethamsylate (control) | ||||||
| Patient or population: women with heavy menstrual bleeding | ||||||
| Outcomes | Illustrative comparative risks* (95% CI) | Relative effect | No of participants | Quality of the evidence | Comments | |
| Assumed risk | Corresponding risk | |||||
| Control | NSAIDs | |||||
| MBL at Rx (mL/cycle) | — | The mean MBL at Rx (mL/cycle) in the intervention groups was | — | 82 | ⊕⊕⊕⊝ | — |
| Proportion of women with no subjective improvement in MBL | Study population | OR 0.7 | 50 | ⊕⊕⊝⊝ | ||
| 481 per 1000 | 394 per 1000 | |||||
| Moderate | ||||||
| 482 per 1000 | 394 per 1000 | |||||
| Number of days' bleeding | — | The mean duration of menstruation (days) in the intervention groups was | — | 46 | ⊕⊕⊝⊝ | — |
| Quality of life | No study reported this outcome | |||||
| *The basis for the assumed risk (e.g. the median control group risk across studies) is provided in footnotes. The corresponding risk (and its 95% confidence interval) is based on the assumed risk in the comparison group and the relative effect of the intervention (and its 95% CI). CI: confidence interval; MBL: menstrual blood loss; NSAID: non‐steroidal anti‐inflammatory drug; OR: odds ratio; Rx: treatment | ||||||
| GRADE Working Group grades of evidence | ||||||
| aDowngraded one level for risk of bias (allocation concealment not stated). | ||||||
| NSAIDs versus danazol (control) | ||||||
| Patient or population: women with heavy menstrual bleeding | ||||||
| Outcomes | Illustrative comparative risks* (95% CI) | Relative effect | No of participants | Quality of the evidence | Comments | |
| Assumed risk | Corresponding risk | |||||
| Control | NSAIDs | |||||
| MBL (mL/cycle) | — | The mean MBL (mL/cycle) in the intervention groups was | — | 79 | ⊕⊕⊕⊝ | — |
| Number of days' bleeding | — | The mean duration of menstruation (days) in the intervention groups was | — | 53 | ⊕⊕⊕⊝ | — |
| Quality of life | No study reported this outcome | |||||
| *The basis for the assumed risk (e.g. the median control group risk across studies) is provided in footnotes. The corresponding risk (and its 95% confidence interval) is based on the assumed risk in the comparison group and the relative effect of the intervention (and its 95% CI). CI: confidence interval; MBL: menstrual blood loss; NSAID: non‐steroidal anti‐inflammatory drug. | ||||||
| GRADE Working Group grades of evidence | ||||||
| aDowngraded one level for risk of bias (allocation concealment not stated). | ||||||
| NSAIDs vs oral progestogens (control) | ||||||
| Patient or population: women with heavy menstrual bleeding | ||||||
| Outcomes | Illustrative comparative risks* (95% CI) | Relative effect | No of participants | Quality of the evidence | Comments | |
| Assumed risk | Corresponding risk | |||||
| Control | NSAIDs vs oral progestogens | |||||
| MBL (mL/cycle) | — | The mean MBL (mL/cycle) in the intervention groups was | — | 48 | ⊕⊕⊝⊝ | — |
| Number of days' bleeding | — | The mean duration of bleeding (days) in the intervention groups was | — | 48 | ⊕⊕⊕⊝ | — |
| Quality of life | No study reported this outcome | |||||
| *The basis for the assumed risk (e.g. the median control group risk across studies) is provided in footnotes. The corresponding risk (and its 95% confidence interval) is based on the assumed risk in the comparison group and the relative effect of the intervention (and its 95% CI). CI: confidence interval; MBL: menstrual blood loss; NSAID: non‐steroidal anti‐inflammatory drug. | ||||||
| GRADE Working Group grades of evidence | ||||||
| aDowngraded one level for risk of bias (allocation concealment not reported). | ||||||
| NSAIDs versus progesterone‐releasing intrauterine system (control) | ||||||
| Patient or population: women with heavy menstrual bleeding | ||||||
| Outcomes | Illustrative comparative risks* (95% CI) | Relative effect | No of participants | Quality of the evidence | Comments | |
| Assumed risk | Corresponding risk | |||||
| Control | NSAIDs | |||||
| MBL (mL/cycle) | — | The mean MBL (mL/cycle) in the intervention groups was | — | 16 | ⊕⊕⊝⊝ | — |
| Number of days' bleeding | — | The mean duration of menstruation (days) in the intervention groups was | — | 16 | ⊕⊕⊝⊝ | — |
| Quality of life | No study reported this outcome | |||||
| *The basis for the assumed risk (e.g. the median control group risk across studies) is provided in footnotes. The corresponding risk (and its 95% confidence interval) is based on the assumed risk in the comparison group and the relative effect of the intervention (and its 95% CI). CI: confidence interval; MBL: menstrual blood loss; NSAID: non‐steroidal anti‐inflammatory drug. | ||||||
| GRADE Working Group grades of evidence | ||||||
| aDowngraded one level for risk of bias (randomisation method and allocation concealment not reported). | ||||||
| NSAIDs versus oral contraceptive pill (control) | ||||||
| Patient or population: women with heavy menstrual bleeding | ||||||
| Outcomes | Illustrative comparative risks* (95% CI) | Relative effect | No of participants | Quality of the evidence | Comments | |
| Assumed risk | Corresponding risk | |||||
| Control | NSAIDs | |||||
| MBL (mL/cycle) | — | The mean MBL (mL/cycle) in the intervention groups was | — | 26 | ⊕⊕⊝⊝ | — |
| Quality of life | No study reported this outcome | |||||
| Days of bleeding | No study reported this outcome | |||||
| *The basis for the assumed risk (e.g. the median control group risk across studies) is provided in footnotes. The corresponding risk (and its 95% confidence interval) is based on the assumed risk in the comparison group and the relative effect of the intervention (and its 95% CI). CI: confidence interval; MBL: menstrual blood loss; NSAID: non‐steroidal anti‐inflammatory drug. | ||||||
| GRADE Working Group grades of evidence | ||||||
| aDowngraded one level for risk of bias (randomisation method and allocation concealment not reported). | ||||||
| Mefenamic acid compared to naproxen for heavy menstrual bleeding | ||||||
| Patient or population: women with heavy menstrual bleeding | ||||||
| Outcomes | Illustrative comparative risks* (95% CI) | Relative effect | No of participants | Quality of the evidence | Comments | |
| Assumed risk | Corresponding risk | |||||
| Naproxen | Mefenamic acid | |||||
| MBL (mL/cycle) | — | The mean MBL (mL/cycle) in the intervention groups was | — | 61 | ⊕⊕⊝⊝ | — |
| Number of days' bleeding | — | The mean duration of menstruation (days) in the intervention groups was | — | 35 | ⊕⊕⊝⊝ | — |
| Quality of life | No study reported this outcome | |||||
| *The basis for the assumed risk (e.g. the median control group risk across studies) is provided in footnotes. The corresponding risk (and its 95% confidence interval) is based on the assumed risk in the comparison group and the relative effect of the intervention (and its 95% CI). CI: confidence interval; MBL: menstrual blood loss; NSAID: non‐steroidal anti‐inflammatory drug. | ||||||
| GRADE Working Group grades of evidence | ||||||
| aDowngraded one level for risk of bias (lack of blinding). | ||||||
| Outcome or subgroup title | No. of studies | No. of participants | Statistical method | Effect size |
| 1 Menstrual blood loss (MBL) (mL/cycle) Show forest plot | 1 | 11 | Mean Difference (IV, Fixed, 95% CI) | ‐124.0 [‐186.36, ‐61.64] |
| 1.1 Mefenamic acid vs placebo | 1 | 11 | Mean Difference (IV, Fixed, 95% CI) | ‐124.0 [‐186.36, ‐61.64] |
| 2 Proportion with no subjective improvement in MBL Show forest plot | 1 | 80 | Peto Odds Ratio (Peto, Fixed, 95% CI) | 0.08 [0.03, 0.18] |
| 2.1 Mefenamic acid vs placebo | 1 | 80 | Peto Odds Ratio (Peto, Fixed, 95% CI) | 0.08 [0.03, 0.18] |
| 3 Adverse events Show forest plot | 1 | 11 | Peto Odds Ratio (Peto, Fixed, 95% CI) | 0.77 [0.07, 8.09] |
| 3.1 Mefenamic acid vs placebo | 1 | 11 | Peto Odds Ratio (Peto, Fixed, 95% CI) | 0.77 [0.07, 8.09] |
| 4 MBL and other outcomes (descriptive results) Show forest plot | Other data | No numeric data | ||
| 4.1 Mefenamic acid vs placebo | Other data | No numeric data | ||
| 4.2 Naproxen vs placebo | Other data | No numeric data | ||
| 4.3 Ibuprofen vs placebo | Other data | No numeric data | ||
| Outcome or subgroup title | No. of studies | No. of participants | Statistical method | Effect size |
| 1 Menstrual blood loss (MBL) (mL/cycle) Show forest plot | 1 | 48 | Mean Difference (IV, Fixed, 95% CI) | 73.0 [21.66, 124.34] |
| 2 Proportion with no subjective improvement in MBL Show forest plot | 1 | 49 | Peto Odds Ratio (Peto, Fixed, 95% CI) | 1.44 [0.45, 4.61] |
| 3 Number of days' bleeding Show forest plot | 1 | 49 | Mean Difference (IV, Fixed, 95% CI) | 0.40 [‐0.47, 1.27] |
| 4 Proportion with no improvement in quality of life or dysmenorrhoea (or both) Show forest plot | 1 | 49 | Peto Odds Ratio (Peto, Fixed, 95% CI) | 1.13 [0.27, 4.73] |
| 5 Proportion who found treatment unacceptable Show forest plot | 1 | 49 | Peto Odds Ratio (Peto, Fixed, 95% CI) | 1.17 [0.32, 4.27] |
| 6 MBL and other outcomes (descriptive results) Show forest plot | Other data | No numeric data | ||
| Outcome or subgroup title | No. of studies | No. of participants | Statistical method | Effect size |
| 1 Menstrual blood loss after treatment (mL/cycle) Show forest plot | 2 | 82 | Mean Difference (IV, Fixed, 95% CI) | ‐42.88 [‐86.25, 0.50] |
| 2 Menstrual blood loss 1–6 months after treatment (mL/cycle) Show forest plot | 1 | 31 | Mean Difference (IV, Fixed, 95% CI) | ‐70.3 [‐158.88, 18.28] |
| 3 Proportion with no subjective improvement in MBL Show forest plot | 1 | 50 | Peto Odds Ratio (Peto, Fixed, 95% CI) | 0.70 [0.23, 2.12] |
| 4 Proportion with no improvement in quality of life or dysmenorrhoea (or both) Show forest plot | 1 | 50 | Peto Odds Ratio (Peto, Fixed, 95% CI) | 0.83 [0.18, 3.72] |
| 5 Number of days' bleeding Show forest plot | 1 | 46 | Mean Difference (IV, Fixed, 95% CI) | ‐0.40 [‐1.56, 0.76] |
| 6 Proportion who found treatment unacceptable Show forest plot | 1 | 50 | Peto Odds Ratio (Peto, Fixed, 95% CI) | 0.20 [0.07, 0.61] |
| Outcome or subgroup title | No. of studies | No. of participants | Statistical method | Effect size |
| 1 Menstrual blood loss (MBL) (mL/cycle) Show forest plot | 3 | 79 | Mean Difference (IV, Fixed, 95% CI) | 45.06 [18.73, 71.39] |
| 2 Proportion with no improvement in quality of life or dysmenorrhoea (or both) Show forest plot | 1 | 28 | Peto Odds Ratio (Peto, Fixed, 95% CI) | 1.19 [0.20, 7.05] |
| 3 Number of days' bleeding Show forest plot | 2 | 53 | Mean Difference (IV, Fixed, 95% CI) | 1.03 [0.26, 1.80] |
| 4 Proportion who found treatment unacceptable Show forest plot | 1 | 40 | Peto Odds Ratio (Peto, Fixed, 95% CI) | 0.82 [0.24, 2.80] |
| 5 Adverse events Show forest plot | 1 | 40 | Peto Odds Ratio (Peto, Fixed, 95% CI) | 0.17 [0.05, 0.59] |
| Outcome or subgroup title | No. of studies | No. of participants | Statistical method | Effect size |
| 1 Menstrual blood loss (MBL) (mL/cycle) Show forest plot | 2 | 48 | Mean Difference (IV, Fixed, 95% CI) | ‐22.97 [‐46.57, 0.62] |
| 2 Number of days' bleeding Show forest plot | 2 | 48 | Mean Difference (IV, Fixed, 95% CI) | ‐0.41 [‐0.95, 0.13] |
| 3 Proportion with non‐adherence Show forest plot | 1 | 32 | Peto Odds Ratio (Peto, Fixed, 95% CI) | 0.88 [0.05, 14.78] |
| 4 Total adverse events Show forest plot | 1 | 32 | Peto Odds Ratio (Peto, Fixed, 95% CI) | 0.54 [0.13, 2.26] |
| 5 Adverse events – headache Show forest plot | 1 | 32 | Peto Odds Ratio (Peto, Fixed, 95% CI) | 0.63 [0.14, 2.86] |
| 6 Adverse events – abdominal pain Show forest plot | 1 | 32 | Peto Odds Ratio (Peto, Fixed, 95% CI) | 0.86 [0.15, 4.96] |
| 7 Adverse events – nausea Show forest plot | 1 | 32 | Peto Odds Ratio (Peto, Fixed, 95% CI) | 1.79 [0.17, 18.65] |
| Outcome or subgroup title | No. of studies | No. of participants | Statistical method | Effect size |
| 1 Menstrual blood loss (MBL) (mL/cycle) Show forest plot | 1 | 16 | Mean Difference (IV, Fixed, 95% CI) | ‐4.0 [‐31.23, 23.23] |
| 2 MBL and other outcomes (descriptive results) Show forest plot | Other data | No numeric data | ||
| 3 Number of days' bleeding Show forest plot | 1 | 16 | Mean Difference (IV, Fixed, 95% CI) | ‐5.0 [‐6.08, ‐3.92] |
| 4 Adverse events Show forest plot | 1 | Peto Odds Ratio (Peto, Fixed, 95% CI) | Subtotals only | |
| 4.1 Headache | 1 | 51 | Peto Odds Ratio (Peto, Fixed, 95% CI) | 0.94 [0.31, 2.86] |
| 4.2 Abdominal pain | 1 | 51 | Peto Odds Ratio (Peto, Fixed, 95% CI) | 0.22 [0.06, 0.87] |
| 4.3 Ovarian cyst | 1 | 51 | Peto Odds Ratio (Peto, Fixed, 95% CI) | 0.43 [0.10, 1.80] |
| 4.4 Breast pain | 1 | 51 | Peto Odds Ratio (Peto, Fixed, 95% CI) | 0.30 [0.07, 1.33] |
| 4.5 Nausea | 1 | 51 | Peto Odds Ratio (Peto, Fixed, 95% CI) | 2.01 [0.37, 10.86] |
| 4.6 Diarrhoea | 1 | 51 | Peto Odds Ratio (Peto, Fixed, 95% CI) | 3.53 [0.57, 21.98] |
| 4.7 Upper respiratory infection | 1 | 51 | Peto Odds Ratio (Peto, Fixed, 95% CI) | 0.95 [0.24, 3.75] |
| Outcome or subgroup title | No. of studies | No. of participants | Statistical method | Effect size |
| 1 Menstrual blood loss (mL/cycle) Show forest plot | 1 | 26 | Mean Difference (IV, Fixed, 95% CI) | 25.25 [‐22.34, 72.84] |
| Outcome or subgroup title | No. of studies | No. of participants | Statistical method | Effect size |
| 1 Menstrual blood loss (mL/cycle) Show forest plot | 2 | 61 | Mean Difference (IV, Fixed, 95% CI) | 21.00 [‐5.85, 47.85] |
| 2 Number of days' bleeding Show forest plot | 1 | 35 | Mean Difference (IV, Fixed, 95% CI) | ‐0.40 [‐1.59, 0.79] |
| 3 Total adverse events Show forest plot | 1 | 35 | Peto Odds Ratio (Peto, Fixed, 95% CI) | 0.12 [0.01, 2.00] |
| 4 Gastrointestinal adverse events Show forest plot | 1 | 35 | Peto Odds Ratio (Peto, Fixed, 95% CI) | 0.24 [0.06, 0.87] |
| 5 Central nervous system adverse events Show forest plot | 1 | 35 | Peto Odds Ratio (Peto, Fixed, 95% CI) | 1.40 [0.34, 5.73] |
| Outcome or subgroup title | No. of studies | No. of participants | Statistical method | Effect size |
| 1 Pictorial blood loss assessment chart (PBAC) score at 6 months' follow‐up Show forest plot | Other data | No numeric data | ||