Tratamiento para la deglución para la disfagia en el accidente cerebrovascular agudo y subagudo
Information
- DOI:
- https://doi.org/10.1002/14651858.CD000323.pub3Copy DOI

- Database:
-
- Cochrane Database of Systematic Reviews
- Version published:
-
- 30 October 2018see what's new
- Type:
-
- Intervention
- Stage:
-
- Review
- Cochrane Editorial Group:
-
Cochrane Stroke Group
- Copyright:
-
- Copyright © 2018 The Cochrane Collaboration. Published by John Wiley & Sons, Ltd.
Article metrics
Altmetric:
Cited by:
Authors
Contributions of authors
Philip Bath: conceived and designed the review, undertook searches, analysed and interpreted data, wrote the original review, and updated the review in 2007 (interim update), 2012, and 2018.
Han Sean Lee: undertook searches, extracted data, analysed and interpreted data, and updated the review in 2018.
Lisa Everton: undertook searches and data extraction, analysed and interpreted data, and updated the review in 2018.
Sources of support
Internal sources
-
King's College Hospital Audit Committee, UK.
-
Division of Stroke, University of Nottingham, UK.
External sources
-
South Thames NHS Executive, UK.
-
Trent NHS Executive, UK.
-
Wolfson Foundation, UK.
-
The Stroke Association, UK.
-
Royal College of Physicians, UK.
-
Dunhill Medical Trust, UK.
-
National Institutes of Health Research Stroke Research Network, UK.
Support for recruitment of patients into UK‐based trials
-
National Institutes of Health Research ‐ Cochrane Incentive Scheme, UK.
Declarations of interest
PB was chief investigator of two included trials (Bath 1997, academic; STEPS 2016, commercial ‐ funded by Phagenesis Ltd); he consults for this company and receives honoraria and expenses for this work; he did not contribute to decisions on PES studies including deciding which trials should be included and extracting outcome data. No pharmaceutical or device companies, or other commercial entities, were involved in data analysis, data interpretation, writing of this review, or comments on it.
SL: none known.
LE: none known.
Acknowledgements
We thank the following people who were review authors in previous versions of this review.
-
Version 1 (1999): Jean Kerr, Morwenna Collins, Cameron Sellars, and David Smithard; they variously contributed to searches, data extraction, analysis and interpretation of data, and updating of the review.
-
Version 2 (2012): Jessica Beavan, Sharon Ellendar, and Chamilla Geeganage; they variously undertook searches, data extraction, and analysis and interpretation of data, and updated the review.
We thank the Cochrane Stroke Group for assistance in identifying trials and conducting searches, and their editors and external assessor for comments on the review. Several trialists and other interested healthcare staff reviewed the draft of the first version and made comments ‐ we thank each of them: CGMI Baeten (Netherlands), MS Dennis (UK), BR Garon (USA), GJ Hankey (Australia), GKT Holmes (UK), PR Mills (UK), B Norton (UK), C Ormiston (USA), J Rosenbek (USA), and G Vanhooren (Belgium). We also thank D Luo and G Lan, who translated five of the papers from Chinese into English. Finally, we are grateful to the funding bodies that supported this research. Naturally any mistakes are our own. We would be very grateful to be informed of any completed or ongoing trials that are not listed in the review, and to know of outcome data from existing trials that have not been included.
Version history
| Published | Title | Stage | Authors | Version |
| 2018 Oct 30 | Swallowing therapy for dysphagia in acute and subacute stroke | Review | Philip M Bath, Han Sean Lee, Lisa F Everton | |
| 2012 Oct 17 | Interventions for dysphagia and nutritional support in acute and subacute stroke | Review | Chamila Geeganage, Jessica Beavan, Sharon Ellender, Philip MW Bath | |
| 1999 Oct 25 | Interventions for dysphagia in acute stroke | Review | Philip MW Bath, Fiona J Bath‐Hextall, David Smithard | |
Differences between protocol and review
Separation of dysphagia treatment from nutritional support
For this version of the review, we removed all trials related to nutritional support and feeding to allow focus on swallowing therapy for post‐stroke dysphagia.
Modification of analysis method
We changed the analysis method from fixed‐effect to random‐effects models (odds ratio (OR), mean difference (MD)) because we noted the presence of significant trial and statistical heterogeneity. Two studies included more than one interventional group (Yuan 2003; Carnaby 2006), producing different treatment intensities. In these cases, we divided the low‐intensity (middle) groups and entered data from the study as two data sets (e.g. data set 1: medium (M), low (L), or none; and data set 2: high (H) or medium (M)). Similarly, in the case of repetitive transcranial magnetic stimulation, when a trial compared high‐ versus low‐frequency stimulation or unilateral versus bilateral stimulation (Kim 2012i; Kim 2012ii; Du 2016i; Du 2016ii; Park 2016a (i); Park 2016a (ii)), we divided control group participants equally between treatment groups to prevent counting control participants more than once, thereby artificially narrowing the confidence intervals (CIs).
We combined different interventions, collectively referred to as 'swallowing therapy', for the purposes of analysing their effects on main outcomes to evaluate whether any intervention is better than no intervention, and to try to establish where the most positive effects are seen, and where more research is needed.
Modification of type of stroke patients
We excluded trials in which a majority of participants did not present with stroke, along with trials for which enrolment occurred after six months.
Addition or modification of outcome measures
Modification of search strategies: we have revised and updated the search strategies used for this review to account for newly identified relevant terms keywords and indexing terms. We have included both versions of each search strategy in the review appendices.
We divided swallowing therapy into subcategories: acupuncture, drug therapy, NMES, PES, physical stimulation (thermal, tactile), tDCS, and TMS.
We added additional outcome measures, especially focusing on intermediate outcomes: chest infection or pneumonia rates and penetration aspiration scores. We retained outcomes related to improvement of dysphagia as listed with proportion of participants with dysphagia at end of trial. However, we also included changes in some measurements on videofluoroscopy (pharyngeal transit time) and changes in swallowing ability as determined by change in swallow scores. We included discharge destination within the outcome 'institutionalisation': the number of participants discharged to long‐term care.
Keywords
MeSH
Medical Subject Headings (MeSH) Keywords
- *Stroke Rehabilitation;
- Acupuncture Therapy [statistics & numerical data];
- Acute Disease;
- Deglutition;
- Deglutition Disorders [*etiology, mortality, *rehabilitation];
- Electric Stimulation Therapy [statistics & numerical data];
- Gastrostomy;
- Intubation, Gastrointestinal;
- Length of Stay [statistics & numerical data];
- Lisinopril [therapeutic use];
- Metoclopramide [therapeutic use];
- Nifedipine [therapeutic use];
- Physical Stimulation [methods];
- Pneumonia [epidemiology];
- Randomized Controlled Trials as Topic;
- Stroke [*complications, mortality];
- Time Factors;
- Transcranial Direct Current Stimulation [statistics & numerical data];
Medical Subject Headings Check Words
Humans;
PICOs
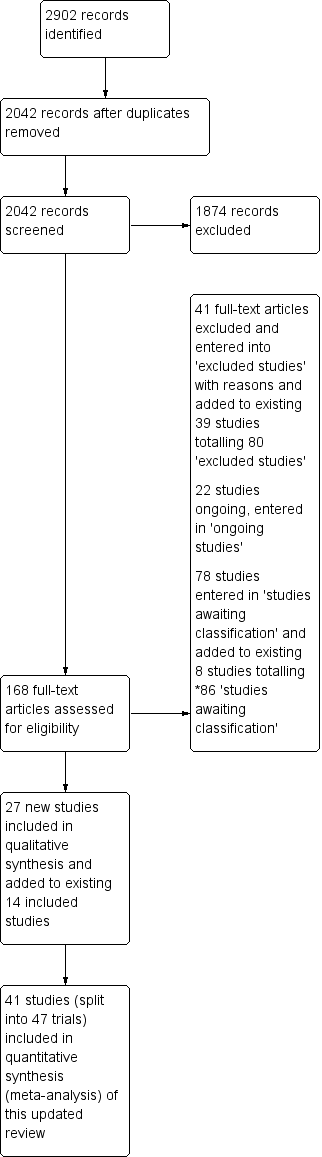
Study Flow Diagram, *86 studies awaiting classification.
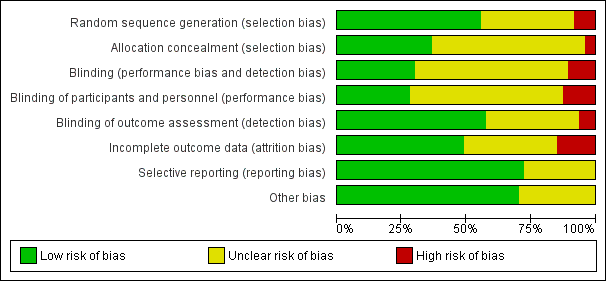
'Risk of bias' graph: review authors' judgements about each 'Risk of bias' item presented as percentages across all included studies.

Comparison 1 Swallowing therapy, Outcome 1 Functional outcome ‐ death or dependency, death or disability at end of trial.

Comparison 1 Swallowing therapy, Outcome 2 Case fatality at end of trial.

Comparison 1 Swallowing therapy, Outcome 3 Length of inpatient stay (days).

Comparison 1 Swallowing therapy, Outcome 4 Proportion of participants with dysphagia at end of trial.

Comparison 1 Swallowing therapy, Outcome 5 Swallowing ability.

Comparison 1 Swallowing therapy, Outcome 6 Penetration aspiration score.

Comparison 1 Swallowing therapy, Outcome 7 Chest infection or pneumonia.

Comparison 1 Swallowing therapy, Outcome 8 Pharyngeal transit time (seconds).

Comparison 1 Swallowing therapy, Outcome 9 Institutionalisation.

Comparison 1 Swallowing therapy, Outcome 10 Nutritional (albumin).
| Swallowing therapy compared to placebo for dysphagia in acute and subacute stroke | ||||||
| Patient or population: dysphagia in acute and subacute stroke | ||||||
| Outcomes | Anticipated absolute effects* (95% CI) | Relative effect | No. of participants | Certainty of the evidence | Comments | |
| Risk with placebo | Risk with swallowing therapy | |||||
| Death or dependency at end of trial | Study population | OR 1.05 | 306 | ⊕⊕⊕⊝ | a | |
| 693 per 1000 | 703 per 1000 | |||||
| Case fatality at end of trial | Study population | OR 1.00 | 766 | ⊕⊕⊕⊝ | b | |
| 197 per 1000 | 197 per 1000 | |||||
| Length of inpatient stay (days) | Mean length of inpatient stay (days) ranged from 19 to 119 | MD 2.9 lower | ‐ | 577 | ⊕⊕⊕⊝ | c |
| Proportion of participants with dysphagia at end of trial | Study population | OR 0.42 | 1487 | ⊕⊕⊝⊝ | d | |
| 570 per 1000 | 357 per 1000 | |||||
| Swallowing ability | Mean swallowing ability was 0 | SMD 0.66 lower | ‐ | 1173 | ⊕⊝⊝⊝ | e |
| Penetration aspiration score | Mean penetration aspiration score was 0 | SMD 0.37 lower | ‐ | 303 | ⊕⊕⊝⊝ | f |
| Adverse event: chest infection or pneumonia | Study population | OR 0.34 | 676 | ⊕⊝⊝⊝ | g | |
| 343 per 1000 | 151 per 100 | |||||
| *The risk in the intervention group (and its 95% confidence interval) is based on the assumed risk in the comparison group and the relative effect of the intervention (and its 95% CI). | ||||||
| GRADE Working Group grades of evidence. | ||||||
| aDowngraded by one level due to lack of precision (one study split into two trials). bDowngraded by one level for indirectness of the evidence (i.e. multiple different interventions). cDowngraded by one level due to indirectness of the evidence (i.e. multiple different interventions). Note also that two studies had unclear blinding. dDowngraded by two levels due to indirectness of the evidence and blinding ‐ a large number of studies did not clarify blinding status. eDowngraded by three levels due to indirectness of the evidence (i.e. multiple different interventions), considerable heterogeneity, and fair number of studies did not clarify blinding status. fDowngraded by two levels due to indirectness of the evidence (i.e. multiple different interventions) and moderate heterogeneity. gDowngraded by three levels due to indirectness of the evidence (i.e. multiple different interventions), substantial heterogeneity, and fair number of studies did not clarify blinding status. | ||||||
| Outcome or subgroup title | No. of studies | No. of participants | Statistical method | Effect size |
| 1 Functional outcome ‐ death or dependency, death or disability at end of trial Show forest plot | 2 | 306 | Odds Ratio (M‐H, Random, 95% CI) | 1.05 [0.63, 1.75] |
| 1.1 Behavioural interventions | 2 | 306 | Odds Ratio (M‐H, Random, 95% CI) | 1.05 [0.63, 1.75] |
| 2 Case fatality at end of trial Show forest plot | 14 | 766 | Odds Ratio (M‐H, Random, 95% CI) | 1.00 [0.66, 1.52] |
| 2.1 Behavioural interventions | 2 | 306 | Odds Ratio (M‐H, Random, 95% CI) | 0.83 [0.46, 1.51] |
| 2.2 Drug therapy | 3 | 148 | Odds Ratio (M‐H, Random, 95% CI) | 1.40 [0.31, 6.28] |
| 2.3 Pharyngeal electrical stimulation | 4 | 215 | Odds Ratio (M‐H, Random, 95% CI) | 0.92 [0.38, 2.26] |
| 2.4 Physical stimulation (thermal, tactile) | 1 | 19 | Odds Ratio (M‐H, Random, 95% CI) | 1.05 [0.16, 6.92] |
| 2.5 Transcranial magnetic stimulation | 4 | 78 | Odds Ratio (M‐H, Random, 95% CI) | 0.28 [0.03, 2.93] |
| 3 Length of inpatient stay (days) Show forest plot | 8 | 577 | Mean Difference (IV, Random, 95% CI) | ‐2.90 [‐5.65, ‐0.15] |
| 3.1 Behavioural interventions | 4 | 370 | Mean Difference (IV, Random, 95% CI) | ‐2.70 [‐5.68, 0.28] |
| 3.2 Pharyngeal electrical stimulation | 4 | 207 | Mean Difference (IV, Random, 95% CI) | ‐6.05 [‐16.40, 4.31] |
| 4 Proportion of participants with dysphagia at end of trial Show forest plot | 23 | 1487 | Odds Ratio (M‐H, Random, 95% CI) | 0.42 [0.32, 0.55] |
| 4.1 Acupuncture | 8 | 676 | Odds Ratio (M‐H, Random, 95% CI) | 0.31 [0.20, 0.49] |
| 4.2 Behavioural interventions | 6 | 511 | Odds Ratio (M‐H, Random, 95% CI) | 0.45 [0.28, 0.74] |
| 4.3 Drug therapy | 1 | 17 | Odds Ratio (M‐H, Random, 95% CI) | 0.48 [0.07, 3.35] |
| 4.4 Neuromuscular electrical stimulation | 2 | 76 | Odds Ratio (M‐H, Random, 95% CI) | 0.51 [0.18, 1.49] |
| 4.5 Pharyngeal electrical stimulation | 3 | 66 | Odds Ratio (M‐H, Random, 95% CI) | 0.55 [0.15, 2.11] |
| 4.6 Physical stimulation (thermal, tactile) | 2 | 127 | Odds Ratio (M‐H, Random, 95% CI) | 0.65 [0.07, 5.85] |
| 4.7 Transcranial direct current stimulation | 1 | 14 | Odds Ratio (M‐H, Random, 95% CI) | 0.29 [0.01, 8.39] |
| 5 Swallowing ability Show forest plot | 26 | 1173 | Std. Mean Difference (IV, Random, 95% CI) | ‐0.66 [‐1.01, ‐0.32] |
| 5.1 Acupuncture | 6 | 496 | Std. Mean Difference (IV, Random, 95% CI) | ‐0.55 [‐1.20, 0.11] |
| 5.2 Behavioural intervention | 3 | 121 | Std. Mean Difference (IV, Random, 95% CI) | ‐0.56 [‐1.07, ‐0.05] |
| 5.3 Drug therapy | 1 | 71 | Std. Mean Difference (IV, Random, 95% CI) | ‐0.46 [‐0.93, 0.01] |
| 5.4 Neuromuscular electrical stimulation | 2 | 100 | Std. Mean Difference (IV, Random, 95% CI) | ‐1.34 [‐3.39, 0.71] |
| 5.5 Pharyngeal electrical stimulation | 3 | 194 | Std. Mean Difference (IV, Random, 95% CI) | 0.06 [‐0.22, 0.34] |
| 5.6 Physical stimulation (thermal, tactile) | 1 | 16 | Std. Mean Difference (IV, Random, 95% CI) | ‐0.30 [‐1.29, 0.68] |
| 5.7 Transcranial direct current stimulation | 2 | 34 | Std. Mean Difference (IV, Random, 95% CI) | ‐0.33 [‐2.22, 1.56] |
| 5.8 Transcranial magnetic stimulation | 8 | 141 | Std. Mean Difference (IV, Random, 95% CI) | ‐1.29 [‐2.37, ‐0.21] |
| 6 Penetration aspiration score Show forest plot | 11 | 303 | Std. Mean Difference (IV, Random, 95% CI) | ‐0.37 [‐0.74, ‐0.00] |
| 6.1 Behavioural intervention | 1 | 27 | Std. Mean Difference (IV, Random, 95% CI) | ‐0.88 [‐1.68, ‐0.08] |
| 6.2 Neuromuscular electrical stimulation | 1 | 18 | Std. Mean Difference (IV, Random, 95% CI) | 0.57 [‐0.38, 1.52] |
| 6.3 Pharyngeal electrical stimulation | 4 | 177 | Std. Mean Difference (IV, Random, 95% CI) | ‐0.17 [‐0.53, 0.19] |
| 6.4 Transcranial magnetic stimulation | 5 | 81 | Std. Mean Difference (IV, Random, 95% CI) | ‐0.53 [‐1.22, 0.16] |
| 7 Chest infection or pneumonia Show forest plot | 9 | 618 | Odds Ratio (M‐H, Random, 95% CI) | 0.36 [0.16, 0.78] |
| 7.1 Behavioural interventions | 6 | 473 | Odds Ratio (M‐H, Random, 95% CI) | 0.56 [0.31, 1.00] |
| 7.2 Drug therapy | 1 | 60 | Odds Ratio (M‐H, Random, 95% CI) | 0.06 [0.01, 0.21] |
| 7.3 Neuromuscular electrical stimulation | 1 | 57 | Odds Ratio (M‐H, Random, 95% CI) | 0.0 [0.0, 0.0] |
| 7.4 Pharyngeal electrical stimulation | 1 | 28 | Odds Ratio (M‐H, Random, 95% CI) | 0.43 [0.06, 3.09] |
| 8 Pharyngeal transit time (seconds) Show forest plot | 6 | 187 | Mean Difference (IV, Random, 95% CI) | ‐0.23 [‐0.32, ‐0.15] |
| 8.1 Drug therapy | 1 | 17 | Mean Difference (IV, Random, 95% CI) | ‐0.21 [‐0.91, 0.49] |
| 8.2 Neuromuscular electrical stimulation | 3 | 126 | Mean Difference (IV, Random, 95% CI) | ‐0.23 [‐0.39, ‐0.08] |
| 8.3 Pharyngeal electrical stimulation | 1 | 28 | Mean Difference (IV, Random, 95% CI) | ‐0.15 [‐0.67, 0.37] |
| 8.4 Physical stimulation (thermal, tactile) | 1 | 16 | Mean Difference (IV, Random, 95% CI) | ‐0.19 [‐0.34, ‐0.04] |
| 9 Institutionalisation Show forest plot | 3 | 447 | Odds Ratio (M‐H, Random, 95% CI) | 0.75 [0.47, 1.19] |
| 9.1 Behavioural interventions | 2 | 306 | Odds Ratio (M‐H, Random, 95% CI) | 0.76 [0.39, 1.48] |
| 9.2 Pharyngeal electrical stimulation | 1 | 141 | Odds Ratio (M‐H, Random, 95% CI) | 0.73 [0.36, 1.48] |
| 10 Nutritional (albumin) Show forest plot | 3 | 169 | Mean Difference (IV, Random, 95% CI) | 0.37 [‐1.50, 2.24] |
| 10.1 Behavioural interventions | 2 | 64 | Mean Difference (IV, Random, 95% CI) | 0.20 [‐4.77, 5.17] |
| 10.2 Pharyngeal electrical stimulation | 1 | 105 | Mean Difference (IV, Random, 95% CI) | 0.40 [‐1.62, 2.42] |