Ambulatory oxygen for people with chronic obstructive pulmonary disease who are not hypoxaemic at rest
Information
- DOI:
- https://doi.org/10.1002/14651858.CD000238.pub2Copy DOI

- Database:
-
- Cochrane Database of Systematic Reviews
- Version published:
-
- 24 June 2014see what's new
- Type:
-
- Intervention
- Stage:
-
- Review
- Cochrane Editorial Group:
-
Cochrane Airways Group
- Copyright:
-
- Copyright © 2015 The Cochrane Collaboration. Published by John Wiley & Sons, Ltd.
Article metrics
Altmetric:
Cited by:
Authors
Contributions of authors
Faisal Ameer is the lead investigator for this review. Contributions included completion and submission of the ‘review update registration form’ including development of the updated protocol for the review, screening and selection of studies for inclusion, data extraction, data entry, interpretation of the analysis and complete write‐up of the manuscript draft.
Kristin Carson assisted with the ‘review update registration form,’ screening and selection of studies, data extraction, data entry, interpretation of analysis and write‐up of the final manuscript.
Zafar Usmani screened and selected studies for inclusion, performed data extraction and data entry and assisted with interpretation of the analysis and write‐up of the final manuscript.
Brian Smith supervised the review update process, interpreted the analysis and assisted with write‐up of the final manuscript.
Sources of support
Internal sources
-
Respiratory Medicine Unit; The Queen Elizabeth Hospital, Australia.
External sources
-
No sources of support supplied
Declarations of interest
None known.
Acknowledgements
We would like to thank all staff at the Cochrane Airways Group, in particular Emma Welsh, Elizabeth Stovold, Emma Jackson and Chris Cates for their ongoing help and support. We also wish to thank peer reviewers for their time and valuable feedback.
Michael Greenstone was the Editor for this review and commented critically on the review.
Version history
| Published | Title | Stage | Authors | Version |
| 2014 Jun 24 | Ambulatory oxygen for people with chronic obstructive pulmonary disease who are not hypoxaemic at rest | Review | Faisal Ameer, Kristin V Carson, Zafar A Usmani, Brian J Smith | |
| 2002 Jan 21 | Ambulatory oxygen for chronic obstructive pulmonary disease | Review | Felix SF Ram, Jadwiga A Wedzicha | |
Differences between protocol and review
There have been several amendments between the protocol and review for this update, including:
-
Alteration to the objective of the review
-
Definition of 'long term' given as >two weeks
-
Types of participants revised as per the inclusion criteria
-
Mortality included as primary outcomes instead of secondary outcome
-
Length of stay, quality of life, adverse events and hospitalisations added as secondary outcomes
-
Search terms truncated
-
Cochrane risk of bias tool applied replacing the Jadad score
-
Statistical methodology defined with greater detail
-
Added summary of findings table
Keywords
MeSH
Medical Subject Headings (MeSH) Keywords
Medical Subject Headings Check Words
Humans;
PICOs


Risk of bias summary: review authors' judgements about each risk of bias item for each included study.

Comparison 1 Ambulatory oxygen therapy versus placebo (air), Outcome 1 6MWD (cylinder air for 6MWD).

Comparison 1 Ambulatory oxygen therapy versus placebo (air), Outcome 2 6MWD outcome (cylinder oxygen for 6MWD).
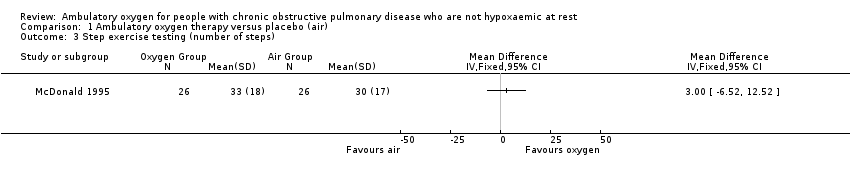
Comparison 1 Ambulatory oxygen therapy versus placebo (air), Outcome 3 Step exercise testing (number of steps).
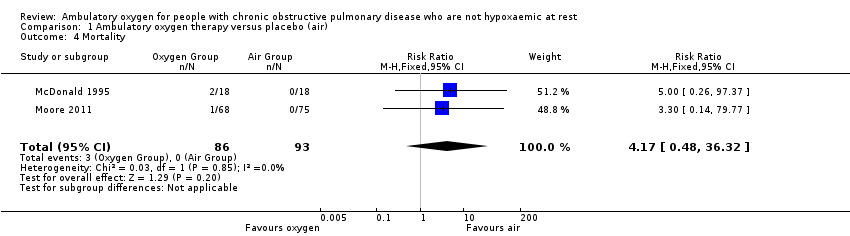
Comparison 1 Ambulatory oxygen therapy versus placebo (air), Outcome 4 Mortality.
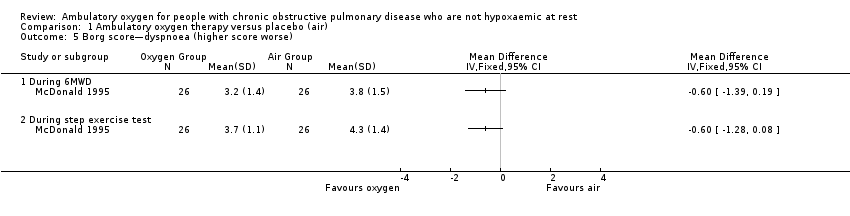
Comparison 1 Ambulatory oxygen therapy versus placebo (air), Outcome 5 Borg score—dyspnoea (higher score worse).

Comparison 1 Ambulatory oxygen therapy versus placebo (air), Outcome 6 Arterial oxygen saturation during exercise.

Comparison 1 Ambulatory oxygen therapy versus placebo (air), Outcome 7 Quality of life (Chronic Respiratory Questionnaire).

Comparison 1 Ambulatory oxygen therapy versus placebo (air), Outcome 8 SpO2.
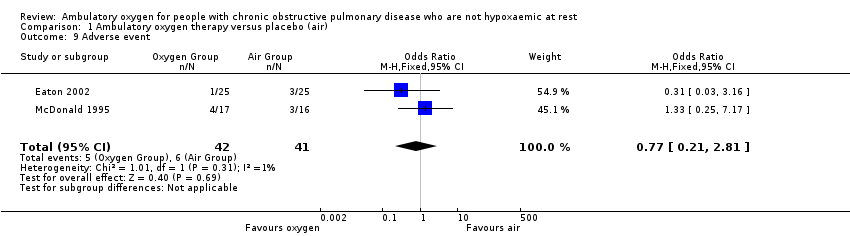
Comparison 1 Ambulatory oxygen therapy versus placebo (air), Outcome 9 Adverse event.
| Ambulatory oxygen for COPD | ||||||
| Patient or population: adults with COPD who had exertional dyspnoea but did not fulfil the criteria for long‐term oxygen treatment Control: placebo/medical air | ||||||
| Outcomes | Illustrative comparative risks* (95% CI) | Relative effect | No. of participants | Quality of the evidence | Comments | |
| Assumed risk | Corresponding risk | |||||
| Control | Ambulatory oxygen | |||||
| Exercise capacity (5‐ or 6‐minute walking distance on cylinder air) | See comment | See comment | Not estimable | 331 | Not applicable | Meta‐analysis not possible; see effects of interventions for more information |
| Mortality | See comment | See comment | RR 4.17 | 179 | ⊕⊕⊕⊝1 Moderate | Although deaths occurred only in the intervention arm of the study (n = 3), they were not believed to be a direct result of the intervention |
| Quality of life (dyspnoea) Follow‐up: 2 to 12 weeks | Baseline risk in control groups ranged from 2.8 to 3.7 points | Mean quality of life (dyspnoea) in the intervention groups was | MD 0.28 (0.10 to 0.45) | 341 | ⊕⊕⊕⊝2 Moderate | Other CRQ domains were also reported, including fatigue MD 0.14 (95% CI 0.04 to 0.31; P value 0.009), emotional function MD 0.10 (95% CI ‐0.05 to 0.25; P value 0.20) and mastery MD 0.13 (95% CI ‐0.06 to 0.33; P value 0.17) |
| Dyspnoea | See comment | See comment | Not estimable | 198 | Not applicable | Meta‐analysis not possible Dyspnoea was measured in 3 studies using the Borg scale, and 1 study reported dyspnoea during exercise. One study observed improvement in dyspnoea after walking for 6 minutes with cylinder air or oxygen. Another study showed a clinically relevant reduction in dyspnoea scores for the oxygen group post 5MWD compared with placebo |
| Adverse events | 146 per 1000 | 117 per 1000 | OR 0.77 | 83 | ⊕⊕⊝⊝ | Only 1 of the adverse events appeared related to the intervention; this was strain due to carrying the cylinder |
| Hospitalisations | See comment | See comment | Not estimable | 0 | See comment | No studies reported data on hospitalisations |
| *The basis for the assumed risk (e.g. the median control group risk across studies) is provided in footnotes. The corresponding risk (and its 95% confidence interval) is based on the assumed risk in the comparison group and the relative effect of the intervention (and its 95% CI). | ||||||
| GRADE Working Group grades of evidence. | ||||||
| 1 Imprecision 2 Unclear risk for selection bias in 2 studies, attrition bias in 2 studies and selective reporting in 3 studies 3 Unclear risk of selection bias, attrition bias and selective reporting in 1 study | ||||||
| Outcome or subgroup title | No. of studies | No. of participants | Statistical method | Effect size |
| 1 6MWD (cylinder air for 6MWD) Show forest plot | 2 | Odds Ratio (Fixed, 95% CI) | 1.05 [0.62, 1.75] | |
| 2 6MWD outcome (cylinder oxygen for 6MWD) Show forest plot | 1 | Odds Ratio (Fixed, 95% CI) | Totals not selected | |
| 3 Step exercise testing (number of steps) Show forest plot | 1 | Mean Difference (IV, Fixed, 95% CI) | Totals not selected | |
| 4 Mortality Show forest plot | 2 | 179 | Risk Ratio (M‐H, Fixed, 95% CI) | 4.17 [0.48, 36.32] |
| 5 Borg score—dyspnoea (higher score worse) Show forest plot | 1 | Mean Difference (IV, Fixed, 95% CI) | Totals not selected | |
| 5.1 During 6MWD | 1 | Mean Difference (IV, Fixed, 95% CI) | 0.0 [0.0, 0.0] | |
| 5.2 During step exercise test | 1 | Mean Difference (IV, Fixed, 95% CI) | 0.0 [0.0, 0.0] | |
| 6 Arterial oxygen saturation during exercise Show forest plot | 1 | Mean Difference (IV, Fixed, 95% CI) | Subtotals only | |
| 6.1 During 6MWD | 1 | 52 | Mean Difference (IV, Fixed, 95% CI) | ‐0.60 [‐1.56, 0.36] |
| 6.2 During step exercise test | 1 | 52 | Mean Difference (IV, Fixed, 95% CI) | ‐0.60 [‐2.32, 1.12] |
| 7 Quality of life (Chronic Respiratory Questionnaire) Show forest plot | 4 | Mean Difference (Fixed, 95% CI) | Subtotals only | |
| 7.1 CRQ—dyspnoea | 4 | Mean Difference (Fixed, 95% CI) | 0.28 [0.10, 0.45] | |
| 7.2 CRQ—fatigue | 4 | Mean Difference (Fixed, 95% CI) | 0.17 [0.04, 0.31] | |
| 7.3 CRQ—emotional function | 4 | Mean Difference (Fixed, 95% CI) | 0.10 [‐0.05, 0.25] | |
| 7.4 CRQ—mastery | 4 | Mean Difference (Fixed, 95% CI) | 0.13 [‐0.06, 0.33] | |
| 8 SpO2 Show forest plot | 2 | 136 | Mean Difference (IV, Fixed, 95% CI) | 6.52 [5.21, 7.83] |
| 8.1 During exercise | 1 | 54 | Mean Difference (IV, Fixed, 95% CI) | 6.0 [4.11, 7.89] |
| 8.2 Post 6MWD | 1 | 82 | Mean Difference (IV, Fixed, 95% CI) | 7.0 [5.18, 8.82] |
| 9 Adverse event Show forest plot | 2 | 83 | Odds Ratio (M‐H, Fixed, 95% CI) | 0.77 [0.21, 2.81] |